• Trade
  • Markets
  • Copy
  • Contests
  • 24/7
  • Calendar
  • Q&A
  • Chats
Screeners
SYMBOL
LAST
BID
ASK
HIGH
LOW
NET CHG.
%CHG.
SPREAD
SOURCE
SPX
S&P 500 Index
7378.75
7378.75
7378.75
7381.64
7349.50
-24.29
-0.33%
--
--
DJI
Dow Jones Industrial Average
49551.58
49551.58
49551.58
49696.53
49245.11
-134.53
-0.27%
--
--
IXIC
NASDAQ Composite Index
25972.23
25972.23
25972.23
26026.17
25853.75
-118.50
-0.45%
--
--
USDX
US Dollar Index
99.180
99.180
99.260
99.270
98.860
+0.290
+ 0.29%
--
--
EURUSD
Euro / US Dollar
1.16137
1.16137
1.16144
1.16612
1.16012
-0.00420
-0.36%
--
--
GBPUSD
Pound Sterling / US Dollar
1.34027
1.34027
1.34036
1.34368
1.33858
-0.00300
-0.22%
--
--
XAUUSD
Gold / US Dollar
4508.60
4508.60
4509.01
4589.00
4464.72
-57.76
-1.26%
--
--
WTI
Light Sweet Crude Oil
102.695
102.695
102.725
104.004
101.420
+0.657
+ 0.64%
--
--

Community Accounts

Signal Accounts
--
Profit Accounts
--
Loss Accounts
--
View More

Become a signal provider

Sell trading signals to earn additional income

View More

Guide to Copy Trading

Get started with ease and confidence

View More

Signal Accounts for Members

All Signal Accounts

Best Return
  • Best Return
  • Best P/L
  • Best MDD
Past 1W
  • Past 1W
  • Past 1M
  • Past 1Y

All Contests

  • All
  • Recommend
  • Stocks
  • Cryptocurrencies
  • Central Banks
  • Trump Updates
  • Featured News
Top News Only
Share

U.S. Treasury Secretary Bessenter: If The Japanese Government Grants Bank Of Japan Governor Kazuo Ueda Sufficient Independence, He Will "take The Necessary Measures"

Share

Inflation Concerns Intensify As The 30-year U.S. Treasury Yield Surges To 5.18%

Share

The Yield On The 10-year U.S. Treasury Note Rose To 4.663%, Its Highest Level Since January 2025

Share

European Commission: Today, The European Commission Adopted The Fertilizer Action Plan, Which Aims To Support Farmers Facing Rising Fertilizer Costs And Shortages, Strengthen Domestic Production, And Reduce Europe's Dependence On Imports

Share

The Yield On 30-year U.S. Treasury Bonds Continued To Rise, Reaching 3.181%, Marking Its Highest Level Since 2007

Share

Spot Gold Continues To Decline, Falling Below $4,500 Per Ounce And Dropping Nearly 2% Within The Day. Spot Silver Has Slipped Below $74 Per Ounce, Down Nearly 6% On The Day. U.S. Gold Stocks Opened Lower Across The Board, With Cordillera Mining Down More Than 4% And Newmont Down More Than 3%

Share

Spot Gold Continued Its Sharp Decline, Falling Below $4,470 Per Ounce, Down 2.13% On The Day. Spot Silver Plunged $4 On The Day, Currently Trading At $73.64 Per Ounce, A Drop Of 5.18%

Share

Spot Gold Fell Below $4,490 Per Ounce, Down 1.68% On The Day

Share

The Most Active Shanghai Silver Futures Contract Fell 4.22% Intraday, Currently Trading At 18,056 Yuan/kg. The Most Active Shanghai Gold Futures Contract Fell Over 1% Intraday, Currently Trading At 987.74 Yuan/gram

Share

Spot Silver Fell 5.00% Intraday, Currently Trading At $73.73 Per Ounce. New York Silver Futures Fell Below $74 Per Ounce, Down 4.45% Intraday

Share

Spot Gold Continued Its Decline, Breaching The $4,500 Per Ounce Level And Falling 1.45% On The Day. Spot Silver Retreated Below $74 Per Ounce, Down 4.74% On The Day

Share

[Spot Gold Breaks Below $4500 Mark] May 19th, According To Bitget Market Data, The Spot Gold Price Continued To Fall, Dropping Below $4500 Per Ounce, With A 1.45% Intraday Decline.Spot Silver Fell Below $74 Per Ounce, With A 4.74% Intraday Decline

Share

The SC Crude Oil Futures Contract Rose 2.00% Intraday, Currently Trading At 687.30 Yuan/barrel. The Styrene (EB) Futures Contract Rose 2.00% Intraday, Currently Trading At 9486.00 Yuan/ton. The Low-sulfur Fuel Oil (LU) Futures Contract Rose 2.00% Intraday, Currently Trading At 5262.00 Yuan/ton

Share

The Yield On The 30-year U.S. Treasury Note Rose To 5.177%, The Highest Level Since 2007

Share

The Yield On 10-year U.S. Treasury Bonds Continued To Rise, Reaching 4.569%

Share

The White House: Trump Will Sign An Executive Order At 4:30 P.m. Eastern Time (4:30 A.m. Beijing Time On Wednesday)

Share

Spot Gold Fell Below $4,510 Per Ounce, Down 1.24% On The Day. Spot Silver Fell Below $75 Per Ounce, Down 3.44% On The Day

Share

US Treasury Secretary Bessen: Middle Eastern Countries Also Need To Eradicate Iran's Shadow Banking Network

Share

U.S. Treasury Secretary Bessenter: Some Of The U.S. Sanctions Lists Are Outdated And Could Lead To Unintended Consequences

Share

Goldman Sachs: Rising Oil Prices, Persistent Inflation, And Climbing Bond Yields Could Trigger A Recent Stock Market Correction

TIME
ACT
FCST
PREV
IMPACT
U.S. Manufacturing Output MoM (SA) (Apr)

A:--

F: --

P: --
USDX
  • USDX
  • XAUUSD
  • XAGUSD
  • WTI
Russia CPI YoY (Apr)

A:--

F: --

P: --

WTI
  • WTI
  • XAUUSD
  • XAGUSD
  • USDX
U.S. Weekly Total Oil Rig Count

A:--

F: --

P: --

WTI
  • WTI
  • XAUUSD
  • XAGUSD
  • USDX
U.S. Weekly Total Rig Count

A:--

F: --

P: --

WTI
  • WTI
  • XAUUSD
  • XAGUSD
  • USDX
U.K. Rightmove House Price Index YoY (May)

A:--

F: --

P: --

GBPUSD
  • GBPUSD
  • XAUUSD
  • XAGUSD
  • WTI
  • USDX
China, Mainland Industrial Output YoY (YTD) (Apr)

A:--

F: --

P: --

XAUUSD
  • XAUUSD
  • XAGUSD
  • WTI
  • USDX
China, Mainland Urban Area Unemployment Rate (Apr)

A:--

F: --

P: --

XAUUSD
  • XAUUSD
  • XAGUSD
  • WTI
  • USDX
Turkey Consumer Confidence Index (May)

A:--

F: --

P: --

XAUUSD
  • XAUUSD
  • XAGUSD
  • WTI
  • USDX
U.S. NAHB Housing Market Index (May)

A:--

F: --

P: --

USDX
  • USDX
  • XAUUSD
  • XAGUSD
  • WTI
Japan Real GDP QoQ (Q1)

A:--

F: --

P: --
USDJPY
  • USDJPY
  • XAUUSD
  • XAGUSD
  • WTI
  • USDX
Japan Nominal GDP Prelim QoQ (Q1)

A:--

F: --

P: --

USDJPY
  • USDJPY
  • XAUUSD
  • XAGUSD
  • WTI
  • USDX
RBA Monetary Policy Meeting Minutes
U.K. 3-Month ILO Unemployment Rate (Mar)

A:--

F: --

P: --

GBPUSD
  • GBPUSD
  • XAUUSD
  • XAGUSD
  • WTI
  • USDX
U.K. Unemployment Rate (Apr)

A:--

F: --

P: --

GBPUSD
  • GBPUSD
  • XAUUSD
  • XAGUSD
  • WTI
  • USDX
U.K. Unemployment Claimant Count (Apr)

A:--

F: --

P: --
GBPUSD
  • GBPUSD
  • XAUUSD
  • XAGUSD
  • WTI
  • USDX
U.K. 3-Month ILO Employment Change (Mar)

A:--

F: --

P: --

GBPUSD
  • GBPUSD
  • XAUUSD
  • XAGUSD
  • WTI
  • USDX
U.K. Average Weekly Earnings (3-Month Average, Excluding Bonuses) YoY (Mar)

A:--

F: --

P: --

GBPUSD
  • GBPUSD
  • XAUUSD
  • XAGUSD
  • WTI
  • USDX
U.K. Average Weekly Earnings (3-Month Average, Including Bonuses) YoY (Mar)

A:--

F: --

P: --
GBPUSD
  • GBPUSD
  • XAUUSD
  • XAGUSD
  • WTI
  • USDX
Euro Zone Trade Balance (SA) (Mar)

A:--

F: --

P: --
EURUSD
  • EURUSD
  • XAUUSD
  • XAGUSD
  • WTI
  • USDX
Euro Zone Trade Balance (Not SA) (Mar)

A:--

F: --

P: --
EURUSD
  • EURUSD
  • XAUUSD
  • XAGUSD
  • WTI
  • USDX
Canada National Economic Confidence Index

A:--

F: --

P: --

USDCAD
  • USDCAD
  • XAUUSD
  • XAGUSD
  • WTI
  • USDX
European Central Bank Chief Economist Lane and Federal Reserve Governor Waller spoke at the European Central Bank research conference.
Canada CPI MoM (Apr)

A:--

F: --

P: --

WTI
  • WTI
  • XAUUSD
  • XAGUSD
  • USDX
Canada CPI YoY (Apr)

A:--

F: --

P: --

WTI
  • WTI
  • XAUUSD
  • XAGUSD
  • USDX
Canada Building Permits MoM (SA) (Mar)

A:--

F: --

P: --
USDCAD
  • USDCAD
  • XAUUSD
  • XAGUSD
  • WTI
  • USDX
Canada New Housing Price Index MoM (Apr)

A:--

F: --

P: --

USDCAD
  • USDCAD
  • XAUUSD
  • XAGUSD
  • WTI
  • USDX
Canada Trimmed CPI YoY (SA) (Apr)

A:--

F: --

P: --

WTI
  • WTI
  • XAUUSD
  • XAGUSD
  • USDX
Canada Core CPI YoY (Apr)

A:--

F: --

P: --

WTI
  • WTI
  • XAUUSD
  • XAGUSD
  • USDX
Canada Core CPI MoM (Apr)

A:--

F: --

P: --

WTI
  • WTI
  • XAUUSD
  • XAGUSD
  • USDX
U.S. Weekly Redbook Index YoY

A:--

F: --

P: --

XAUUSD
  • XAUUSD
  • XAGUSD
  • WTI
  • USDX
U.S. Pending Home Sales Index (Apr)

--

F: --

P: --

U.S. Pending Home Sales Index MoM (SA) (Apr)

--

F: --

P: --

U.S. Pending Home Sales Index YoY (Apr)

--

F: --

P: --

U.S. API Weekly Cushing Crude Oil Stocks

--

F: --

P: --

U.S. API Weekly Crude Oil Stocks

--

F: --

P: --

U.S. API Weekly Gasoline Stocks

--

F: --

P: --

U.S. API Weekly Refined Oil Stocks

--

F: --

P: --

Japan Reuters Tankan Non-Manufacturers Index (May)

--

F: --

P: --

Japan Reuters Tankan Manufacturers Index (May)

--

F: --

P: --

Philadelphia Fed President Henry Paulson delivers a speech
Australia Westpac Leading Index MoM (Apr)

--

F: --

P: --

China, Mainland 1-Year Loan Prime Rate (LPR)

--

F: --

P: --

China, Mainland 5-Year Loan Prime Rate

--

F: --

P: --

U.K. Core CPI MoM (Apr)

--

F: --

P: --

U.K. CPI YoY (Apr)

--

F: --

P: --

U.K. Output PPI YoY (Not SA) (Apr)

--

F: --

P: --

U.K. Input PPI YoY (Not SA) (Apr)

--

F: --

P: --

U.K. Core CPI YoY (Apr)

--

F: --

P: --

U.K. Output PPI MoM (Not SA) (Apr)

--

F: --

P: --

U.K. Retail Prices Index YoY (Apr)

--

F: --

P: --

U.K. Core Retail Prices Index YoY (Apr)

--

F: --

P: --

U.K. Input PPI MoM (Not SA) (Apr)

--

F: --

P: --

Germany PPI YoY (Apr)

--

F: --

P: --

Germany PPI MoM (Apr)

--

F: --

P: --

U.K. Retail Prices Index MoM (Apr)

--

F: --

P: --

U.K. CPI MoM (Apr)

--

F: --

P: --

Indonesia 7-Day Reverse Repo Rate

--

F: --

P: --

Indonesia Loan Growth YoY (Apr)

--

F: --

P: --

Indonesia Lending Facility Rate (May)

--

F: --

P: --

Indonesia Deposit Facility Rate (May)

--

F: --

P: --

South Africa Core CPI YoY (Apr)

--

F: --

P: --

Q&A with Experts
    • All
    • Chatrooms
    • Groups
    • Friends
    marsgents flag
    nice i long 4468 🤣
    Victor flag
    sonam
    Gold Buy All TP Hit 220 pips Done
    @sonamMy TP1 200 is also finished.
    C.E.O flag
    EuroTrader
    @C.E.OBitcoin is still consolidating, it hasn't picked a side yet
    @EuroTrader76560 saya masuk belian kecil 0.01 ia berlaku semasa saya sibuk jualan emas 4521 tp 4490
    Victor flag
    It's all thanks to you.
    Size flag
    Now let’s see if gold actually listens this time 😄.@srinivas
    Mickey flag
    EuroTrader
    @Mickey That's how it should be man. Keep a low profile and make the money low key
    gat you man
    EuroTrader flag
    Mickey flag
    Size
    Now let’s see if gold actually listens this time 😄.@srinivas
    but seriously gold is get close to buy.watch your back
    EuroTrader flag
    EuroTrader
    @Mickey high risk shorts on Bitcoin I just took. Are you joining me in this shorts
    C.E.O flag
    andre andre andre
    Mickey flag
    EuroTrader
    @Mickey high risk shorts on Bitcoin I just took. Are you joining me in this shorts
    @EuroTraderonly gold man
    Victor flag
    C.E.O
    @EuroTrader76560 saya masuk belian kecil 0.01 ia berlaku semasa saya sibuk jualan emas 4521 tp 4490
    @C.E.OHaha, that's the epitome of a multitask trader, bro!
    Size flag
    Mickey
    but seriously gold is get close to buy.watch your back
    @Mickey yeah it’s getting into an interesting zone now.
    Victor flag
    Having just scalped gold from 4521 down to 4490, then switching to picking up BTC at 76560 was a pretty good move
    Size flag
    But with the volatility today, I’d still wait for confirmation before trusting the buy fully@Mickey
    favour flag
    EuroTrader
    @Mickey high risk shorts on Bitcoin I just took. Are you joining me in this shorts
    @EuroTraderdid u see the chart I shared on GU
    DumbMoney$$$ flag
    hey guys
    marsgents flag
    srinivas
    STOP SHORTING gold!!!
    @srinivasi do both bro long 68 to 5m body 92🤑 short 4525 i close it at 70😁🤣
    srinivas flag
    marsgents
    @srinivasi do both bro long 68 to 5m body 92🤑 short 4525 i close it at 70😁🤣
    @marsgentsi will post my trades today
    C.E.O flag
    Victor
    @C.E.OHaha, that's the epitome of a multitask trader, bro!
    @Victoruntuk emas saya dah kongsi carta saya pagi dan petang tadi.saya dah bagitahu awal jika emas tembus 4521 anda tahu apa yang harus dilakukan
    Type here...
    Add Symbol or Code

      No matching data

      All
      Recommend
      Stocks
      Cryptocurrencies
      Central Banks
      Trump Updates
      Featured News
      • All
      • Russia-Ukraine Conflict
      • Middle East Flashpoint
      • All
      • Russia-Ukraine Conflict
      • Middle East Flashpoint
      Search
      Products

      Charts Free Forever

      Chats Q&A with Experts
      Screeners Economic Calendar Data Tools
      Membership Features
      Data Warehouse Market Trends Institutional Data Policy Rates Macro

      Market Trends

      Market Sentiment Order Book Forex Correlations

      Top Indicators

      Charts Free Forever
      Markets

      News

      24/7 Analysis Education

      Latest Views

      Latest Update

      Signals

      Copy Rankings Latest Signals Become a signal provider AI Rating
      Contests
      Brokers

      Overview Brokers Assessment Rankings Regulators News Claims
      Broker listing Forex Brokers Comparison Tool Live Spread Comparison Scam
      Q&A Complaint Scam Alert Videos Tips to Detect Scam
      More

      Business
      Events
      Careers About Us Advertising Help Center

      White Label

      Broker API

      Data API

      Web Plug-ins

      Affiliate Program

      Awards Institution Evaluation IB Seminar Salon Event Exhibition
      Vietnam Thailand Singapore Dubai
      Fans Party Investment Sharing Session
      FastBull Summit BrokersView Expo
      Recent Searches
        Top Searches
          Markets
          Analysis
          User
          24/7
          Economic Calendar
          Education
          Data
          • Names
          • Latest
          • Prev

          View All

          No data

          Scan to Download

          Faster Charts, Chat Faster!

          Download App
          English
          • English
          • Español
          • العربية
          • Bahasa Indonesia
          • Bahasa Melayu
          • Tiếng Việt
          • ภาษาไทย
          • Français
          • Italiano
          • Türkçe
          • Русский язык
          • 简中
          • 繁中
          Open Account
          Search
          Products
          Charts Free Forever
          Markets
          News
          Signals

          Copy Rankings Latest Signals Become a signal provider AI Rating
          Contests
          Brokers

          Overview Brokers Assessment Rankings Regulators News Claims
          Broker listing Forex Brokers Comparison Tool Live Spread Comparison Scam
          Q&A Complaint Scam Alert Videos Tips to Detect Scam
          More

          Business
          Events
          Careers About Us Advertising Help Center

          White Label

          Broker API

          Data API

          Web Plug-ins

          Affiliate Program

          Awards Institution Evaluation IB Seminar Salon Event Exhibition
          Vietnam Thailand Singapore Dubai
          Fans Party Investment Sharing Session
          FastBull Summit BrokersView Expo

          Microsoft (MSFT) Shares Post A Record Decline

          FXOpen

          Stocks

          Summary:

          On Wednesday, after the close of the regular trading session, Microsoft (MSFT) released its quarterly earnings report, which exceeded analysts' expectations.

          On Wednesday, after the close of the regular trading session, Microsoft (MSFT) released its quarterly earnings report, which exceeded analysts' expectations:

          → Earnings per share: actual $4.14, forecast $3.90;
          → Gross revenue: actual $81.2bn, forecast $80.3bn;
          → Operating profit: up 21%.

          Despite the strong results, MSFT shares suffered a dramatic sell-off of around 10% by the close of yesterday's trading. According to media reports, this was the largest one-day drop in Microsoft's share price on record, with the company losing roughly $360bn in market capitalisation.

          Why MSFT Shares Collapsed

          Market participants were most likely disappointed by the following factors:

          → A sharp rise in capital expenditure: capex surged by 66% to $37.5bn as Microsoft continued to invest heavily in data centres and AI infrastructure, while the timing of meaningful returns on these investments remains uncertain.

          → Slowing growth in the cloud computing segment.

          Technical Analysis of Microsoft (MSFT) Shares

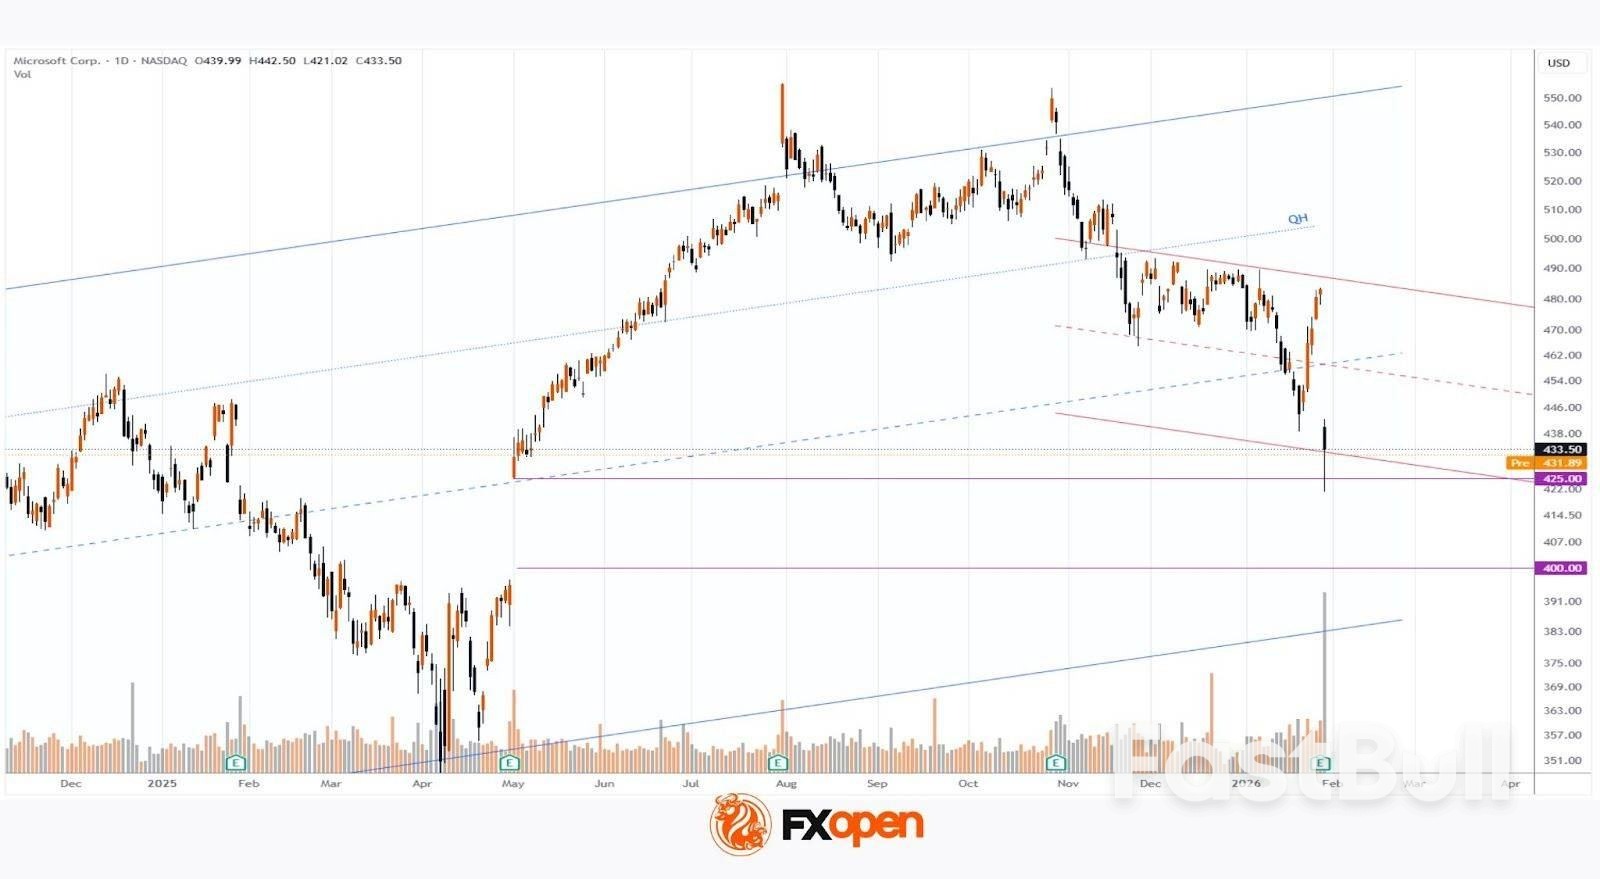
          When analysing the MSFT chart on 15 January, we identified a key ascending channel reflecting the stock's long-term price structure. At that time, we suggested that the market might find a temporary balance ahead of the earnings release.

          Since then, although volatility persisted, the price showed an ability to recover from 22 January onwards, indicating that buyers were attempting to wrest control from sellers.

          Yesterday's record decline significantly altered the picture, but two factors are worth noting:

          1 → The price fell below the 1 May low, entering the area of a broad bullish gap located above the psychological $400 level.
          2 → In 2026, the market has been forming a descending channel (shown in red), with the price now reaching its lower boundary.

          It is reasonable to assume that these two factors could act as support. The structure of yesterday's candle supports this view: the session closed well above the low, and trading volumes were the highest in several years. This suggests active buying interest, with the price rebounding from around $422 to $433.

          As a result, it is possible that the initial emotional reaction may fade and MSFT shares will avoid a further acceleration of the downtrend. However, a meaningful shift back to a bullish market structure would require strong fundamental catalysts.

          Source: FXOpen

          Risk Warnings and Disclaimers
          You understand and acknowledge that there is a high degree of risk involved in trading. Following any strategies or investment methods may lead to potential losses. The content on the site is provided by our contributors and analysts for information purposes only. You are solely responsible for determining whether any trading assets, securities, strategy, or any other product is suitable for investing based on your own investment objectives and financial situation.
          Add to Favorites
          Share
          FastBull
          Copyright © 2026 FastBull Ltd

          728 RM B 7/F GEE LOK IND BLDG NO 34 HUNG TO RD KWUN TONG KLN HONG KONG

          TelegramInstagramTwitterfacebooklinkedin
          App Store Google Play Google Play
          Products
          Charts

          Chats

          Q&A with Experts
          Screeners
          Economic Calendar
          Data
          Tools
          Membership
          Features
          Function
          Markets
          Copy Trading
          Latest Signals
          Contests
          24/7
          Analysis
          Education
          Company
          Careers
          About Us
          Contact Us
          Advertising
          Help Center
          Feedback
          User Agreement
          Privacy Policy
          Personal Information Protection Statement
          Business

          White Label

          Broker API

          Data API

          Web Plug-ins

          Poster Maker

          Affiliate Program

          Risk Disclosure

          The risk of loss in trading financial instruments such as stocks, FX, commodities, futures, bonds, ETFs and crypto can be substantial. You may sustain a total loss of the funds that you deposit with your broker. Therefore, you should carefully consider whether such trading is suitable for you in light of your circumstances and financial resources.

          No decision to invest should be made without thoroughly conducting due diligence by yourself or consulting with your financial advisors. Our web content might not suit you since we don't know your financial conditions and investment needs. Our financial information might have latency or contain inaccuracy, so you should be fully responsible for any of your trading and investment decisions. The company will not be responsible for your capital loss.

          Without getting permission from the website, you are not allowed to copy the website's graphics, texts, or trademarks. Intellectual property rights in the content or data incorporated into this website belong to its providers and exchange merchants.

          Not Logged In

          Log in to access more features

          Connect Broker
          Become a signal provider
          Help Center
          Customer Service
          Dark Mode
          Price Up/Down Colors

          Log In

          Sign Up

          Position
          Layout
          Fullscreen
          Default to Chart
          The chart page opens by default when you visit fastbull.com