• Trade
  • Markets
  • Copy
  • Contests
  • News
  • 24/7
  • Calendar
  • Q&A
  • Chats
Trending
Screeners
SYMBOL
LAST
BID
ASK
HIGH
LOW
NET CHG.
%CHG.
SPREAD
SPX
S&P 500 Index
6827.42
6827.42
6827.42
6899.86
6801.80
-73.58
-1.07%
--
DJI
Dow Jones Industrial Average
48458.04
48458.04
48458.04
48886.86
48334.10
-245.98
-0.51%
--
IXIC
NASDAQ Composite Index
23195.16
23195.16
23195.16
23554.89
23094.51
-398.69
-1.69%
--
USDX
US Dollar Index
97.950
98.030
97.950
98.500
97.950
-0.370
-0.38%
--
EURUSD
Euro / US Dollar
1.17394
1.17409
1.17394
1.17496
1.17192
+0.00011
+ 0.01%
--
GBPUSD
Pound Sterling / US Dollar
1.33707
1.33732
1.33707
1.33997
1.33419
-0.00148
-0.11%
--
XAUUSD
Gold / US Dollar
4299.39
4299.39
4299.39
4353.41
4257.10
+20.10
+ 0.47%
--
WTI
Light Sweet Crude Oil
57.233
57.485
57.233
58.011
56.969
-0.408
-0.71%
--

Community Accounts

Signal Accounts
--
Profit Accounts
--
Loss Accounts
--
View More

Become a signal provider

Sell trading signals to earn additional income

View More

Guide to Copy Trading

Get started with ease and confidence

View More

Signal Accounts for Members

All Signal Accounts

Best Return
  • Best Return
  • Best P/L
  • Best MDD
Past 1W
  • Past 1W
  • Past 1M
  • Past 1Y

All Contests

  • All
  • Trump Updates
  • Recommend
  • Stocks
  • Cryptocurrencies
  • Central Banks
  • Featured News
Top News Only
Share

Ukraine Says It Received 114 Prisoners From Belarus

Share

USA Embassy In Lithuania: Maria Kalesnikava Is Not Going To Vilnius

Share

USA Embassy In Lithuania: Other Prisoners Are Being Sent From Belarus To Ukraine

Share

Ukraine President Zelenskiy: Five Ukrainians Released By Belarus In US-Brokered Deal

Share

USA Vilnius Embassy: USA Stands Ready For "Additional Engagement With Belarus That Advances USA Interests"

Share

USA Vilnius Embassy: Belarus, USA, Other Citizens Among The Prisoners Released Into Lithuania

Share

USA Vilnius Embassy: USA Will Continue Diplomatic Efforts To Free The Remaining Political Prisoners In Belarus

Share

USA Vilnius Embassy: Belarus Releases 123 Prisoners Following Meeting Of President Trump's Envoy Coale And Belarus President Lukashenko

Share

USA Vilnius Embassy: Masatoshi Nakanishi, Aliaksandr Syrytsa Are Among The Prisoners Released By Belarus

Share

USA Vilnius Embassy: Maria Kalesnikava And Viktor Babaryka Are Among The Prisoners Released By Belarus

Share

USA Vilnius Embassy: Nobel Peace Prize Laureate Ales Bialiatski Is Among The Prisoners Released By Belarus

Share

Belarusian Presidential Administration Telegram Channel: Lukashenko Has Pardoned 123 Prisoners As Part Of Deal With US

Share

Two Local Syrian Officials: Joint US-Syrian Military Patrol In Central Syria Came Under Fire From Unknown Assailants

Share

Israeli Military Says It Targeted 'Key Hamas Terrorist' In Gaza City

Share

Rwanda's Actions In Eastern Drc Are A Clear Violation Of Washington Accords Signed By President Trump - Secretary Of State Rubio

Share

Israeli Military Issues Evacuation Warning In Southern Lebanon Village Ahead Of Strike - Spokesperson On X

Share

Belarusian State Media Cites US Envoy Coale As Saying He Discussed Ukraine And Venezuela With Lukashenko

Share

Belarusian State Media Cites US Envoy Coale As Saying That US Removes Sanctions On Belarusian Potassium

Share

Thai Prime Minister: No Ceasefire Agreement With Cambodia

Share

US, Ukraine To Discuss Ceasefire In Berlin Ahead Of European Summit

TIME
ACT
FCST
PREV
U.K. Trade Balance Non-EU (SA) (Oct)

A:--

F: --

P: --

U.K. Trade Balance (Oct)

A:--

F: --

P: --

U.K. Services Index MoM

A:--

F: --

P: --

U.K. Construction Output MoM (SA) (Oct)

A:--

F: --

P: --

U.K. Industrial Output YoY (Oct)

A:--

F: --

P: --

U.K. Trade Balance (SA) (Oct)

A:--

F: --

P: --

U.K. Trade Balance EU (SA) (Oct)

A:--

F: --

P: --

U.K. Manufacturing Output YoY (Oct)

A:--

F: --

P: --

U.K. GDP MoM (Oct)

A:--

F: --

P: --

U.K. GDP YoY (SA) (Oct)

A:--

F: --

P: --

U.K. Industrial Output MoM (Oct)

A:--

F: --

P: --

U.K. Construction Output YoY (Oct)

A:--

F: --

P: --

France HICP Final MoM (Nov)

A:--

F: --

P: --

China, Mainland Outstanding Loans Growth YoY (Nov)

A:--

F: --

P: --

China, Mainland M2 Money Supply YoY (Nov)

A:--

F: --

P: --

China, Mainland M0 Money Supply YoY (Nov)

A:--

F: --

P: --

China, Mainland M1 Money Supply YoY (Nov)

A:--

F: --

P: --

India CPI YoY (Nov)

A:--

F: --

P: --

India Deposit Gowth YoY

A:--

F: --

P: --

Brazil Services Growth YoY (Oct)

A:--

F: --

P: --

Mexico Industrial Output YoY (Oct)

A:--

F: --

P: --

Russia Trade Balance (Oct)

A:--

F: --

P: --

Philadelphia Fed President Henry Paulson delivers a speech
Canada Building Permits MoM (SA) (Oct)

A:--

F: --

P: --

Canada Wholesale Sales YoY (Oct)

A:--

F: --

P: --

Canada Wholesale Inventory MoM (Oct)

A:--

F: --

P: --

Canada Wholesale Inventory YoY (Oct)

A:--

F: --

P: --

Canada Wholesale Sales MoM (SA) (Oct)

A:--

F: --

P: --

Germany Current Account (Not SA) (Oct)

A:--

F: --

P: --

U.S. Weekly Total Rig Count

A:--

F: --

P: --

U.S. Weekly Total Oil Rig Count

A:--

F: --

P: --

Japan Tankan Large Non-Manufacturing Diffusion Index (Q4)

--

F: --

P: --

Japan Tankan Small Manufacturing Outlook Index (Q4)

--

F: --

P: --

Japan Tankan Large Non-Manufacturing Outlook Index (Q4)

--

F: --

P: --

Japan Tankan Large Manufacturing Outlook Index (Q4)

--

F: --

P: --

Japan Tankan Small Manufacturing Diffusion Index (Q4)

--

F: --

P: --

Japan Tankan Large Manufacturing Diffusion Index (Q4)

--

F: --

P: --

Japan Tankan Large-Enterprise Capital Expenditure YoY (Q4)

--

F: --

P: --

U.K. Rightmove House Price Index YoY (Dec)

--

F: --

P: --

China, Mainland Industrial Output YoY (YTD) (Nov)

--

F: --

P: --

China, Mainland Urban Area Unemployment Rate (Nov)

--

F: --

P: --

Saudi Arabia CPI YoY (Nov)

--

F: --

P: --

Euro Zone Industrial Output YoY (Oct)

--

F: --

P: --

Euro Zone Industrial Output MoM (Oct)

--

F: --

P: --

Canada Existing Home Sales MoM (Nov)

--

F: --

P: --

Euro Zone Total Reserve Assets (Nov)

--

F: --

P: --

U.K. Inflation Rate Expectations

--

F: --

P: --

Canada National Economic Confidence Index

--

F: --

P: --

Canada New Housing Starts (Nov)

--

F: --

P: --

U.S. NY Fed Manufacturing Employment Index (Dec)

--

F: --

P: --

U.S. NY Fed Manufacturing Index (Dec)

--

F: --

P: --

Canada Core CPI YoY (Nov)

--

F: --

P: --

Canada Manufacturing Unfilled Orders MoM (Oct)

--

F: --

P: --

Canada Manufacturing New Orders MoM (Oct)

--

F: --

P: --

Canada Core CPI MoM (Nov)

--

F: --

P: --

Canada Manufacturing Inventory MoM (Oct)

--

F: --

P: --

Canada CPI YoY (Nov)

--

F: --

P: --

Canada CPI MoM (Nov)

--

F: --

P: --

Canada CPI YoY (SA) (Nov)

--

F: --

P: --

Canada Core CPI MoM (SA) (Nov)

--

F: --

P: --

Q&A with Experts
    • All
    • Chatrooms
    • Groups
    • Friends
    Connecting
    .
    .
    .
    Type here...
    Add Symbol or Code

      No matching data

      All
      Trump Updates
      Recommend
      Stocks
      Cryptocurrencies
      Central Banks
      Featured News
      • All
      • Russia-Ukraine Conflict
      • Middle East Flashpoint
      • All
      • Russia-Ukraine Conflict
      • Middle East Flashpoint
      Search
      Products

      Charts Free Forever

      Chats Q&A with Experts
      Screeners Economic Calendar Data Tools
      Membership Features
      Data Warehouse Market Trends Institutional Data Policy Rates Macro

      Market Trends

      Market Sentiment Order Book Forex Correlations

      Top Indicators

      Charts Free Forever
      Markets

      News

      News Analysis 24/7 Columns Education
      From Institutions From Analysts
      Topics Columnists

      Latest Views

      Latest Views

      Trending Topics

      Top Columnists

      Latest Update

      Signals

      Copy Rankings Latest Signals Become a signal provider AI Rating
      Contests
      Brokers

      Overview Brokers Assessment Rankings Regulators News Claims
      Broker listing Forex Brokers Comparison Tool Live Spread Comparison Scam
      Q&A Complaint Scam Alert Videos Tips to Detect Scam
      More

      Business
      Events
      Careers About Us Advertising Help Center

      White Label

      Data API

      Web Plug-ins

      Affiliate Program

      Awards Institution Evaluation IB Seminar Salon Event Exhibition
      Vietnam Thailand Singapore Dubai
      Fans Party Investment Sharing Session
      FastBull Summit BrokersView Expo
      Recent Searches
        Top Searches
          Markets
          News
          Analysis
          User
          24/7
          Economic Calendar
          Education
          Data
          • Names
          • Latest
          • Prev

          View All

          No data

          Scan to Download

          Faster Charts, Chat Faster!

          Download App
          English
          • English
          • Español
          • العربية
          • Bahasa Indonesia
          • Bahasa Melayu
          • Tiếng Việt
          • ภาษาไทย
          • Français
          • Italiano
          • Türkçe
          • Русский язык
          • 简中
          • 繁中
          Open Account
          Search
          Products
          Charts Free Forever
          Markets
          News
          Signals

          Copy Rankings Latest Signals Become a signal provider AI Rating
          Contests
          Brokers

          Overview Brokers Assessment Rankings Regulators News Claims
          Broker listing Forex Brokers Comparison Tool Live Spread Comparison Scam
          Q&A Complaint Scam Alert Videos Tips to Detect Scam
          More

          Business
          Events
          Careers About Us Advertising Help Center

          White Label

          Data API

          Web Plug-ins

          Affiliate Program

          Awards Institution Evaluation IB Seminar Salon Event Exhibition
          Vietnam Thailand Singapore Dubai
          Fans Party Investment Sharing Session
          FastBull Summit BrokersView Expo

          McDonald's posts biggest US sales drop since Covid

          Adam

          Economic

          Summary:

          McDonald's reported a 3.6% drop in US sales—the worst since mid-2020—amid economic uncertainty, price backlash, and early Trump-era tariff disruptions, dragging global revenue despite gains abroad.

          McDonald's has suffered its biggest drop in US sales since the height of Covid, a fall that it said was driven by wider concerns about the US economy.
          The world's largest burger chain's revenue at US stores open at least a year sank 3.6% in the first three months of 2025 compared with the same period in 2024, as customers reduced their visits.
          It marked the steepest decline in like-for-like sales in the US since the three months to the end of June 2020 when many pandemic restrictions were still in place.
          Chief executive Chris Kempczinski said customers were "grappling with uncertainty" but assured investors that the firm could "navigate even the toughest of market conditions".
          McDonald's has been working for months to try to re-ignite its business, after facing backlash from customers, especially lower income households, over rising prices.
          The firm's latest drop in sales coincided with a contraction in the US economy, which shrank at an annual rate of 0.3% in the first three months of 2025.
          It marked the first quarterly decline since 2022.
          The figures reflected just over two months of Donald Trump's presidency - as many firms and consumers reacted with confusion to his barrage of tariff announcements - but not his "Liberation Day" tariff plans on 2 April
          Over the same three-month period, the slump in McDonald's US sales dragged its overall like-for-like revenue down 1% even as sales in Japan, Australia, and the Middle East grew.
          Mr Kempczinski said: "Consumers today are grappling with uncertainty, but they can always count on McDonald's [...] for exceptional value".
          "McDonald's has a 70-year legacy of innovation, leadership, and proven agility, all of which give us confidence in our ability to navigate even the toughest of market conditions and gain market share," he added.

          Higher prices

          Businesses have had a mix of reactions since Trump began revealing and enforcing his plans for tariffs, which are a tax payable by a person or firm buying a good from overseas.
          This week, technology giant Intel said costs would rise and a recession was more likely because of Trump's tariffs.
          Sportswear brand Adidas said they would lead to higher prices in the US for popular trainers including the Gazelle and Samba.
          Meanwhile, delivery giant DHL paused deliveries worth more than $800 (£603) due to US trade policy before lifting them after negotiating "adjustments" to customs rues.
          Trump and his allies have said the policies will help to bring more jobs to the US as firms base factories and operations the country to avoid the new taxes.
          However, many companies and economists have said this will be difficult to achieve and will likely mean job losses and economic pain at least in the short term.
          Reacting to yesterday's economic figures, Trump said he needed "a little bit of time" - calling the numbers a reflection of the "Biden economy", a reference to the former president.

          source :bbc

          To stay updated on all economic events of today, please check out our Economic calendar
          Risk Warnings and Disclaimers
          You understand and acknowledge that there is a high degree of risk involved in trading. Following any strategies or investment methods may lead to potential losses. The content on the site is provided by our contributors and analysts for information purposes only. You are solely responsible for determining whether any trading assets, securities, strategy, or any other product is suitable for investing based on your own investment objectives and financial situation.
          Add to Favorites
          Share

          Profit-taking Pounds Gold Prices As U.S. Jobs Report On Deck

          Devin

          Commodity

          Economic

          Profit taking and weak long liquidation from the shorter-term futures traders are featured. Silver prices are moderately down. A steep drop in crude oil prices this week is a bearish weight on gold and silver, as is a sharply higher U.S. dollar index today. June gold was last down $96.30 at $3,222.50. May silver prices were last down $0.366 at $32.165.

          The next big U.S. data point is Friday morning’s U.S. jobs report for April from the Labor Department. That report may be the most important U.S. data point so far this year. The key non-farm payrolls number is seen coming in at up 133,000 versus a gain of 228,000 in the March report.

          Many Asian and European stock markets were closed Thursday for the May Day holiday. U.S. stock indexes are solidly higher at midday. Risk appetite is keener late this week, following some better-than-expected U.S. corporate earnings reports that were released the past couple days. Also, the Trump administration is hinting that new trade deals with other countries are close at hand. Chinese media is reporting the U.S. has reached out to China to discuss trade.

          The key outside markets today and see the U.S. dollar index sharply higher. Nymex crude oil futures prices are near steady and trading around $58.25 a barrel. The yield on the benchmark 10-year U.S. Treasury note is presently around 4.3%.

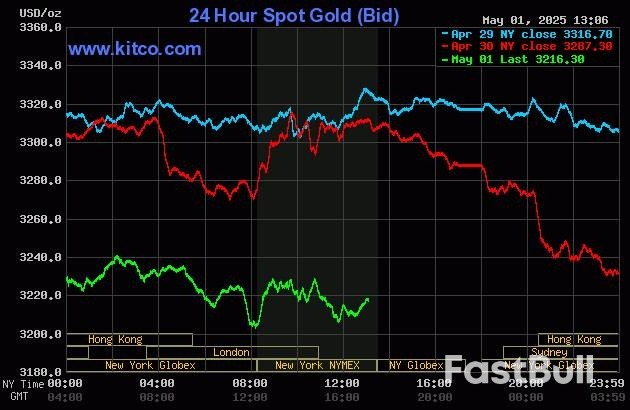
          Technically, June gold futures bulls have the overall near-term technical advantage but are fading. Bulls’ next upside price objective is to produce a close above solid resistance at $3,350.00. Bears' next near-term downside price objective is pushing futures prices below solid technical support at $3,100.00. First resistance is seen at $3,250.00 and then at $3,300.00. First support is seen at $3,200.00 and then at $3,175.00. Wyckoff's Market Rating: 6.5.

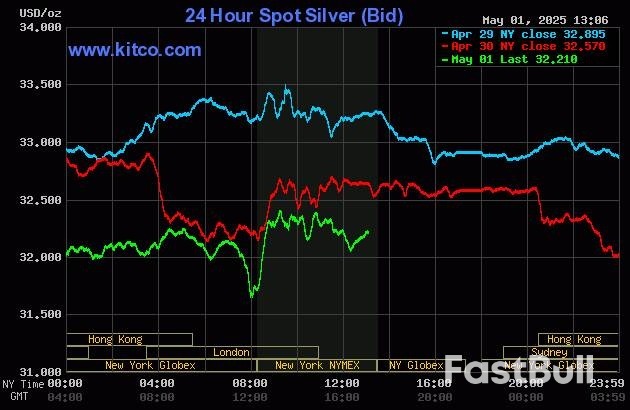
          May silver futures bulls have the slight overall near-term technical advantage but are fading. A price uptrend on the daily bar chart has been negated. Silver bulls' next upside price objective is closing prices above solid technical resistance at this week’s high of $33.69. The next downside price objective for the bears is closing prices below solid support at $30.00. First resistance is seen at $32.00 and then at the overnight high of $32.555. Next support is seen at $31.50 and then at $31.00. Wyckoff's Market Rating: 5.5.

          (Hey! My “Markets Front Burner” weekly email report is my best writing and analysis, I think, because I get to look ahead at the marketplace and do some market price forecasting. Plus, I’ll throw in an educational feature to move you up the ladder of trading/investing success. And it’s free! Sign up here; it’s real easy. https://www.kitco.com/services

          Source: Kitco

          To stay updated on all economic events of today, please check out our Economic calendar
          Risk Warnings and Disclaimers
          You understand and acknowledge that there is a high degree of risk involved in trading. Following any strategies or investment methods may lead to potential losses. The content on the site is provided by our contributors and analysts for information purposes only. You are solely responsible for determining whether any trading assets, securities, strategy, or any other product is suitable for investing based on your own investment objectives and financial situation.
          Add to Favorites
          Share

          Oil price fall: what's behind the four-year low in crude markets?

          Adam

          Commodity

          Recent oil price movements and key triggers

          Oil prices have experienced a significant decline over the past month, with Brent crude oil dropping to approximately $60.00 per barrel, a four-year low. This downturn is attributed to a combination of factors, including increased supply, weakening demand, and strategic decisions by major oil producers such as Saudi Arabia.
          The decline represents a stark contrast to the market's performance earlier this year when prices were hovering closer to the $75.00 mark. This dramatic shift has caught many traders off-guard, particularly those who had positioned themselves for potential supply disruptions due to ongoing conflicts in the Middle East.
          The speed of the decline has been particularly noteworthy, with Brent crude shedding more than 20% in just over four weeks. This rapid deterioration has triggered technical selling, compounding the downward pressure on prices.
          Market volatility has increased significantly, with daily price swings of 2-3% becoming common. This environment has created both challenges and opportunities for oil traders, depending on their positioning and risk management strategies.

          OPEC+ dynamics and Saudi Arabia's strategic shift

          Saudi Arabia, traditionally a proponent of production cuts to stabilise prices, has shifted its stance. Frustrated by OPEC+ members like Kazakhstan and Iraq exceeding production quotas, Riyadh has signalled a willingness to tolerate lower oil prices and has even pushed for an unexpected output hike in May. This move has contributed to the oversupply in the market, exerting downward pressure on prices.
          Saudi Arabian officials have been informing allies and industry experts that the kingdom is no longer willing to support the oil market through additional supply cuts and is prepared to endure a prolonged period of low prices, according to five sources familiar with the discussions. This potential policy shift suggests that Saudi Arabia may increase production to expand its market share, marking a significant change after five years of leading the OPEC+ group in deep output cuts to balance the market.
          This strategic pivot indicates a departure from Saudi Arabia's previous approach of defending high oil prices. By signalling a tolerance for lower prices, the kingdom appears to be prioritising market share expansion over price stabilisation. This move could have far-reaching implications for global oil markets, potentially leading to increased competition among producers and influencing future OPEC+ policy decisions.
          The timing of this shift is particularly notable as it coincides with increasing production from non-OPEC sources, including record-high output from the United States and growing production from Guyana and Brazil.

          Global economic concerns weighing on demand

          Economic indicators suggest a slowdown in global demand for oil. The US economy contracted by 0.3% in the first quarter of 2025, raising fears of a potential recession. This contraction was driven primarily by a surge in imports ahead of newly implemented tariffs, which also contributed to a record-high trade deficit. Additionally, concerns about China's economic growth have further dampened demand expectations.
          China's economic performance has been particularly disappointing, with industrial production growing at its slowest pace in six months and property sector woes continuing to drag on overall economic activity. As the world's largest oil importer, any slowdown in Chinese demand has outsized effects on global oil markets.
          European economies aren't faring much better, with the eurozone struggling to gain momentum after narrowly avoiding recession last year. High interest rates continue to weigh on business activity, while consumer spending remains subdued despite moderating inflation.
          These demand concerns have coincided with the seasonal transition from winter to spring, a period when refinery maintenance typically reduces crude oil demand. This seasonal factor has exacerbated the downward pressure on prices at a time when the market was already vulnerable.

          Saudi Arabia's financial resilience and strategic calculations

          Saudi officials have indicated that the kingdom can sustain a prolonged period of low oil prices. This strategy may be aimed at regaining market share from non-OPEC producers like the US and Guyana or disciplining non-compliant OPEC+ members. The kingdom is prepared to weather the downturn through increased borrowing and spending cuts, potentially delaying major projects.
          The kingdom's finances are in a stronger position than during previous oil price downturns, with substantial foreign reserves of approximately $415 billion. This financial buffer provides Saudi Arabia with the flexibility to withstand lower oil revenues for an extended period.
          Crown Prince Mohammed bin Salman's ambitious Vision 2030 programme, which aims to diversify the Saudi economy away from oil dependence, may face challenges if oil prices remain depressed. However, Saudi officials have indicated that core components of the programme will proceed regardless of oil price fluctuations.
          The strategic calculations behind Saudi Arabia's apparent willingness to accept lower prices likely also include geopolitical considerations, particularly regarding its relationship with Russia within the OPEC+ framework and its complex ties with the United States.

          Market structure and futures trading dynamics

          The oil market is experiencing unusual dynamics, characterised by a peculiar futures curve known as "contango," where future prices are higher than current prices. This typically signals bearish sentiment and encourages stockpiling. Despite recent bearish indicators - including increased oil production by OPEC+ and trade tensions between the US and China impacting demand - the futures curve's complex shape suggests a more nuanced outlook.
          This contango structure creates incentives for traders to buy and store physical oil, potentially leading to increased inventories. Reports already indicate that floating storage - oil stored on tankers - has begun to increase as traders take advantage of the price differential between current and future months.
          The commodity options market is also signalling increased bearish sentiment, with put options (which profit from price declines) seeing increased demand. The put-call skew has shifted notably toward puts in recent weeks, indicating that traders are paying a premium for downside protection.
          Speculative positioning in the futures market has turned increasingly bearish, with hedge funds and other money managers reducing their net long positions to the lowest level in more than a year. This positioning could exacerbate price movements in either direction, depending on how market fundamentals evolve.

          Implications for major economies and oil companies

          The drop in oil prices presents a mixed picture for major economies. For oil-importing nations, lower prices act as a tax cut for consumers and businesses, potentially stimulating economic activity. However, for oil-exporting countries, the revenue shortfall can strain government budgets and economic stability.
          The United States, as both a major producer and consumer of oil, faces complex implications. Lower prices benefit consumers through reduced fuel costs but put pressure on the domestic shale industry, which generally requires higher oil prices to remain profitable. Any significant curtailment of US production could eventually help rebalance the market.
          Major oil companies are likely to reassess their capital expenditure plans if prices remain depressed. We've already seen announcements from several companies indicating they will prioritise cost control and focus on the most profitable projects in their portfolios.
          Renewable energy initiatives might face headwinds as lower oil prices reduce the economic incentive to transition away from fossil fuels. However, most governments and major corporations have made long-term commitments to decarbonisation that transcend short-term oil price fluctuations.

          Technical analysis of the oil price

          WTI light crude oil is trading in four-year lows, having fallen through its 2021-to-2025 $65.25-to-$61.76 key support zone in April.
          The June-to-October 2019 lows at $51.03-to-$50.63 represent possible downside targets, together with the psychological $50.00 mark and the 61.8% Fibonacci retracement of the 2020-to-2022 bull market at $49.52.
          WTI crude oil monthly chart
          Oil price fall: what's behind the four-year low in crude markets?_1
          Because of inverse polarity the previous $65.25-to-$61.76 major support zone should now act as a resistance area.
          The Brent crude oil price, down over 25% from its early January high at $81.73 per barrel, and down 20% in the past month alone, continues to slide and is fast approaching its April low at $58.17. Failure there may well lead to the $55.00-to-$53.00 region being hit.
          Brent crude oil daily chart
          Oil price fall: what's behind the four-year low in crude markets?_2
          Strong resistance sits between the September 2024 and March 2025 lows and the late April high at $67.39-to-$68.46. While this resistance area caps, the downtrend remains entrenched.

          How to trade falling oil prices

          For traders and investors, the current oil market presents both risks and opportunities across various time horizons. Here's how you can navigate this volatile environment:
          Research the oil market thoroughly, including supply-demand dynamics, technical indicators, and geopolitical factors that could impact prices.
          Choose whether you want to trade or invest based on your outlook for oil prices and your preferred time horizon.
          Open an account with IG by visiting our website and completing the application process.
          Search for oil markets like 'Brent Crude' or 'WTI' on our trading platform or app.
          Place your trade, ensuring you have appropriate risk management measures in place, especially important in the current volatile environment.
          Spread betting and CFD trading offer ways to potentially profit from both rising and falling oil prices, allowing flexible positioning as market conditions evolve. These products enable traders to take advantage of oil's volatility without needing to take physical delivery.
          For those with a longer-term outlook, ETFs tracking oil prices or energy sector equities provide exposure to the broader energy market trends. The diversification offered by these instruments can help mitigate some of the risks associated with individual oil company stocks.
          The current decline in oil prices reflects a complex interplay of supply-side decisions, demand-side concerns, and strategic manoeuvres by key players like Saudi Arabia. While the short-term outlook remains bearish, market dynamics could shift rapidly in response to geopolitical developments, economic indicators, and policy decisions by major oil-producing nations.

          Source: ig

          Risk Warnings and Disclaimers
          You understand and acknowledge that there is a high degree of risk involved in trading. Following any strategies or investment methods may lead to potential losses. The content on the site is provided by our contributors and analysts for information purposes only. You are solely responsible for determining whether any trading assets, securities, strategy, or any other product is suitable for investing based on your own investment objectives and financial situation.
          Add to Favorites
          Share

          Bond Market Thinks Fed Should Cut Rates, Treasury's Bessent Says

          Catherine Richards

          Economic

          Central Bank

          Bond

          The bond market is sending a signal that the Federal Reserve should be cutting interest rates, U.S. Treasury Secretary Scott Bessent said on Thursday, noting that yields on 2-year Treasury notes were lower than central bank's policy rate.
          "We are seeing that two-year rates are now below fed funds rates, so that's a market signal that they think the Fed should be cutting," Bessent said in an interview on Fox Business Network's "Mornings with Maria" program.The 2-year note yield on Thursday was about 3.57%, down about 5 basis points on the day and about three-quarters of a percentage point below the daily effective federal funds rate of 4.33%. The Fed's policy rate is set in a range of 4.25% to 4.50%, where it has been since December after it cut rates by a percentage point late last year.
          Fed officials have been in a wait-and-see posture since as they assess the effects of President Donald Trump's new policies, particularly on how the sweeping tariffs on imported goods he has imposed will affect inflation, demand and the job market.
          The spread between the Fed's rate and 2-year yields, a bond market proxy for expectations for where monetary policy is headed, has widened persistently over the last two months. That has come as fixed-income investors in both Treasuries and interest-rate futures have pivoted to bets the Fed will cut rates by a full percentage point this year - double the most recent median estimate among Fed policymakers themselves - as the economy weakens in the face of Trump's tariffs onslaught.
          Indeed, the Commerce Department on Wednesday reported that the economy contracted unexpectedly in the first three months of the year because of a historic rush of imports to beat the tariffs, and many private economists now see a heightened risk of outright recession later this year.
          Bessent, who as Treasury secretary typically meets weekly with Fed Chair Jerome Powell, said there had been a notable drop in yields on 10-year Treasury notes, and that is where he and the Trump administration are devoting more of their attention because that more directly influences borrowing costs for households and businesses.
          That rate, influential to high-profile borrowing costs such as residential mortgages, has dropped by about half a percentage point since the Friday before Trump's inauguration in January, although bond markets have been particularly volatile over the last month due to the president's erratic implementation of tariffs.
          The rate on 30-year fixed-rate mortgages was about 6.81% on average last week after climbing abruptly by about 20 basis points in mid-April on the heels of the bond market ructions.

          Source: Kitco

          To stay updated on all economic events of today, please check out our Economic calendar
          Risk Warnings and Disclaimers
          You understand and acknowledge that there is a high degree of risk involved in trading. Following any strategies or investment methods may lead to potential losses. The content on the site is provided by our contributors and analysts for information purposes only. You are solely responsible for determining whether any trading assets, securities, strategy, or any other product is suitable for investing based on your own investment objectives and financial situation.
          Add to Favorites
          Share

          Bitcoin Price Tops $96K for First Time Since February Correction

          Adam

          Cryptocurrency

          Bitcoin surged past $96,000 as May opened, reaching levels not seen since February's steep correction when President Donald Trump’s aggressive U.S. trade policies began to trigger declines.
          Bitcoin has rebounded 21% from its February low of $78,900 and 28% from early April's $75,000 bottom. The surge past the $96,000 price mark represents Bitcoin's strongest position since the price decline trend began the last week of February.
          "Bitcoin's recent price appreciation is the result of long-term momentum rather than a temporary phenomenon," Ryan Yoon, lead research analyst at Tiger Research, told Decrypt.
          He said Bitcoin is now "transitioning from a speculative asset to an essential component in institutional investor portfolios," Yoon noted.
          Key factors, according to Yoon, include "consistent purchasing" from BTC treasury companies such as Strategy. On Monday, the firm approached the limits of its equity program with another buy, after having bought $1.4 billion worth of Bitcoin the week before. And Japanese Bitcoin treasury company Metaplanet, which has amassed $481 million worth of Bitcoin, announced Wednesday that it's opening a U.S. subsidiary.
          These factors, "coupled with steady capital inflows through ETFs," show "sustained institutional interest," Yoon explained.
          Still, other industry observers maintain a cautiously optimistic forecast.
          "After bottoming at $75,000, BTC is in the process of decoupling from other risk assets and moving back to [an alternate] store of value," Andrew Lawrence, chief and co-founder of BTC meme coin DEX Funkybit, told Decrypt.
          "I expect significantly higher prices from here, given the uncertain global monetary outlook," Lawrence said.
          Still, there's expectation of "expanded liquidity," Tiger Research's Yoon noted. This, combined with "the psychological 'round number effect' of $100,000," has driven up market sentiment and fueled the ongoing recovery.
          At the time of writing, Bitcoin is changing hands at roughly $96,200, with volume ramping up $7 billion from the previous day's $23 billion.

          Source: decrypt.co

          Risk Warnings and Disclaimers
          You understand and acknowledge that there is a high degree of risk involved in trading. Following any strategies or investment methods may lead to potential losses. The content on the site is provided by our contributors and analysts for information purposes only. You are solely responsible for determining whether any trading assets, securities, strategy, or any other product is suitable for investing based on your own investment objectives and financial situation.
          Add to Favorites
          Share

          US job growth hasn’t been this slow since Covid. Trump’s policies could chill it further

          Adam

          China–U.S. Trade War

          Economic

          It all comes down to the job market.
          President Donald Trump’s drastic policy moves, and the twists and turns that have come alongside them, have made economic forecasting a squirrely endeavor.
          The sheer uncertainty of what’s to come has put markets on the fritz and sent soft data (like consumer sentiment surveys) sounding alarms. Now, the hard data (tried-and-true economic metrics that are lagged for good reason) is starting to reflect some of the disarray.
          A tumultuous tariff program and trade war have sent recession odds higher.
          “Let’s not fool ourselves, things are going to get worse later this year, probably later in the summer,” Robert Frick, corporate economist at Navy Federal Credit Union, told CNN in an interview. “But for now, we really need to cross our fingers and hope that incomes and jobs hold up, because those are the things that will insulate us.”
          The engine of the US economy is the American consumer, whose spending accounts for more than two-thirds of economic activity. And the lifeblood of consumer spending comes from one critical source: the US labor market.
          And as it stands now, and as it likely stood in April, that fuel source hasn’t run dry — but it very well could be starting to crack under the pressure.
          “The economy appears strong in the data … job growth is continuing, the unemployment rate is at a fine level; there are no warning signs there, but I think what the data doesn’t show is that the risks have increased,” Elizabeth Renter, senior economist at NerdWallet, told CNN in an interview this week. “There’s a whole lot going on, and there are a lot more and greater risks to the labor market and to the broader economy now than there were, say, three months ago.”
          On Friday morning, the Bureau of Labor Statistics will release the jobs report for April, and it’s expected that the US economy added 135,000 jobs and that the unemployment rate stood pat at 4.2%, according to FactSet consensus economists estimates.

          Headwinds are growing stronger

          If April’s estimates hold true, they’d mark a significant retreat from March, where preliminary estimates showed a stronger-than-anticipated net gain of 228,000 jobs. Economists expect that prior 228,000 estimate to be revised down come Friday now that more complete information is available (after all, March’s report included a downward revision of 48,000 jobs to January and February combined).
          Through March, employment growth has averaged 152,000 jobs per month. That’s the slowest first-quarter growth since 2020 (when a massive 14 million jobs were lost that March) and, before the pandemic, since 2011, BLS data shows.
          “The headwinds that we were looking at before the March report are still there and almost certainly stronger now,” Dean Baker, senior economist and co-founder of the Center for Economic Policy Research, wrote in a note issued earlier this week.
          Tariffs were partly in place in March: It was the second month that initial tariffs on Chinese goods were in effect (20%); plus, the global 25% tariffs on steel and aluminum imports took effect March 12. Additionally, the Trump administration placed a hiring freeze on the federal workforce, slashed jobs across agencies and canceled massive amounts of grants and contracts.
          “This has not led to any substantial uptick in unemployment claims, but surveys of both businesses and consumers have turned sharply negative in the last two months,” Baker noted. “It is hard to believe that this has not had some impact on hiring.”
          Now businesses have to contend with plenty more unknowns.
          In April, the tariff headwinds grew stronger as Trump ramped up duties on Chinese imports to 145%; placed a 10% baseline tariff on all imported goods; applied a 25% tariff on cars; and imposed — then delayed — additional, and varying “reciprocal” duties on dozens of countries.
          Beyond tariffs, the federal spending cuts have continued, as have deportations and other anti-immigration actions.
          The latest labor turnover data released earlier this week showed that some employers are retrenching. In March, job openings sank to their lowest level since September, a time when pre-election uncertainty helped to dampen hiring plans.
          Some economists expect those “holding patterns” to become even more evident in the jobs data when it’s released Friday. Lydia Boussour, senior economist at EY-Parthenon, estimates that April’s job growth could be a paltry 65,000.
          “Since the March jobs report, timely indicators such as initial jobless claims have not suggested a material surge in layoffs, but job cut announcements released by Challenger, Gray & Christmas indicate that layoffs are creeping higher as employers grow increasingly cautious about the outlook,” she wrote in a note to clients. “Business surveys also point to deteriorating labor market trends.”
          The downside risks only grew in April, she added.
          “The payroll survey for the jobs report was conducted the week after the April 2 reciprocal tariff announcement, when uncertainty and volatility were extremely high, which could have weighted on hiring decisions,” she wrote. “Moreover, April is a month when seasonal factors are substantially negative, especially in services industries.”
          The seasonal adjustment calculations meant to counterbalance the spikes in springtime hiring could very well serve as a drag on Friday’s numbers if seasonal hiring this April was depressed due to uncertainty around tariffs, she added.

          The DOGE effect

          Though the ripple effects from tariffs and immigration-related activities could take longer to show up in the data, the federal workforce reductions already have started appearing. The sector posted job losses for two consecutive months, dropping 11,000 jobs in February and 4,000 jobs in March, BLS data shows.
          More losses are expected, but could be spread over many months to come: While nearly 300,000 job cuts have been announced, not all federal workers were laid off immediately, so the impact to the labor market and unemployment is going to be a slow drip.
          Job cuts by the government represented the largest chunk of layoffs so far this year, up 680% from the same period last year. Department of Government Efficiency-related cost-cutting led to a total of 281,452 layoffs, according to new data released Thursday by Challenger, Gray & Christmas.
          For the month of April, US-based employers announced plans to cut 105,441 jobs, according to the Challenger report. That’s significantly higher than the 64,789 job cuts announced last April. However, a large chunk (40,000 jobs) of last month’s layoff count can be attributed to plans tied to two major employers: UPS and Intel.
          Earlier this week, UPS said it plans to cut 20,000 jobs this year as part of a previously announced plan to increase automation and trim its Amazon business. Last week, Bloomberg reported that Intel was expected to cut 20,000 workers; however, the company has not announced specific details for potential upcoming layoffs.
          Cutting through the noise, there is a clear trend of economic uncertainty weighing on businesses, noted Andrew Challenger, senior vice president for the outplacement and business coaching firm.
          “Though the government cuts are front and center, we saw job cuts across sectors last month,” he said in a statement. “Generally, companies are citing the economy and new technology. Employers are slow to hire and limiting hiring plans as they wait and see what will happen with trade, supply chain, and consumer spending.”
          Weekly jobless claims, which are considered a proxy for layoffs, remain near pre-pandemic levels and below historic averages —despite surging uncertainty and rising numbers of layoff announcements. The initial claims data, although highly volatile and subject to revision, has risen in importance as a potential indicator for how Trump’s sweeping actions — including mass layoffs of federal government workers — are filtering through the economy.
          Last week, the number of first-time claims jumped to their highest level since late-February. There were 241,000 initial claims for unemployment insurance filed during the week ended April 26, according to Labor Department data released Thursday. That total is up 18,000 from the week before.
          Thursday’s report also showed that people continue to stay unemployed for longer: The number of continuing claims, which are filed by Americans who have received at least a week or more of jobless benefits, climbed by 83,000 to 1.916 million, the highest level since November 2021.

          Areas and metrics to watch in Friday’s report

          Health care, state and local government, leisure and hospitality: These three sectors have been the leading drivers of overall job growth in recent years. Health care should continue to lead in job gains; however, the pace is expected to slow.
          A downswing in state and local government hiring could be an indication of the negative ripple effects from federal spending reductions; at the same time, states and municipalities have sought out laid-off federal workers for empty roles.
          “State and local government is the place where you often have safety net measures in place; so if we do go into a recession, seeing how well they’re holding up in terms of employment is also useful,” said Elise Gould, senior economist at the Economic Policy Institute.
          In addition to the seasonal adjustment effects economist Boussour noted, slow job gains or losses in leisure and hospitality could also reflect a pullback in discretionary spending among rattled consumers.
          Hours worked: If the average workweek dips lower, that could be a warning signal of what could come, Gould told CNN.
          “Are people getting fewer hours? Are the shifts being reduced?” she said. “They’re not letting go workers, necessarily, but maybe they’re lowering [employees] hours of work.”
          Wage growth: The annual rate of average hourly earnings dipped to 3.8% in March from 4% in February. With more workers uncertain about their future job prospects and the overall economy, they’re staying put — and less job-hopping means wage gains could continue to soften at a time when tariffs could cause prices to rise.
          Wage gains have normalized after a post-pandemic spike; and while the stability is in line with what the Federal Reserve hopes to see (as inflation cools), the policy climate is far different — and far more unstable — than anticipated. New data released this week showed that US workers’ pay and benefits grew at their slowest pace in nearly four years during the first-quarter period when policy-related uncertainty started to weigh on hiring plans, according to new data released Wednesday.
          Unemployment for Black workers: “The Trump administration has made clear that it intends to reverse all efforts at encouraging the hiring of Black workers and other minorities — not just in the federal government but in the private sector as well,” CEPR’s Baker noted. “This will almost certainly dim their employment prospects.”
          In March, the employment to population ratio for Black workers dropped to 58.4%, the lowest since August 2022. Monthly data is highly volatile, especially for specific metrics such as this.
          Construction and manufacturing: Construction has been a steady source of job growth; however, a dampening of demand coupled with rising input costs could cause that growth to falter.
          The same could be true for manufacturers, who could feel the pinch from costlier goods imported from abroad, said Noah Yosif, chief economist at the American Staffing Agency.

          Source: cnn

          To stay updated on all economic events of today, please check out our Economic calendar
          Risk Warnings and Disclaimers
          You understand and acknowledge that there is a high degree of risk involved in trading. Following any strategies or investment methods may lead to potential losses. The content on the site is provided by our contributors and analysts for information purposes only. You are solely responsible for determining whether any trading assets, securities, strategy, or any other product is suitable for investing based on your own investment objectives and financial situation.
          Add to Favorites
          Share

          Dow rallies 200 points to kick off May as Microsoft, Meta rekindle AI trade: Live updates

          Adam

          Stocks

          Stocks rose on Thursday after strong quarterly results from two Big Tech players eased concerns that artificial intelligence progress would slow amid economic turmoil.
          The Dow Jones Industrial Average climbed 210 points, or 0.5%. The S&P 500 traded up about 1%, while the Nasdaq Composite increased nearly 2%.
          Investor fears that President Donald Trump’s tariffs and a downturn in the U.S. economy would threaten the AI trade were assuaged after Meta Platforms posted stronger-than-expected revenue in the first quarter, with Meta’s Chief Executive Mark Zuckerberg saying on an earnings call Wednesday that the business is “performing very well” and that it’s “well positioned to navigate the macroeconomic uncertainty.”
          Microsoft also reported top- and bottom-line beats in the fiscal third quarter as well as strong results from its Azure cloud business. On top of that, the company offered upbeat guidance, further alleviating some concerns about tech companies’ future performance. The company’s executives said during an earnings call Wednesday that they expect capital expenditures to gain from here as they continue to expand data center capacity, adding that “cloud and AI are the essential inputs for every business to expand output, reduce costs and accelerate growth.”
          Those results sent shares up 9%, while Meta shares advanced about 6%. Other names like AI chip darling Nvidia also moved higher by 4%, and information technology outpaced the rest of the S&P 500 sectors, seeing a 3% incline.
          “Few stocks are truly immune to Trump tariffs [and] trade war, but AI is a lot less impacted than investors currently believe,” said Jed Ellerbroek, portfolio manager at Argent Capital Management. “We’re early in a very steep growth curve right now, and that goes for AI infrastructure.”
          Denting Thursday’s bullishness somewhat was a jump in weekly jobless claims to 241,000, more than the the Dow Jones estimate of 225,000. That jump exacerbated further concerns about the economy after the weak first-quarter gross-domestic-product report earlier in the week and raises the stakes for April’s nonfarm payrolls reading on Friday.
          In the previous session on Wednesday, the S&P 500 and the 30-stock Dow posted gains in volatile trading, coming back from earlier losses. At the day’s lows, the broad market index was down more than 2%, while the blue-chip Dow lost more than 780 points.
          Traders were initially shaken by weak economic data from the Commerce Department, showing that GDP fell at an annualized pace of 0.3%. It marked the first quarter of negative growth since Q1 of 2022. Economists polled by Dow Jones had forecast a 0.4% gain. Investors looked past the dismal results and began buying back into the market late in the session, resulting in a rebound into positive territory for the Dow and S&P 500.
          Wednesday marked the final trading day in April, in which stocks were first whipsawed after President Donald Trump’s “reciprocal” tariff announcement on April 2 and the subsequent suspension of the highest levies. At one point, during the month, the S&P 500 briefly slipped into a bear market – falling more than 20% from its February record high – before recapturing some of its losses. The broad market index wound up ending Wednesday about 9% off its record close.
          Still, the comeback couldn’t save S&P 500 and the Dow from a losing April, as they slipped about 0.8% and 3.2%, respectively. The Nasdaq Composite, however, advanced 0.9% in the period.

          Source : cnbc

          Risk Warnings and Disclaimers
          You understand and acknowledge that there is a high degree of risk involved in trading. Following any strategies or investment methods may lead to potential losses. The content on the site is provided by our contributors and analysts for information purposes only. You are solely responsible for determining whether any trading assets, securities, strategy, or any other product is suitable for investing based on your own investment objectives and financial situation.
          Add to Favorites
          Share
          FastBull
          Copyright © 2025 FastBull Ltd

          728 RM B 7/F GEE LOK IND BLDG NO 34 HUNG TO RD KWUN TONG KLN HONG KONG

          TelegramInstagramTwitterfacebooklinkedin
          App Store Google Play Google Play
          Products
          Charts

          Chats

          Q&A with Experts
          Screeners
          Economic Calendar
          Data
          Tools
          Membership
          Features
          Function
          Markets
          Copy Trading
          Latest Signals
          Contests
          News
          Analysis
          24/7
          Columns
          Education
          Company
          Careers
          About Us
          Contact Us
          Advertising
          Help Center
          Feedback
          User Agreement
          Privacy Policy
          Business

          White Label

          Data API

          Web Plug-ins

          Poster Maker

          Affiliate Program

          Risk Disclosure

          The risk of loss in trading financial instruments such as stocks, FX, commodities, futures, bonds, ETFs and crypto can be substantial. You may sustain a total loss of the funds that you deposit with your broker. Therefore, you should carefully consider whether such trading is suitable for you in light of your circumstances and financial resources.

          No decision to invest should be made without thoroughly conducting due diligence by yourself or consulting with your financial advisors. Our web content might not suit you since we don't know your financial conditions and investment needs. Our financial information might have latency or contain inaccuracy, so you should be fully responsible for any of your trading and investment decisions. The company will not be responsible for your capital loss.

          Without getting permission from the website, you are not allowed to copy the website's graphics, texts, or trademarks. Intellectual property rights in the content or data incorporated into this website belong to its providers and exchange merchants.

          Not Logged In

          Log in to access more features

          FastBull Membership

          Not yet

          Purchase

          Become a signal provider
          Help Center
          Customer Service
          Dark Mode
          Price Up/Down Colors

          Log In

          Sign Up

          Position
          Layout
          Fullscreen
          Default to Chart
          The chart page opens by default when you visit fastbull.com