Markets
News
Analysis
User
24/7
Economic Calendar
Education
Data
- Names
- Latest
- Prev


Signal Accounts for Members
All Signal Accounts
All Contests


France Industrial Output MoM (SA) (Oct)A:--
F: --
France Trade Balance (SA) (Oct)A:--
F: --
Euro Zone Employment YoY (SA) (Q3)A:--
F: --
Canada Part-Time Employment (SA) (Nov)A:--
F: --
P: --
Canada Unemployment Rate (SA) (Nov)A:--
F: --
P: --
Canada Full-time Employment (SA) (Nov)A:--
F: --
P: --
Canada Labor Force Participation Rate (SA) (Nov)A:--
F: --
P: --
Canada Employment (SA) (Nov)A:--
F: --
P: --
U.S. PCE Price Index MoM (Sept)A:--
F: --
P: --
U.S. Personal Income MoM (Sept)A:--
F: --
P: --
U.S. Core PCE Price Index MoM (Sept)A:--
F: --
P: --
U.S. PCE Price Index YoY (SA) (Sept)A:--
F: --
P: --
U.S. Core PCE Price Index YoY (Sept)A:--
F: --
P: --
U.S. Personal Outlays MoM (SA) (Sept)A:--
F: --
U.S. 5-10 Year-Ahead Inflation Expectations (Dec)A:--
F: --
P: --
U.S. Real Personal Consumption Expenditures MoM (Sept)A:--
F: --
U.S. Weekly Total Rig CountA:--
F: --
P: --
U.S. Weekly Total Oil Rig CountA:--
F: --
P: --
U.S. Consumer Credit (SA) (Oct)A:--
F: --
China, Mainland Foreign Exchange Reserves (Nov)A:--
F: --
P: --
Japan Trade Balance (Oct)A:--
F: --
P: --
Japan Nominal GDP Revised QoQ (Q3)A:--
F: --
P: --
China, Mainland Imports YoY (CNH) (Nov)A:--
F: --
P: --
China, Mainland Exports (Nov)A:--
F: --
P: --
China, Mainland Imports (CNH) (Nov)A:--
F: --
P: --
China, Mainland Trade Balance (CNH) (Nov)A:--
F: --
P: --
China, Mainland Exports YoY (USD) (Nov)A:--
F: --
P: --
China, Mainland Imports YoY (USD) (Nov)A:--
F: --
P: --
Germany Industrial Output MoM (SA) (Oct)A:--
F: --
Euro Zone Sentix Investor Confidence Index (Dec)A:--
F: --
P: --
Canada National Economic Confidence Index--
F: --
P: --
U.K. BRC Like-For-Like Retail Sales YoY (Nov)--
F: --
P: --
U.K. BRC Overall Retail Sales YoY (Nov)--
F: --
P: --
Australia Overnight (Borrowing) Key Rate--
F: --
P: --
RBA Rate Statement
RBA Press Conference
Germany Exports MoM (SA) (Oct)--
F: --
P: --
U.S. NFIB Small Business Optimism Index (SA) (Nov)--
F: --
P: --
Mexico 12-Month Inflation (CPI) (Nov)--
F: --
P: --
Mexico Core CPI YoY (Nov)--
F: --
P: --
Mexico PPI YoY (Nov)--
F: --
P: --
U.S. Weekly Redbook Index YoY--
F: --
P: --
U.S. JOLTS Job Openings (SA) (Oct)--
F: --
P: --
China, Mainland M1 Money Supply YoY (Nov)--
F: --
P: --
China, Mainland M0 Money Supply YoY (Nov)--
F: --
P: --
China, Mainland M2 Money Supply YoY (Nov)--
F: --
P: --
U.S. EIA Short-Term Crude Production Forecast For The Year (Dec)--
F: --
P: --
U.S. EIA Natural Gas Production Forecast For The Next Year (Dec)--
F: --
P: --
U.S. EIA Short-Term Crude Production Forecast For The Next Year (Dec)--
F: --
P: --
EIA Monthly Short-Term Energy Outlook
U.S. API Weekly Gasoline Stocks--
F: --
P: --
U.S. API Weekly Cushing Crude Oil Stocks--
F: --
P: --
U.S. API Weekly Crude Oil Stocks--
F: --
P: --
U.S. API Weekly Refined Oil Stocks--
F: --
P: --
South Korea Unemployment Rate (SA) (Nov)--
F: --
P: --
Japan Reuters Tankan Non-Manufacturers Index (Dec)--
F: --
P: --
Japan Reuters Tankan Manufacturers Index (Dec)--
F: --
P: --
Japan Domestic Enterprise Commodity Price Index MoM (Nov)--
F: --
P: --
Japan Domestic Enterprise Commodity Price Index YoY (Nov)--
F: --
P: --
China, Mainland PPI YoY (Nov)--
F: --
P: --


No matching data
Latest Views
Latest Views
Trending Topics
Top Columnists
Latest Update
White Label
Data API
Web Plug-ins
Affiliate Program
View All

No data
Bitcoin Magazine Is a Bitcoin Supercycle Imminent? Bitcoin supercycle potential grows as metrics align with past bull runs. Is a parabolic rally next? This p...
Bitcoin is surging in 2025, igniting speculation about a historic Bitcoin supercycle. After a volatile start to the year, renewed momentum, recovering sentiment, and bullish metrics have analysts asking: Are we on the cusp of a 2017 Bitcoin bull run repeat? This Bitcoin price analysis explores cycle comparisons, investor behavior, and long-term holder trends to assess the likelihood of an explosive phase in this cryptocurrency market cycle.
The latest Bitcoin price surge has reset expectations. According to the BTC Growth Since Cycle Low chart, Bitcoin’s trajectory aligns closely with the 2016–2017 and 2020–2021 cycles, despite macro challenges and drawdowns.
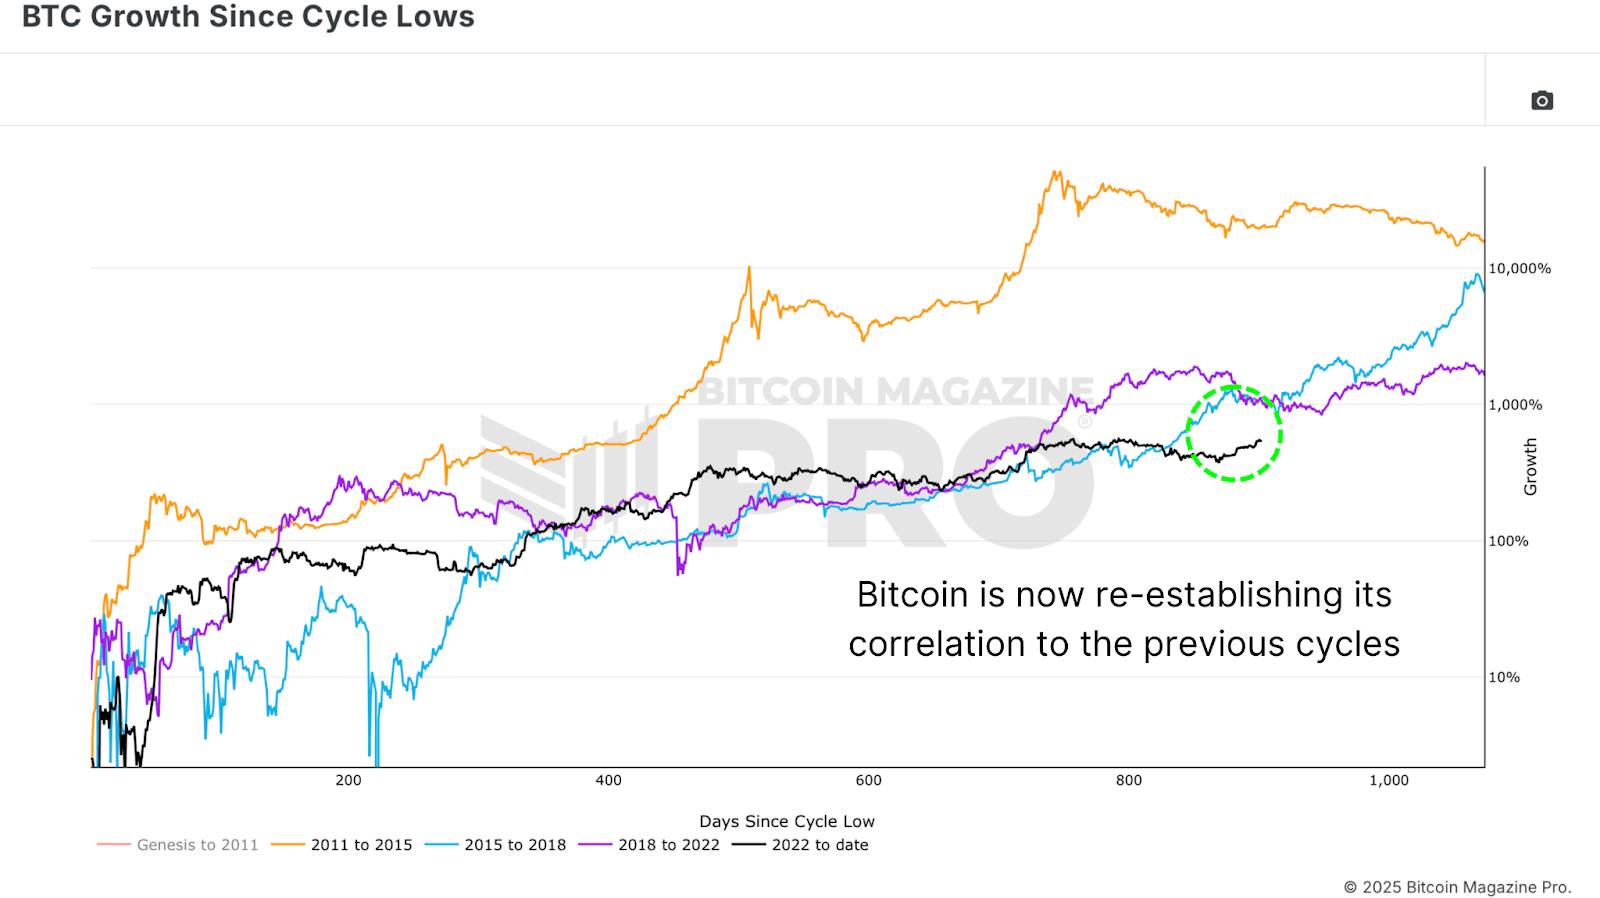
Figure 1: Bitcoin’s 2025 bullish price action mirrors previous cycles.Historically, Bitcoin market cycles peak around 1,100 days from their lows. At approximately 900 days into the current cycle, there may be several hundred days left for potential explosive Bitcoin price growth. But do investor behaviors and market mechanics support a Bitcoin supercycle 2025?
To gauge cryptocurrency investor psychology, the 2-Year Rolling MVRV-Z Score provides critical insights. This advanced metric accounts for lost coins, illiquid supply, growing ETF and institutional holdings, and shifting long-term Bitcoin holder behaviors.
Last year, when Bitcoin price hit ~$73,000, the MVRV-Z Score reached 3.39—a high but not unprecedented level. Retracements followed, mirroring mid-cycle consolidations seen in 2017. Notably, the 2017 cycle featured multiple high-score peaks before its final parabolic Bitcoin rally.
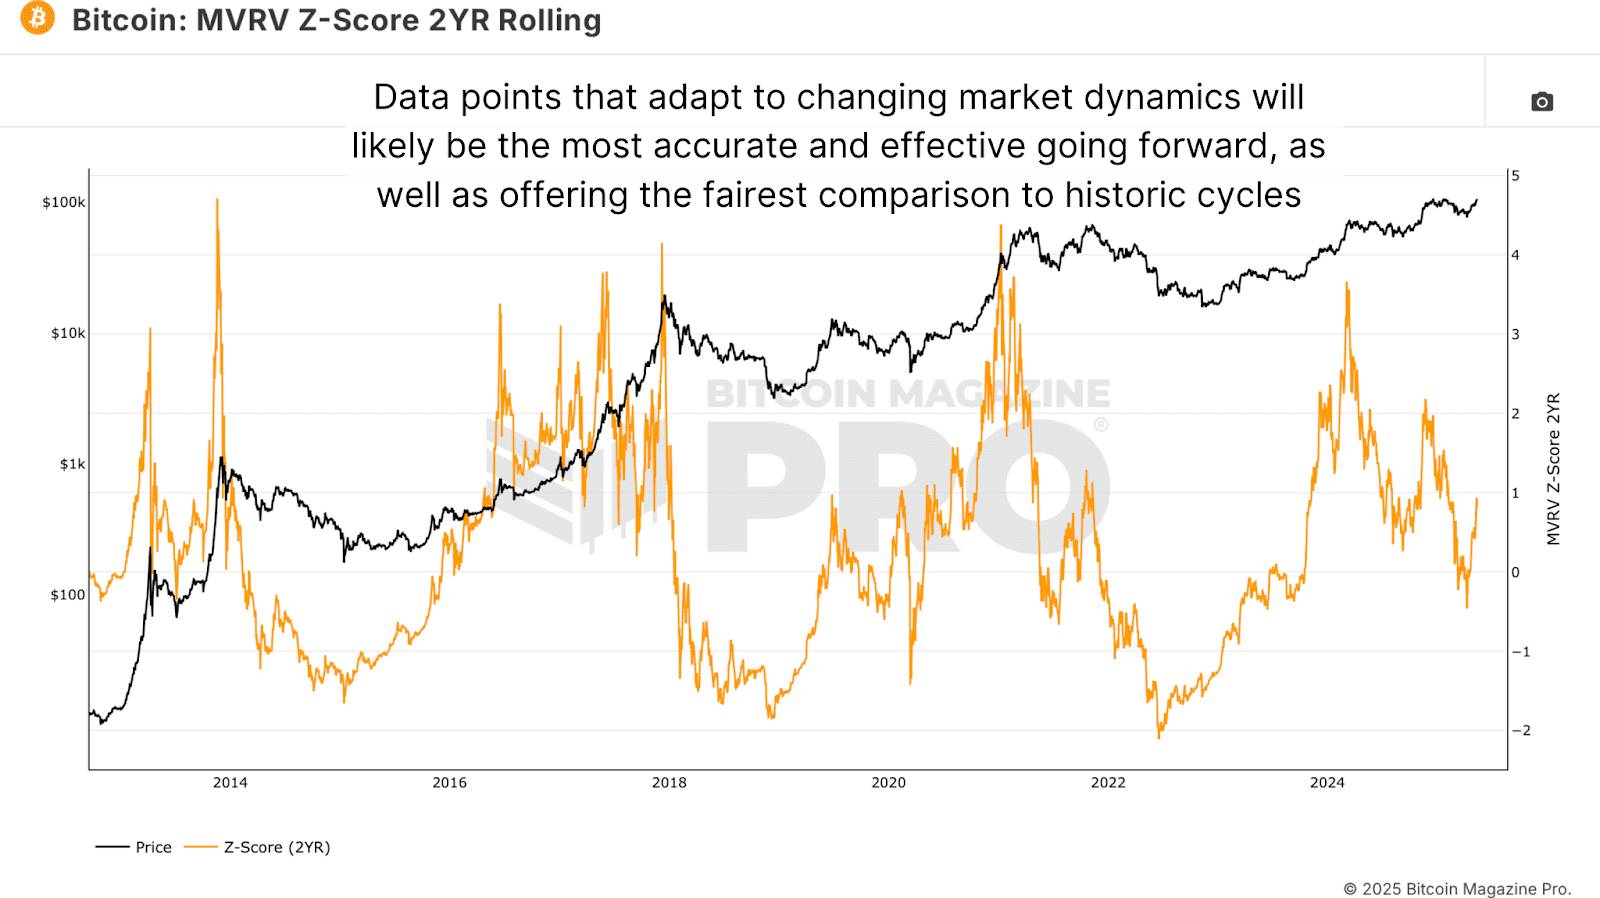
Figure 2: MVRV-Z Score shows behavioral similarities to the 2017 Bitcoin bull run. Using the Bitcoin Magazine Pro API, a cross-cycle Bitcoin analysis reveals a striking 91.5% behavioral correlation with the 2013 double-peak cycle. With two major tops already—one pre-halving ($74k) and one post-halving ($100k+)—a third all-time high could mark Bitcoin’s first-ever triple-peak bull cycle, a potential hallmark of a Bitcoin supercycle.
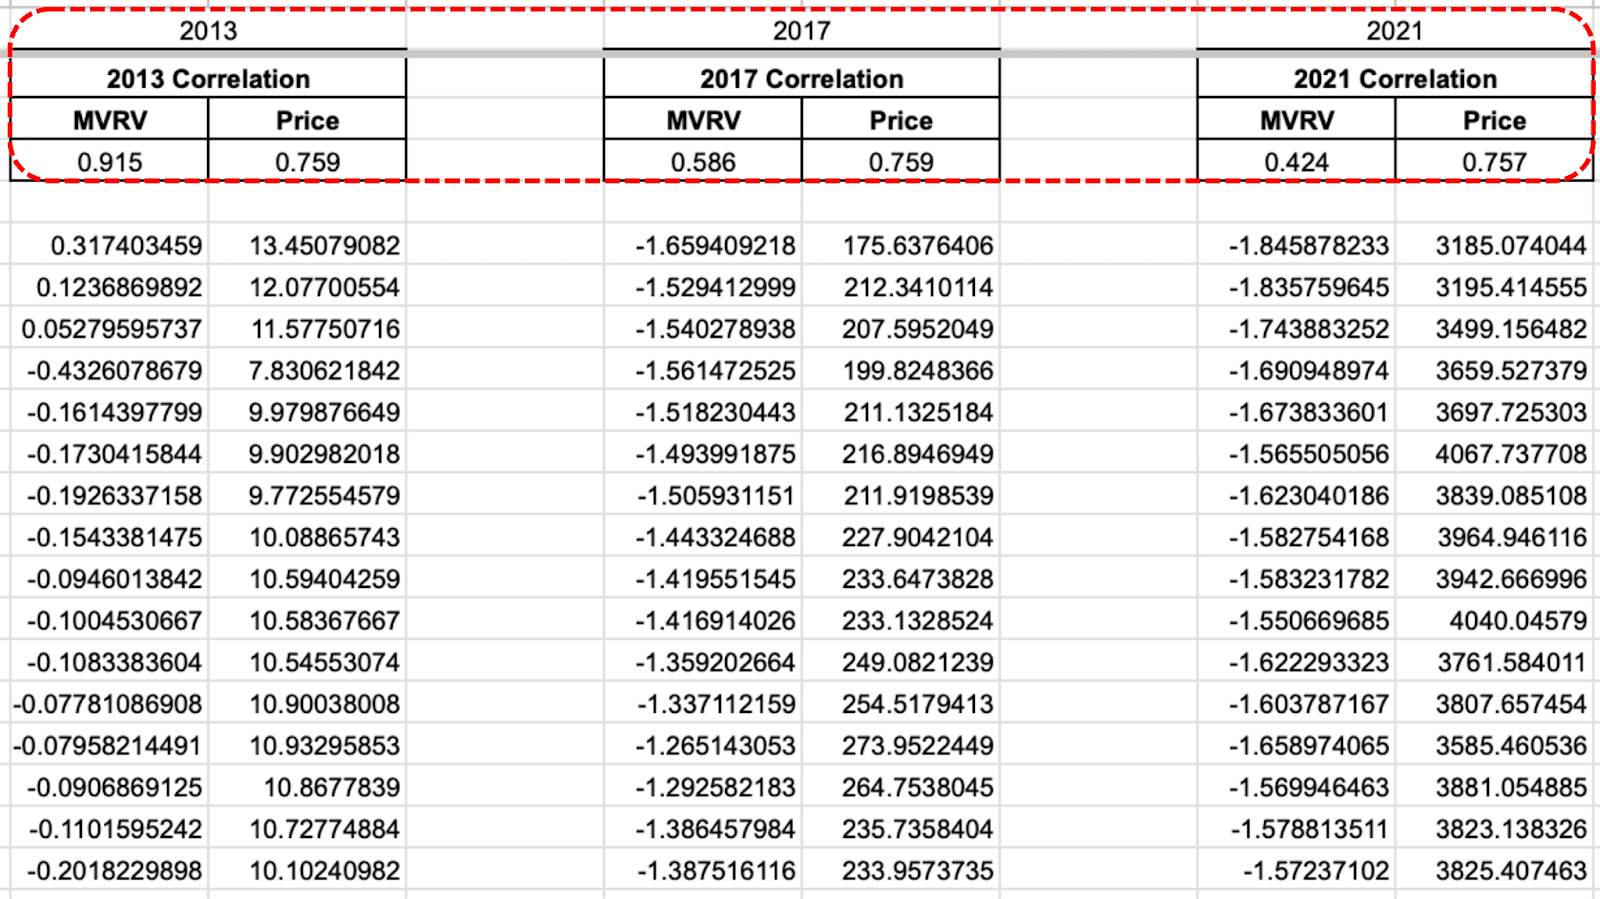
Figure 3: Cross-cycle behavioral correlations using rolling MVRV-Z scores and price action.The 2017 cycle shows a 58.6% behavioral correlation, while 2021’s investor behavior is less similar, though its Bitcoin price action correlates at ~75%.
The 1+ Year HODL Wave shows the percentage of BTC unmoved for a year or more continues to rise, even as prices climb—a rare trend in bull markets that reflects strong long-term holder conviction.
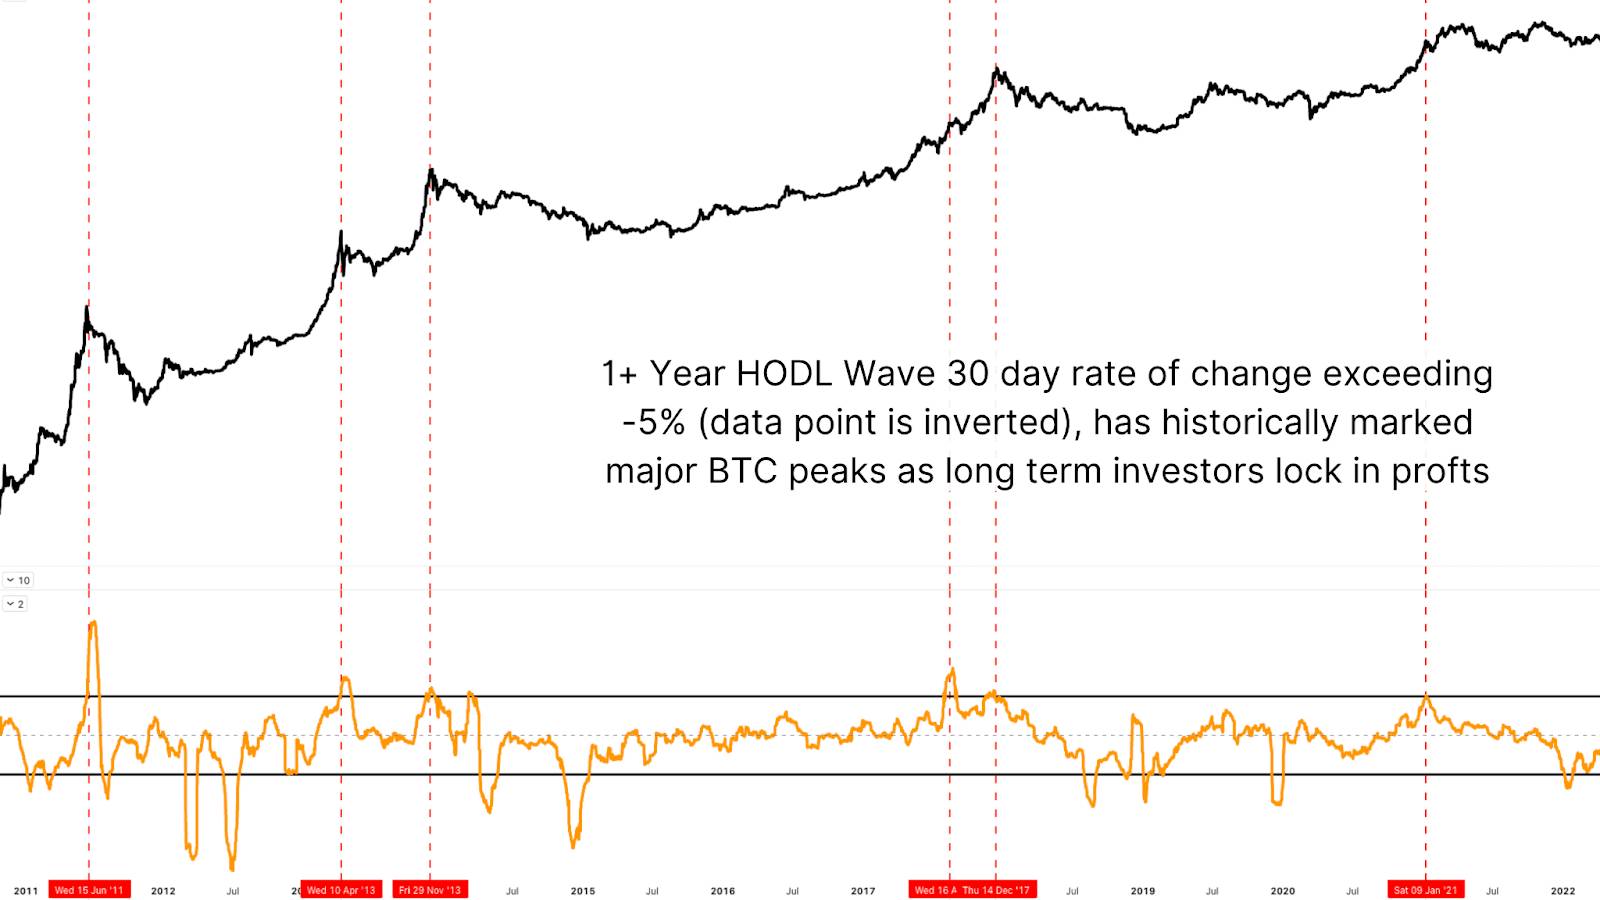
Figure 4: The rate of change in the 1+ Year HODL Wave suggests confidence in future Bitcoin prices. Historically, sharp rises in the HODL wave’s rate of change signal major bottoms, while sharp declines mark tops. Currently, the metric is at a neutral inflection point, far from peak distribution, indicating long-term Bitcoin investors expect significantly higher prices.
Could Bitcoin replicate 2017’s euphoric parabolic rally? It’s possible, but this cycle may carve a unique path, blending historical patterns with modern cryptocurrency market dynamics.
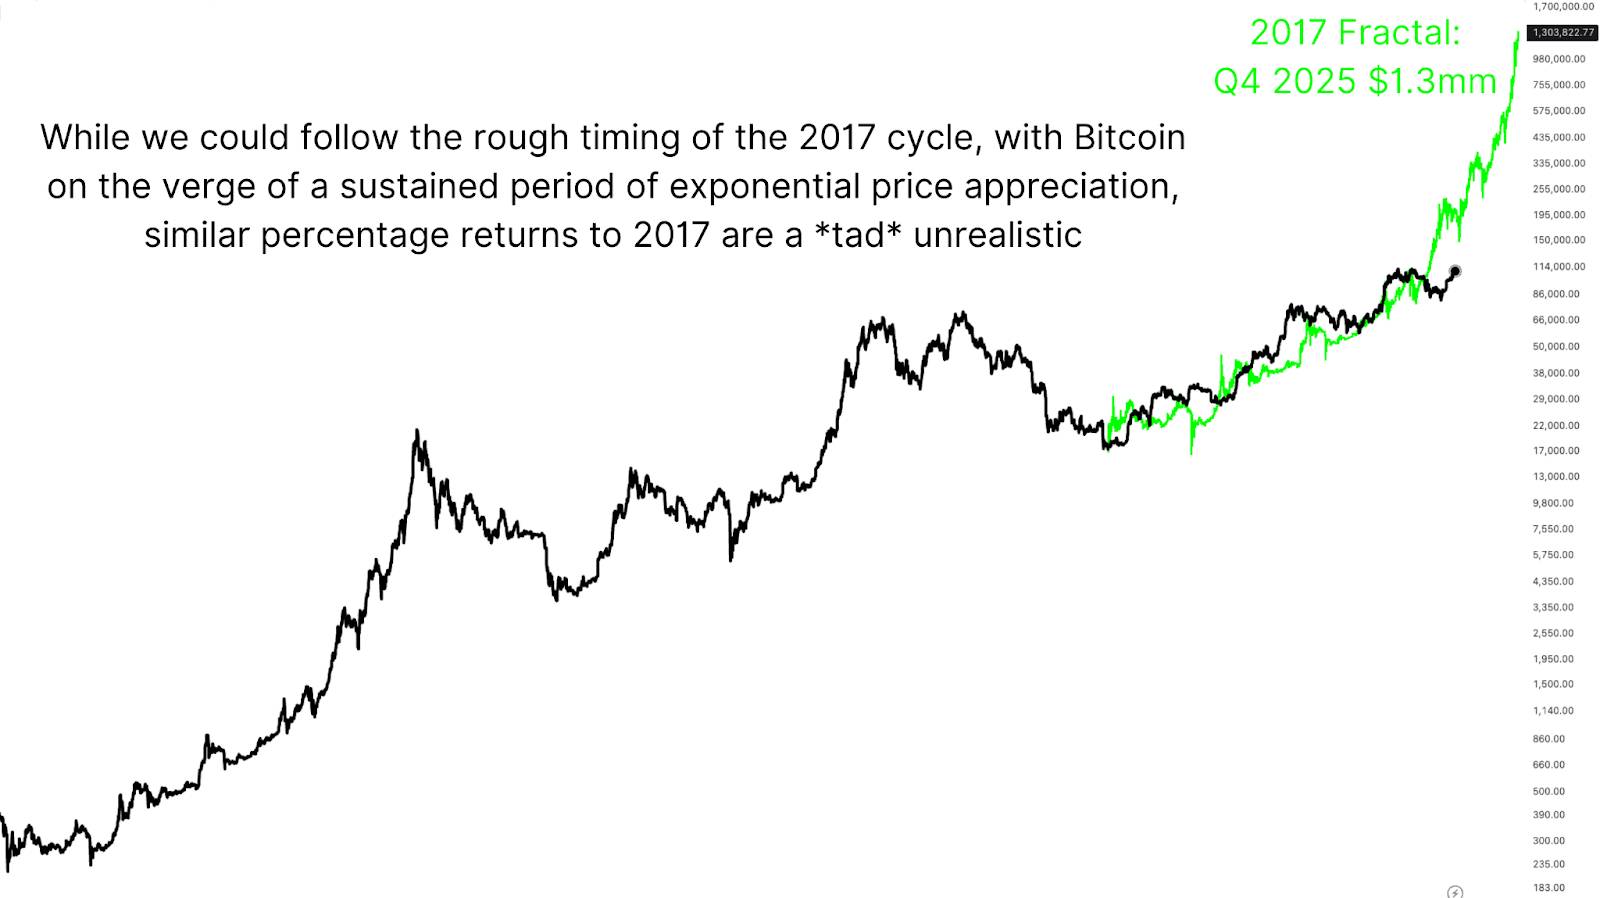
Figure 5: A repeat of 2017’s exponential Bitcoin price growth may be ambitious.We may be approaching a third major peak within this cycle—a first in Bitcoin’s history. Whether this triggers a full Bitcoin supercycle melt-up remains uncertain, but key metrics suggest BTC is far from topping. Supply is tight, long-term holders remain steadfast, and demand is rising, driven by stablecoin growth, institutional Bitcoin investment, and ETF flows.
Drawing direct parallels to 2017 or 2013 is tempting, but Bitcoin is no longer a fringe asset. As a maturing, institutionalized market, its behavior evolves, yet the potential for explosive Bitcoin growth persists.
Historical Bitcoin cycle correlations remain high, investor behavior is healthy, and technical indicators signal room to run. With no major signs of capitulation, profit-taking, or macro exhaustion, the stage is set for sustained Bitcoin price expansion. Whether this delivers a $150k rally or beyond, the 2025 Bitcoin bull run could be one for the history books.
Many fear that America’s withdrawal from the Paris climate agreement will undermine the international consensus to reduce greenhouse-gas emissions. Yet just in the last month, there have been two major steps toward widespread carbon pricing where it is needed most.
To be sure, carbon pricing is not always the best policy, and not all sectors need to be subjected to schemes that require international consistency. If India electrifies its vehicle fleet more slowly than Europe, European industry suffers no competitive disadvantage. But the situation is different in long-distance shipping and aviation, and in heavy industries such as steel and chemicals, which account for around 25% of global emissions. Here, carbon pricing is key to cost-efficient decarbonization, and must be imposed on an internationally consistent basis.
Fortunately, the technologies needed to achieve net-zero emissions by mid-century in each sector already exist. For example, methanol or ammonia can be used instead of fuel oil in ship engines, and hydrogen can replace coking coal in iron production. As matters stand, these technologies would impose a significant “green cost premium” at the intermediate product level, but with only a small impact on consumer prices. For example, even if shipping-freight rates doubled, the price of a pair of jeans made in Bangladesh and bought in London would rise less than 1%. If making zero-carbon steel costs 50% more per ton, that would add around 1% to the price of an automobile made from green steel.
Carbon pricing is essential to overcome the green cost premium, and it could drive cost-efficient decarbonization at a trivial cost to consumers. But in each of these sectors, inherently international products (long-distance shipping) or the international trade in products (steel) make purely domestic approaches untenable. That is why the International Maritime Organization (IMO) agreed on April 11 to impose a carbon levy reaching $380 per metric ton on ship operators whose emissions intensity exceeds a defined threshold.
The IMO agreement is not perfect. The organization aims to cut global shipping emissions by 20% by 2030, but the new pricing scheme would achieve only an 8% reduction. Still, concluding a new multilateral agreement despite a US boycott of the negotiations is a big step forward. China, India, and Brazil were among the 63 countries in favor.
Carbon pricing could also drive decarbonization in heavy industry, but if it is imposed in only some countries, production and emissions will simply move to others. Though the ideal solution would be common carbon prices worldwide for these energy-intensive sectors, there is no international rule-making body like the IMO. The second-best solution, then, is for individual countries to impose domestic carbon prices combined with border carbon tariffs.
The European Union is pursuing this approach. Not only will its emissions-trading scheme likely price carbon around $140 per metric ton by 2030; it is also removing the free allowances that heavy industry previously enjoyed and introducing a border carbon adjustment mechanism (CBAM) to subject imports to the same carbon pricing as domestic production. In principle, this creates strong incentives for decarbonization, while protecting domestic competitiveness.
But the CBAM has been too weak, and heavy-industry decarbonization projects have been delayed. As a result, in March the European Commission committed to strengthening the regime in three respects: by ensuring a level playing field for exports as well as domestic sales; by widening the product coverage; and by improving the measurement of imports’ carbon intensity.
The crucial question now is how developing countries will respond. In the past, several governments – in particular China and India – have criticized CBAMs as protectionist. But their arguments are unconvincing. Combining a domestic carbon price with a CBAM does not give domestic producers a competitive advantage. It simply maintains the competitive balance that existed before both were introduced. Moreover, it is the only way that developed countries can truly decarbonize their heavy industry, rather than hypocritically claiming to reduce emissions that have merely moved to other countries. The objective of the policy is not to raise tariff revenue, but to encourage other countries to impose carbon prices at home.
These arguments are beginning to gain traction in developing countries. China’s own emissions-trading scheme has been extended to heavy-industry sectors, and prices are slowly increasing – though they still hover around $10-15 per metric ton. If carbon prices in China, India, and other developing countries gradually rose to European levels, and if CBAMs were imposed on those outside this low-carbon club, Chinese and Indian companies would also decarbonize. Even better, the impact on local consumer prices would be trivial, and governments would generate revenue.
In this way, the EU’s approach could unleash a global wave of carbon pricing on heavy industry, matching the IMO’s progress in shipping. Ideally, policies would reflect internationally agreed standards for measuring the carbon intensity of production, and some of the revenues from CBAMs – and from the IMO’s carbon levies – would go toward supporting emissions reduction in lower-income countries. These ideas should be debated at COP30 in Brazil this November, regardless of whether an official US delegation attends.

White Label
Data API
Web Plug-ins
Poster Maker
Affiliate Program
The risk of loss in trading financial instruments such as stocks, FX, commodities, futures, bonds, ETFs and crypto can be substantial. You may sustain a total loss of the funds that you deposit with your broker. Therefore, you should carefully consider whether such trading is suitable for you in light of your circumstances and financial resources.
No decision to invest should be made without thoroughly conducting due diligence by yourself or consulting with your financial advisors. Our web content might not suit you since we don't know your financial conditions and investment needs. Our financial information might have latency or contain inaccuracy, so you should be fully responsible for any of your trading and investment decisions. The company will not be responsible for your capital loss.
Without getting permission from the website, you are not allowed to copy the website's graphics, texts, or trademarks. Intellectual property rights in the content or data incorporated into this website belong to its providers and exchange merchants.
Not Logged In
Log in to access more features

FastBull Membership
Not yet
Purchase
Log In
Sign Up