Markets
News
Analysis
User
24/7
Economic Calendar
Education
Data
- Names
- Latest
- Prev


Signal Accounts for Members
All Signal Accounts
All Contests


BOJ Press Conference
Turkey Consumer Confidence Index (Dec)A:--
F: --
P: --
U.K. Retail Sales YoY (SA) (Nov)A:--
F: --
U.K. Core Retail Sales YoY (SA) (Nov)A:--
F: --
Germany PPI YoY (Nov)A:--
F: --
P: --
Germany PPI MoM (Nov)A:--
F: --
P: --
Germany GfK Consumer Confidence Index (SA) (Jan)A:--
F: --
U.K. Retail Sales MoM (SA) (Nov)A:--
F: --
P: --
France PPI MoM (Nov)A:--
F: --
P: --
Euro Zone Current Account (Not SA) (Oct)A:--
F: --
P: --
Euro Zone Current Account (SA) (Oct)A:--
F: --
P: --
Russia Key RateA:--
F: --
P: --
U.K. CBI Distributive Trades (Dec)A:--
F: --
P: --
U.K. CBI Retail Sales Expectations Index (Dec)A:--
F: --
P: --
Brazil Current Account (Nov)A:--
F: --
P: --
Canada Retail Sales MoM (SA) (Oct)A:--
F: --
Canada New Housing Price Index MoM (Nov)A:--
F: --
P: --
Canada Core Retail Sales MoM (SA) (Oct)A:--
F: --
U.S. Existing Home Sales Annualized MoM (Nov)A:--
F: --
U.S. UMich Consumer Sentiment Index Final (Dec)A:--
F: --
P: --
U.S. Conference Board Employment Trends Index (SA) (Nov)A:--
F: --
Euro Zone Consumer Confidence Index Prelim (Dec)A:--
F: --
P: --
U.S. UMich 1-Year-Ahead Inflation Expectations Final (Dec)A:--
F: --
P: --
U.S. UMich Consumer Expectations Index Final (Dec)A:--
F: --
P: --
U.S. UMich Current Economic Conditions Index Final (Dec)A:--
F: --
P: --
U.S. Existing Home Sales Annualized Total (Nov)A:--
F: --
U.S. Weekly Total Rig CountA:--
F: --
P: --
U.S. Weekly Total Oil Rig CountA:--
F: --
P: --
China, Mainland 5-Year Loan Prime RateA:--
F: --
P: --
China, Mainland 1-Year Loan Prime Rate (LPR)A:--
F: --
P: --
U.K. Current Account (Q3)--
F: --
P: --
U.K. GDP Final YoY (Q3)--
F: --
P: --
U.K. GDP Final QoQ (Q3)--
F: --
P: --
Italy PPI YoY (Nov)--
F: --
P: --
Mexico Economic Activity Index YoY (Oct)--
F: --
P: --
Canada National Economic Confidence Index--
F: --
P: --
Canada Industrial Product Price Index YoY (Nov)--
F: --
P: --
U.S. Chicago Fed National Activity Index (Nov)--
F: --
P: --
Canada Industrial Product Price Index MoM (Nov)--
F: --
P: --
U.S. Dallas Fed PCE Price Index YoY (Oct)--
F: --
P: --
RBA Monetary Policy Meeting Minutes
Euro Zone Total Reserve Assets (Nov)--
F: --
P: --
Mexico Trade Balance (Nov)--
F: --
P: --
Canada GDP YoY (Oct)--
F: --
P: --
Canada GDP MoM (SA) (Oct)--
F: --
P: --
U.S. Core PCE Price Index Prelim YoY (Q3)--
F: --
P: --
U.S. PCE Price Index Prelim YoY (Q3)--
F: --
P: --
U.S. Annualized Real GDP Prelim (Q3)--
F: --
P: --
U.S. Non-Defense Capital Durable Goods Orders MoM (Excl. Aircraft) (Oct)--
F: --
P: --
U.S. PCE Price Index Prelim QoQ (SA) (Q3)--
F: --
P: --
U.S. Core PCE Price Index Annualized QoQ Prelim (SA) (Q3)--
F: --
P: --
U.S. GDP Deflator Prelim QoQ (SA) (Q3)--
F: --
P: --
U.S. Durable Goods Orders MoM (Excl. Defense) (SA) (Oct)--
F: --
P: --
U.S. Durable Goods Orders MoM (Excl.Transport) (Oct)--
F: --
P: --
U.S. Real Personal Consumption Expenditures Prelim QoQ (Q3)--
F: --
P: --
U.S. Real GDP Annualized QoQ Prelim (SA) (Q3)--
F: --
P: --
U.S. Durable Goods Orders MoM (Oct)--
F: --
P: --
U.S. Weekly Redbook Index YoY--
F: --
P: --
U.S. Industrial Output YoY (Nov)--
F: --
P: --
U.S. Industrial Output MoM (SA) (Nov)--
F: --
P: --
U.S. Capacity Utilization MoM (SA) (Nov)--
F: --
P: --


No matching data
Latest Views
Latest Views
Trending Topics
Top Columnists
Latest Update
White Label
Data API
Web Plug-ins
Affiliate Program
View All

No data
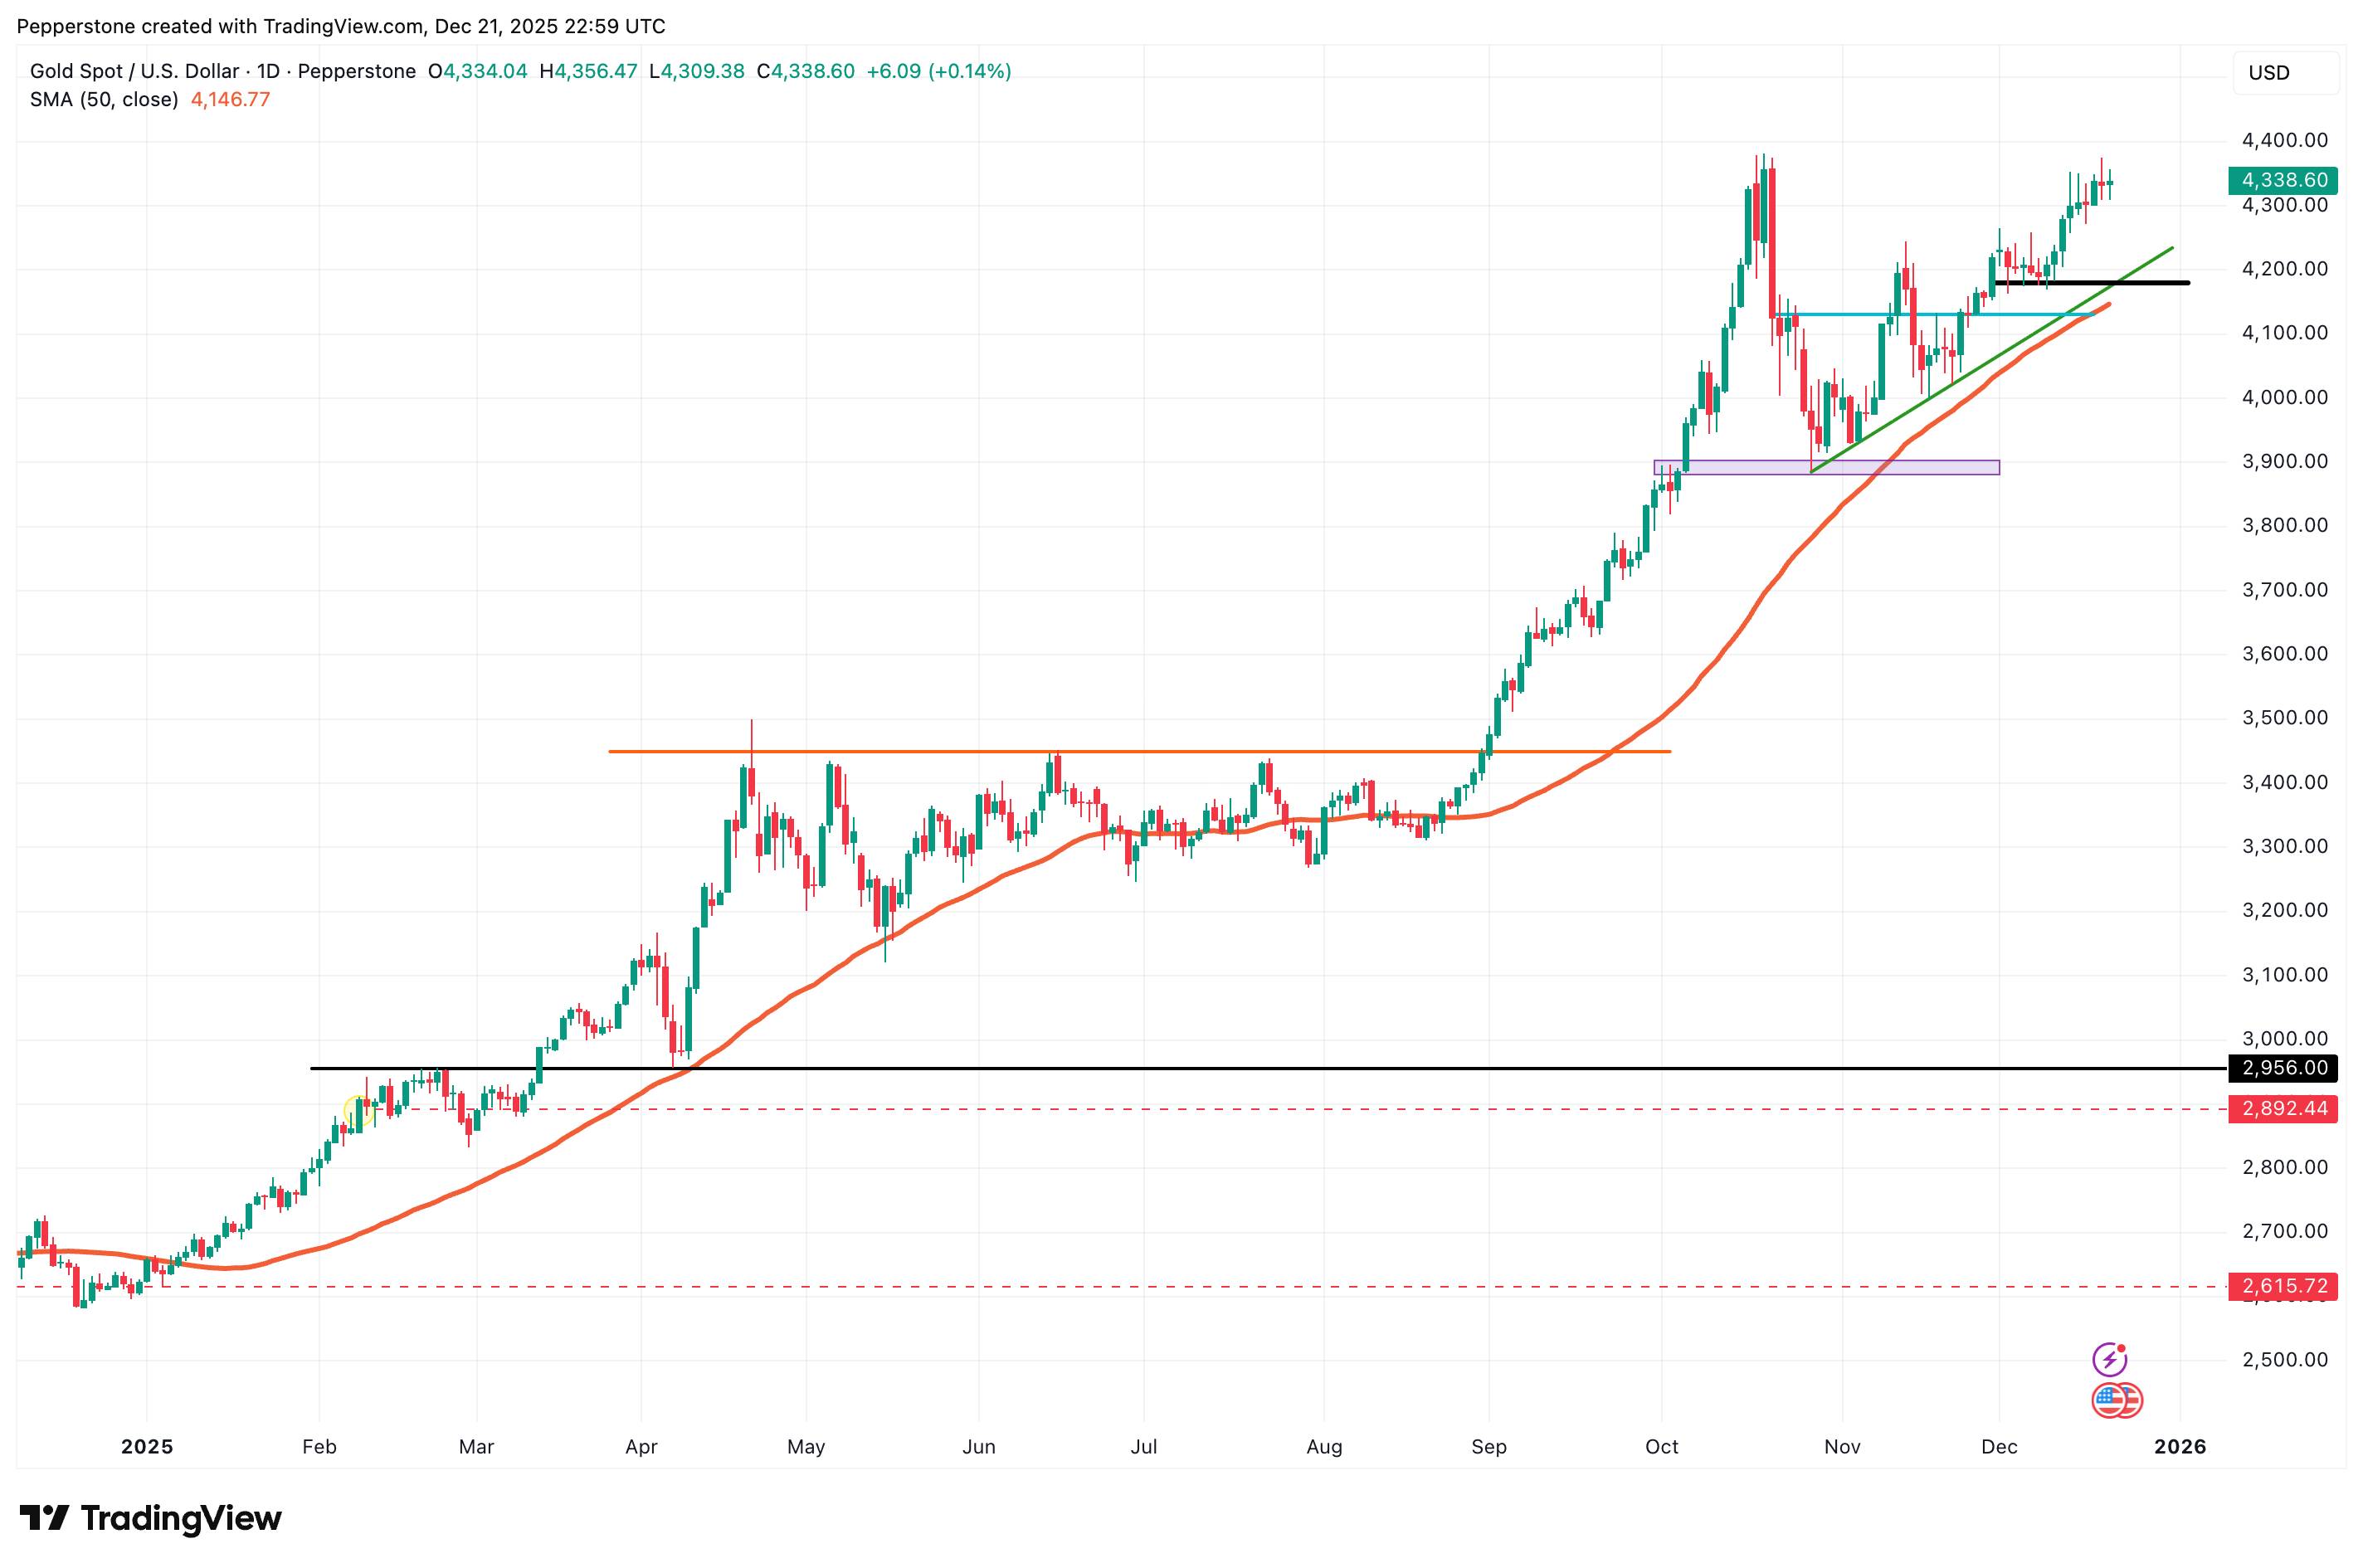
Looking back at 2025, gold delivered one of the most striking performances across global markets. Prices repeatedly pushed to new highs, breaking historical records more than 50 times, with peak gains reaching as much as 67%.
In historical terms, this marked the strongest annual performance since 1979. In relative terms, gold significantly outperformed major equity benchmarks such as the S&P 500 and the Nasdaq.

What stood out even more was the breakdown of traditional correlations. Under conventional trading logic, gold typically moves inversely to interest rates or risk assets. Yet over the past year, gold and U.S. equities rose side by side—an unusual and telling development. This signals a fundamental shift in how the market is pricing gold.
As the year draws to a close, traders are asking two key questions: can the bullish momentum of 2025 extend into 2026? And what forces may continue to support gold—or cap its upside—from here?
Gold's rally in 2025 was not the result of a single catalyst, but rather the convergence of several powerful forces.
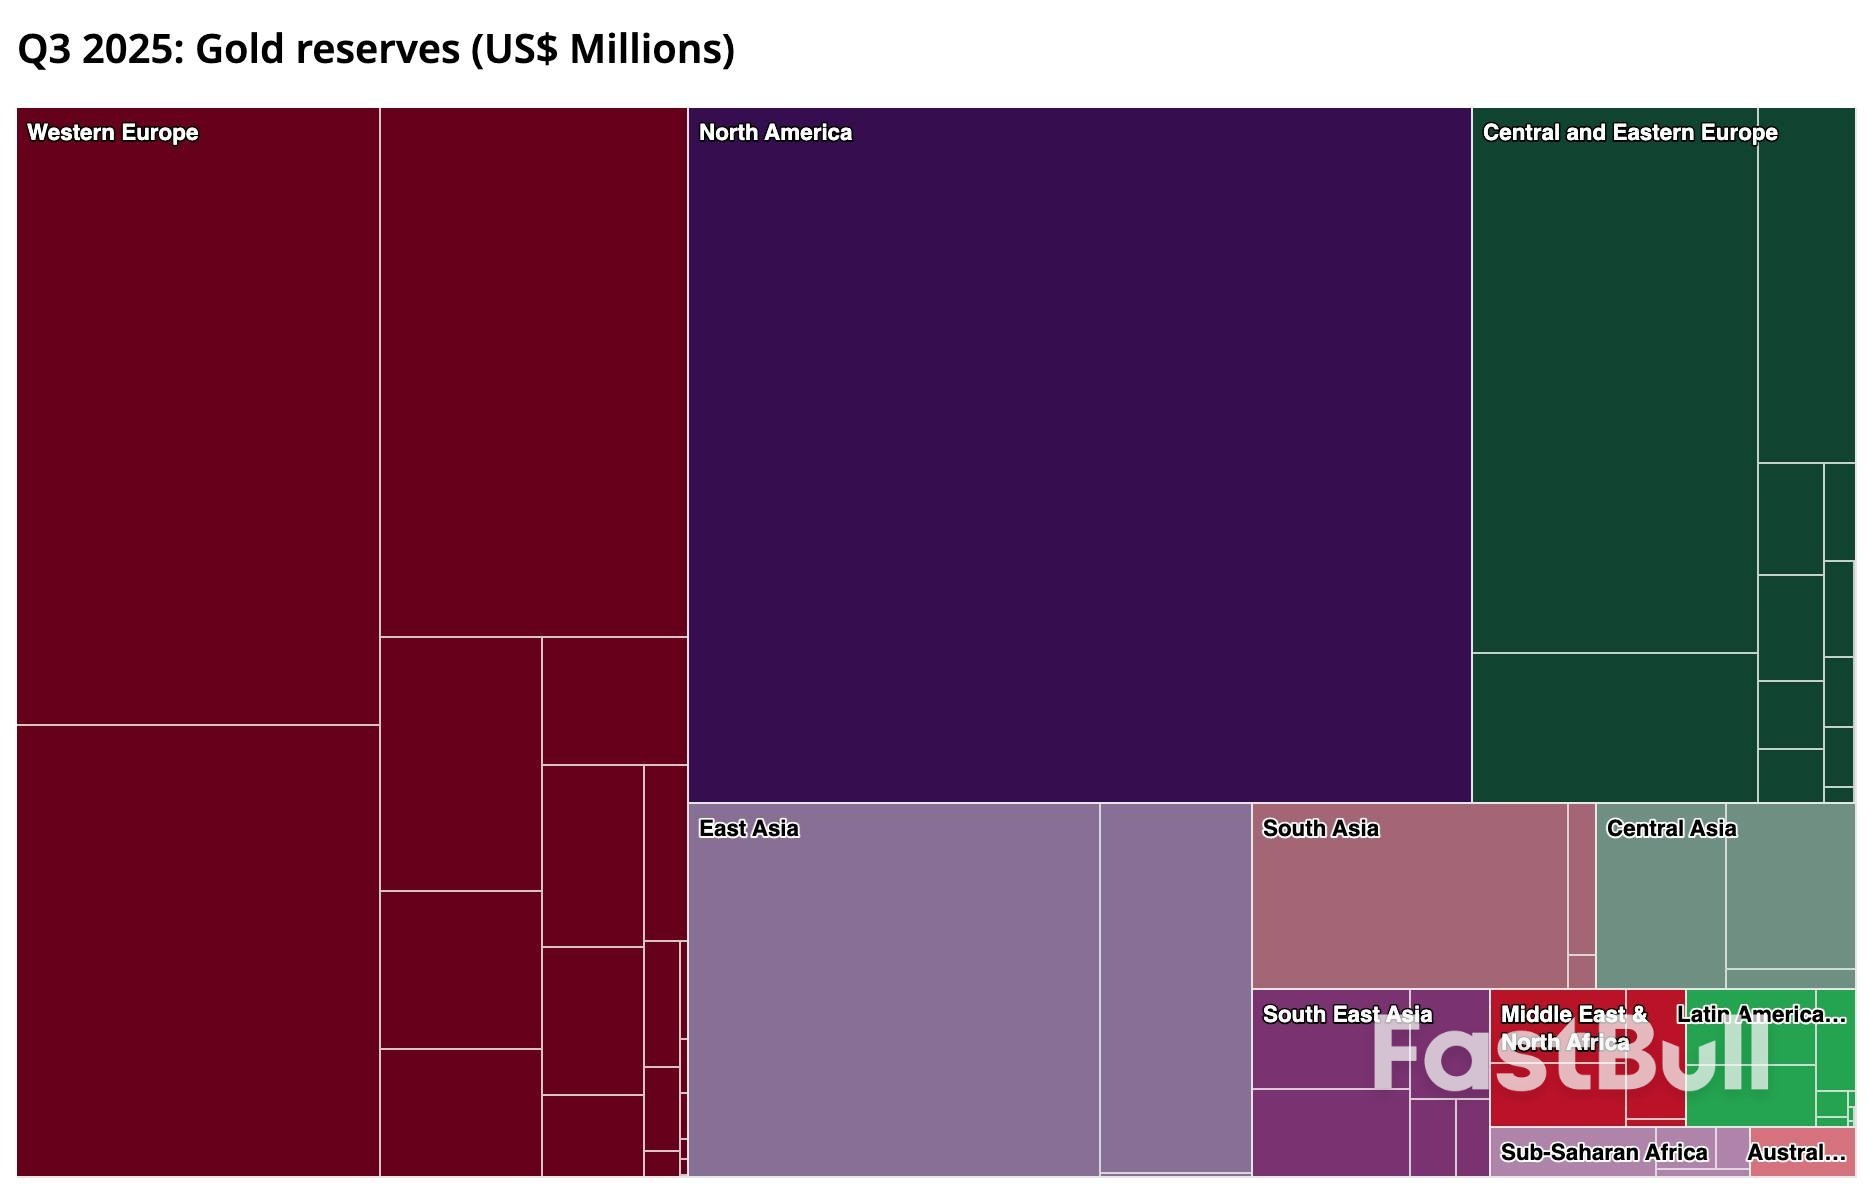
Central bank buying formed the backbone of gold's resilience at elevated levels. Global central banks have remained net buyers for multiple consecutive years. In the first three quarters of 2025 alone, net purchases reached 634 tonnes, with full-year demand expected to exceed 1,200 tonnes. The People's Bank of China, in particular, added gold for 13 straight months, lifting gold's share in its FX reserves to a record high.

At a deeper level, this reflects a structural shift in the global monetary system. Concerns over U.S. fiscal sustainability and the erosion of dollar credibility have accelerated reserve diversification. Gold—sanction-proof and strategically neutral—has emerged as a preferred anchor asset. This demand is both cycle-insensitive and price-insensitive, effectively lifting gold's long-term valuation floor.
At the same time, expectations of lower rates and a weaker USD reduced the opportunity cost of holding gold. Throughout 2025, markets increasingly priced in the Fed's next rate cut, pushing yields lower and weighing on the dollar—both supportive for a non-yielding asset priced in USD. Improved global liquidity conditions associated with easing cycles added another tailwind.
Geopolitical and macro uncertainty also played a critical role. Persistent tensions across Ukraine, the Middle East, and parts of Southeast Asia continued to disrupt financial systems, trade routes, and supply chains.
Meanwhile, global growth slowed and recession concerns around the U.S. economy resurfaced intermittently. Add to that policy uncertainty—ranging from volatile tariff rhetoric under Trump to perceived threats to Fed independence—and markets grew more sensitive to systemic risk. In such an environment, gold's appeal as a hedge remained strong.
Finally, price momentum itself reinforced the trend. Global gold ETFs saw cumulative inflows of around USD 77 billion in 2025, highlighting the importance of sentiment and structural shifts in driving demand. Asia—particularly China and India—stood out, with retail and institutional demand for both physical gold and ETFs surging. Rising prices attracted incremental capital, which in turn pushed prices higher, creating a self-reinforcing loop.
Taken together, central bank buying, safe-haven demand from geopolitical and economic uncertainty, and strong ETF inflows provided gold with demand largely independent of interest rates or equity market performance. Also, falling yields and a weaker dollar lowered holding costs.
Capital flowed simultaneously into equities and gold under a dual logic of return-seeking and risk hedging—producing the rare phenomenon of synchronized gains.
Looking ahead to 2026, I think gold still has upside potential—but a repeat of 2025's extreme gains looks unlikely. Whether the U.S. economy slips into recession, or whether the narrative of U.S. exceptionalism regains traction, will be key in defining gold's upside range. Beyond that, data releases and event risk are likely to shape short-term trading rhythms rather than the broader trend.
From a strategic perspective, it matters less to pinpoint an exact price level than to understand gold's role across different macro scenarios. Central bank buying, physical demand, and geopolitical hedging remain medium- to long-term anchors, while Fed policy and real rates continue to drive cyclical swings. Broadly, three scenarios stand out:
It is also worth noting that the buyer base is expanding. Beyond central banks, institutions, retail traders, and physical demand, new entrants—such as stablecoin issuers like Tether and certain corporate treasury departments—are beginning to allocate to gold. This broader capital base adds resilience to demand. Even in the face of corrections, gold's strategic role in global portfolios appears firmly entrenched.
Heading into 2026, gold remains supported by multiple structural tailwinds: persistent central bank buying, a dollar and rate environment broadly favorable to gold, and elevated geopolitical and macro uncertainty. In other words, the path of least resistance still points higher.
For traders, the key is to recognize gold's evolving role and adapt positioning to different macro regimes. In a mild slowdown or downturn, buying on dips remains a core strategy. In the event of extreme risk-off shocks, selectively adding exposure may help capture short-term upside.
Conversely, if growth surprises to the upside or the dollar strengthens materially, reducing exposure or hedging becomes essential to manage downside risk. Short-term XAUUSD volatility, cross-currency opportunities driven by global policy divergence, and shifts in ETF flows all offer valuable trading signals.
Opportunities along the gold supply chain also deserve attention. Rising gold prices directly improve profitability across mining and related industries, creating additional trading and investment angles. Price transmission along the value chain not only offers speculative opportunities, but also provides useful insight into broader gold market dynamics.
Overall, the gold market in 2026 calls for a combination of clear-headed macro analysis and tactical flexibility—capturing short-term opportunities while respecting gold's enduring value as a medium- to long-term strategic allocation.
John C. Williams, New York Federal Reserve President, affirms no urgency for further interest rate cuts after three reductions in 2025, impacting crypto market expectations for January 2026.
Traders speculate on steady rates, with 73-77% betting against a rate cut, influencing Bitcoin and Ethereum prices amid broader market declines.
John C. Williams, President of the New York Federal Reserve, emphasized no urgency for further rate cuts, having already reduced rates three times in 2025. This decision appears to hold significant implications for the global financial landscape, as seen by a recent news article.
The statement by Williams, a key member of the Federal Open Market Committee, was primarily relayed through market pricing tools like CME FedWatch, indicating restrained action on further monetary policy adjustments.
The crypto markets reacted with increased bets against a rate cut in January 2026, reflected in CME FedWatch's 73-77% likelihood of steady rates. This scenario has substantial short-term effects on market sentiment. Bitcoin (BTC), for instance, saw notable volatility. You can stay updated on such events by following CoinGap Media on Twitter.
This move signals a potential pause in monetary stimulus, likely affecting liquidity-sensitive assets, including cryptocurrencies. Ethereum (ETH) and other assets may experience similar speculative adjustments. For instance, Phemex offers platforms to trade these assets effectively.
The policy direction contrasts with some Federal Reserve presidents calling for action. The polymarket data showed traders weighing limited rate changes across 2026, reflecting broader economic expectations.
Analysts suggest that high inflation remains a primary concern despite a forecasted 2.5% by 2026. Historically, a hawkish Fed stance has suppressed crypto valuations but prompted rallies with easier policy sentiments.
John C. Williams, President, New York Federal Reserve, "Inflation remains 'dangerously high' despite progress to 2.5% projection by 2026, with policy 'well placed'; November CPI distorted by technical factors."
Looking back over the past year and ahead to 2026, it feels especially relevant to re-emphasize the importance of staying invested and diversified.
Since this will be our last CIO Weekly Perspectives for this year, it seems appropriate to look back and remind ourselves of a few tried and true investment philosophies: invest with a long-term horizon and stay diversified.
This year has certainly been an interesting one (though most all years are in some way). From fears of a recession and a violent sell-off induced by the 'liberation day' tariffs, growth has since proved remarkably resilient while risk assets, led by equities, have recovered impressively, hitting fresh highs despite frequent bouts of market volatility.
As we look to 2026, there is an array of macro-risks and concerns around the sustainability of the equity market rally, particularly the AI-related stocks. But we remain constructive, if not optimistic, in our outlook on growth and risk markets, bolstered by an expectation for economic reacceleration driven by monetary and fiscal stimulus.
This view forms the basis of our recent Solving for 2026 outlook, which explores five important and powerful themes to navigate markets by next year.
Central to our view is that amid the periods of market stress that we anticipate seeing in 2026—broadly related to macro and policy flux and the AI investment enthusiasm—a longer-term and diversified mindset is paramount to successfully navigating through the choppiness and capturing the upside.
Indeed, while we expect risk assets to have the inevitable ups and downs next year, what's most important when seeking to generate long-term portfolio returns is staying invested and staying diversified.
History, both recent and distant, tells us that staying in markets during turbulent and uncertain times can often pay handsomely; for instance, since the U.S. administration announced its initial tariffs on April 2, the S&P 500 and Nasdaq 100 indexes have delivered returns of over 35% and 48%, respectively. If one simply stayed fully invested since the beginning of the year, withstanding the ups and downs, those indices are up 15% and 19%, respectively.
Such gains may feel exceptional in the context of the severity of the sell-off in April. But they're not—far from it. Looking back, returns over longer periods of time after severe sell-offs have been even more impressive. The S&P 500 and Nasdaq 100, for instance, have to-date delivered total returns of over 160% and 277%, respectively since the peak of the Covid pandemic in March (23rd) 2020. The S&P 500 is up a remarkable 900% since the nadir of the global financial crisis in March (9th) 2009.
While these are only a handful of examples, they help demonstrate that compounding from staying invested is incredibly powerful over the long term. Trying to time the market, by comparison, is extremely difficult, often leading investors to miss out on outsized returns.
We appreciate that the market volatility we saw this year and anticipate seeing again in some shape or form next year, is stress-inducing. But it should be seen in the longer-term context, which makes it not so extraordinary. For example, the MSCI World Index shows equities have suffered 10%-plus falls in more years than not over the past half century, with more severe 20% declines having happened roughly every four years.
Staying invested is not blind optimism; it is disciplined realism. Markets will deliver periods of anxiety in 2026 likely relating to policy cross-currents, AI exuberance and geopolitical noise, but history's lesson is clear: durable wealth accrues to investors who keep a long-term lens and rebalance thoughtfully.
In practice, this means rather than chasing the latest winners or fleeing the laggards, a well-balanced portfolio helps cushion against whipsawing markets and sector rotations—whether growth to value, large cap to mid-cap, U.S. to international, cyclicals to defensives—without forfeiting participation. This diversification complements patience; it keeps compounding intact while the market's pendulum swings, turning rotation into opportunity rather than disruption. It can also mitigate the effect of a narrow "bubble" bursting, which is often inevitable when an individual sector valuation becomes too stretched.
As monetary and fiscal supports feed through and nominal growth accelerates, the greater risk may be underparticipation, not overexposure. For 2026, broaden diversification where it makes sense, particularly across regions and styles, and be ready to pick off mispriced opportunities when the pendulum swings too far.

Business leaders have warned that Britain is entering 2026 amid a sharp economic downturn in the private sector, after companies "put the brakes on" investment and hiring before the autumn budget.
In a gloomy snapshot after months of tax speculation, the Confederation of British Industry (CBI) said private sector output was on track to fall in the fourth quarter of 2025.
Suggesting the budget did little to brighten bosses' moods, the lobby group's latest growth indicator showed falling activity was reported across all sectors of the economy in the three months to December.
Separate figures from the jobs website Adzuna showed the number of UK job vacancies shrank in November for a fifth month running. Reporting a 6.4% month-on-month slide in new openings, the jobs website said 2025 had been "one of the toughest years for jobseekers since the pandemic".
The chancellor's tax and spending statement on 26 November does not appear to have kickstarted business optimism. According to the CBI, private firms are predicting economic activity will fall further in the next three months, continuing a run of negative forecasts that began in late 2024.
Alpesh Paleja, deputy chief economist at the CBI, said: "Uncertainty ahead of November's budget put the brakes on key spending decisions and big projects, choking up pipelines of work. The latest growth indicator suggests that the alleviation of this uncertainty hasn't materially boosted activity.
"Our latest surveys round off a disappointing year for private sector growth. They mark a continuation of the headwinds that have plagued businesses over the past 12 months: tepid demand conditions with households cautious around spending, and strong cost pressures squeezing margins."
Compiled from a survey of more than 900 companies between 24 November – the week of Rachel Reeves's budget – and 11 December, the CBI's snapshot revealed a broad-based downturn across the private sector.
The reading on its monthly growth indicator fell to -30%, from -27% in November. The weighted balance score is the difference between the percentage of firms who expect activity to rise over the next three months and respondents anticipating a decline.
The Bank of England warned last week that Britain's economy was on track to record zero growth in the final three months of 2025, after output unexpectedly shrank in October, with consumers holding back on spending before the budget.
Businesses are calling on the Labour government to work with industry to increase its support for companies grappling with high energy costs, while also working to simplify the tax system as part of ministers' mission to boost economic growth.
Andrew Hunter, the co-founder of Adzuna, said the budget had added to end-of-year uncertainty for employers.
He said: "2025 has been one of the toughest environments for jobseekers across almost every corner of the market, particularly among people entering the market for the first time. One glimmer of light is that wage growth continues to counteract the vacancy slump."
Adzuna data shows the number of UK job vacancies slid by 15% in November compared with the same month a year earlier, at a time when many employers would usually take on extra staff for Christmas.
Official figures released this month show the UK unemployment rate hit a four-year high of 5.1% in the three months to October.
Graduate jobs have seen one of the sharpest falls over the past 12 months, marking an annual slide in vacancies of almost 45%, Adzuna said. Recent reports have shown young people are being hit hard by the rise in unemployment.
The decision by companies to cut the size of their workforce by using artificial intelligence is seen as one of the reasons for the fall in vacancies in entry-level roles, three years on since the launch of ChatGPT.
However, wage growth continues to outpace inflation, Adzuna found. The average advertised salary rose by 7.7.% annually to reach £42,687 in November, with public-sector wages growing almost twice as fast as those in the private sector. Salaries in the IT sector have risen by 12.7% over the past year, making it the best-paid sector.
The yen languished near a record low to the euro on Monday, after Bank of Japan Governor Kazuo Ueda stuck to his usual cautious rhetoric following an interest rate hike on Friday.
The Japanese currency traded near an 11-month trough versus the U.S. dollar and just shy of a 17-month low on the Aussie.
A warning of possible currency intervention on Monday had little immediate effect on the market. Japan's top currency diplomat, Atsushi Mimura, said he was "concerned" about "one-sided and sharp" foreign exchange moves, and cautioned that officials "will take appropriate actions against excessive moves."
The BOJ raised the policy rate by a quarter point to a three-decade peak of 0.75% on Friday, in a clearly telegraphed move. The accompanying statement signalled a readiness to continue tightening policy, but Ueda, at his news conference, stressed the timing and pace of further hikes depended on incoming economic data.
The lack of any hawkish hints sent the yen tumbling 1.3% versus the euro, 1.4% against the greenback and 1.5% against the Aussie, even as it triggered a broad selloff in Japanese government bonds that sent the 10-year yield (JP10YTN=JBTC) - which moves inversely to the price - soaring past the symbolic 2% mark to the highest since 1999.
"While the BOJ statement noted that real yields remain 'significantly low' - potentially signalling further tightening ahead - Governor Ueda's press conference offered little new insight, reiterating a data-dependent approach," Tony Sycamore, an analyst at IG, wrote in a client note.
"The absence of clearer guidance on the pace of future hikes disappointed markets, triggering yen selling."
A decisive break above 158 yen per U.S. dollar would open the way to the high for the year from January at around 158.87, he said.
The U.S. dollar edged down 0.1% to 157.56 yenon Monday, but remained close to last month's high of 157.90.
The euro eased 0.1% to 184.51 yen, staying within touching distance of Friday's record peak at 184.75. The single currency was flat at $1.1714.
The Aussie weakened slightly to 104.20 yen, but was not far from the 104.39 yen mark reached earlier this month for the first time since July of last year. It rose 0.1% to $0.6616.
The Aussie-yen pair "still has fundamental support from solid risk sentiment and more recently, by wider interest rate differentials between Australian and Japanese ten-year government bond yields," Commonwealth Bank of Australia analysts wrote in a client note, forecasting a rise to 109 yen per Australian dollar by March.
South Korea's exports continued to expand in the first weeks of December, supported by strong semiconductor and wireless communication equipment demand, though the overall pace of gains slowed as the country faces higher tariffs from the US.
The value of shipments adjusted for differences in the number of working days increased 3.6% from a year earlier in the first 20 days of December, according to data released Monday by the customs office. That compared with a revised 13% gain reported for the full month of November.
Unadjusted shipments also gained 6.8%, while overall imports added 0.7%, resulting in a trade surplus of $3.8 billion.
Semiconductor exports climbed almost 42%, extending a recovery that's been fueled by artificial intelligence and data center demand. Shipments of wireless communication equipment also increased nearly 18%. Still, auto exports fell 13%, and petrochemicals showed weakness tied to higher input costs and US protectionist measures.
Seoul reached a landmark tariff deal with Washington in late October after three months of negotiations, capping US duties on Korean goods at 15%. Tariffs on Korean autos and auto parts were also retroactively lowered to 15% as of Nov. 1, following the publication of an official notice in the Federal Register earlier this month.
While the deal lowered duties from levels President Donald Trump announced in the spring, rates remain well above the levels the country enjoyed under a previous free trade agreement.
The trade report comes as the Korean won plunged more than 8% against the dollar so far in the second half of 2025, stoking concerns about rising inflation. Both core and headline consumer prices are now above the Bank of Korea's 2% target, and the central bank has warned that prolonged currency weakness could add further pressure on import costs.
By destination, exports to China rose 6.5%, while those to the US slipped 1.7%. Shipments to Taiwan and Vietnam climbed 9.6% and 20.4%, respectively.
Australia will require natural gas exporters to reserve as much as a quarter of new production for domestic use, as the major supplier seeks to tackle high prices and a forecast shortfall on its more populated east coast.
The policy, which is set to commence in 2027, will affect supply contracts signed from Monday and won't affect any existing agreements, Energy Minister Chris Bowen said Monday in Canberra. The final percentage to be reserved will be between 15% and 25% and finalized after a consultation next year, he said.
"From today any new contracts will be covered by the regime," Bowen said. "Gas is important to calibrate and support renewables."
Australia is the world's third-largest shipper of liquefied natural gas, but its 10 export terminals are all located in western or northern areas. Meanwhile, demand for the fossil fuel on the more populated east coast is expected to exceed supply from 2028, the Australian Energy Market Operator forecasts.
Western Australia, which has some of the biggest LNG plants but no pipeline links to the rest of the country, already requires producers to reserve as much as 15% of output for local use.
White Label
Data API
Web Plug-ins
Poster Maker
Affiliate Program
The risk of loss in trading financial instruments such as stocks, FX, commodities, futures, bonds, ETFs and crypto can be substantial. You may sustain a total loss of the funds that you deposit with your broker. Therefore, you should carefully consider whether such trading is suitable for you in light of your circumstances and financial resources.
No decision to invest should be made without thoroughly conducting due diligence by yourself or consulting with your financial advisors. Our web content might not suit you since we don't know your financial conditions and investment needs. Our financial information might have latency or contain inaccuracy, so you should be fully responsible for any of your trading and investment decisions. The company will not be responsible for your capital loss.
Without getting permission from the website, you are not allowed to copy the website's graphics, texts, or trademarks. Intellectual property rights in the content or data incorporated into this website belong to its providers and exchange merchants.
Not Logged In
Log in to access more features

FastBull Membership
Not yet
Purchase
Log In
Sign Up