• Trade
  • Markets
  • Copy
  • Contests
  • News
  • 24/7
  • Calendar
  • Q&A
  • Chats
Trending
Screeners
SYMBOL
LAST
BID
ASK
HIGH
LOW
NET CHG.
%CHG.
SPREAD
SPX
S&P 500 Index
6851.93
6851.93
6851.93
6861.30
6847.07
+24.52
+ 0.36%
--
DJI
Dow Jones Industrial Average
48620.11
48620.11
48620.11
48679.14
48557.21
+162.07
+ 0.33%
--
IXIC
NASDAQ Composite Index
23281.12
23281.12
23281.12
23345.56
23265.18
+85.96
+ 0.37%
--
USDX
US Dollar Index
97.830
97.910
97.830
98.070
97.810
-0.120
-0.12%
--
EURUSD
Euro / US Dollar
1.17554
1.17562
1.17554
1.17596
1.17262
+0.00160
+ 0.14%
--
GBPUSD
Pound Sterling / US Dollar
1.33954
1.33962
1.33954
1.33970
1.33546
+0.00247
+ 0.18%
--
XAUUSD
Gold / US Dollar
4332.76
4333.10
4332.76
4350.16
4294.68
+33.37
+ 0.78%
--
WTI
Light Sweet Crude Oil
56.901
56.931
56.901
57.601
56.789
-0.332
-0.58%
--

Community Accounts

Signal Accounts
--
Profit Accounts
--
Loss Accounts
--
View More

Become a signal provider

Sell trading signals to earn additional income

View More

Guide to Copy Trading

Get started with ease and confidence

View More

Signal Accounts for Members

All Signal Accounts

Best Return
  • Best Return
  • Best P/L
  • Best MDD
Past 1W
  • Past 1W
  • Past 1M
  • Past 1Y

All Contests

  • All
  • Trump Updates
  • Recommend
  • Stocks
  • Cryptocurrencies
  • Central Banks
  • Featured News
Top News Only
Share

The Nasdaq Golden Dragon China Index Fell 0.9% In Early Trading

Share

The S&P 500 Opened 32.78 Points Higher, Or 0.48%, At 6860.19; The Dow Jones Industrial Average Opened 136.31 Points Higher, Or 0.28%, At 48594.36; And The Nasdaq Composite Opened 134.87 Points Higher, Or 0.58%, At 23330.04

Share

Miran: Goods Inflation Could Be Settling In At A Higher Level Than Was Normal Before The Pandemic, But That Will Be More Than Offset By Housing Disinflation

Share

Miran, Who Dissented In Favor Of A Larger Cut At Last Fed Meeting, Repeats Keeping Policy Too Tight Will Lead To Job Losses

Share

Miran: Does Not Think Higher Goods Inflation Is Mostly From Tariffs, But Acknowledges Does Not Have A Full Explanation For It

Share

Toronto Stock Index .GSPTSE Rises 67.16 Points, Or 0.21 Percent, To 31594.55 At Open

Share

Miran: Excluding Housing And Non-Market Based Items, Core Pce Inflation May Be Below 2.3%, “Within Noise” Of The Fed's 2% Target

Share

Polish State Assets Minister Balczun Says Jsw Needs Over USD 830 Million Financing To Keep Liquidity For A Year

Share

Miran: Prices Are “Once Again Stable” And Monetary Policy Should Reflect That

Share

Fed's Miran: Current Excess Inflation Is Not Reflective Of Underlying Supply And Demand In The Economy

Share

Portugal Treasury Puts 2026 Net Financing Needs At 13 Billion Euros, Up From 10.8 Billion In 2025

Share

Portugal Treasury Expects 2026 Net Financing Needs At 29.4 Billion Euros, Up From 25.8 Billion In 2025

Share

Bank Of America Says With Indonesia's Smelter Now Ramping Up, It Expects Aluminium Supply Growth To Accelerate To 2.6% Year On Year In 2026

Share

Bank Of America Expects A Deficit In Aluminium Next Year And Sees Prices Pushing Above $3000/T

Share

Fed Data - USA Effective Federal Funds Rate At 3.64 Percent On 12 December On $102 Billion In Trades Versus 3.64 Percent On $99 Billion On 11 December

Share

Brazil's Petrobras Says No Impact Seen On Oil, Petroleum Products Output As Workers Start Planned Strike

Share

Statement: US Travel Group Warns New Proposed Trump Administration Requirements For Foreign Tourists To Provide Social Media Histories Could Mean Millions Of People Opting Not To Visit

Share

Blackrock: Kerry White Will Become Head Of Citi Investment Management At Citi Wealth

Share

Blackrock: Rob Jasminski, Head Of Citi Investment Management, Has Joined With Team

Share

Blackrock: Effective Dec 15, Citi Investment Management Employees Will Join Blackrock

TIME
ACT
FCST
PREV
Japan Tankan Small Manufacturing Outlook Index (Q4)

A:--

F: --

P: --

Japan Tankan Large Non-Manufacturing Outlook Index (Q4)

A:--

F: --

P: --

Japan Tankan Large Manufacturing Outlook Index (Q4)

A:--

F: --

P: --

Japan Tankan Small Manufacturing Diffusion Index (Q4)

A:--

F: --

P: --

Japan Tankan Large Manufacturing Diffusion Index (Q4)

A:--

F: --

P: --

Japan Tankan Large-Enterprise Capital Expenditure YoY (Q4)

A:--

F: --

P: --

U.K. Rightmove House Price Index YoY (Dec)

A:--

F: --

P: --

China, Mainland Industrial Output YoY (YTD) (Nov)

A:--

F: --

P: --

China, Mainland Urban Area Unemployment Rate (Nov)

A:--

F: --

P: --

Saudi Arabia CPI YoY (Nov)

A:--

F: --

P: --

Euro Zone Industrial Output YoY (Oct)

A:--

F: --

P: --

Euro Zone Industrial Output MoM (Oct)

A:--

F: --

P: --

Canada Existing Home Sales MoM (Nov)

A:--

F: --

P: --

Canada National Economic Confidence Index

A:--

F: --

P: --

Canada New Housing Starts (Nov)

A:--

F: --

P: --
U.S. NY Fed Manufacturing Employment Index (Dec)

A:--

F: --

P: --

U.S. NY Fed Manufacturing Index (Dec)

A:--

F: --

P: --

Canada Core CPI YoY (Nov)

A:--

F: --

P: --

Canada Manufacturing Unfilled Orders MoM (Oct)

A:--

F: --

P: --

U.S. NY Fed Manufacturing Prices Received Index (Dec)

A:--

F: --

P: --

U.S. NY Fed Manufacturing New Orders Index (Dec)

A:--

F: --

P: --

Canada Manufacturing New Orders MoM (Oct)

A:--

F: --

P: --

Canada Core CPI MoM (Nov)

A:--

F: --

P: --

Canada Trimmed CPI YoY (SA) (Nov)

A:--

F: --

P: --

Canada Manufacturing Inventory MoM (Oct)

A:--

F: --

P: --

Canada CPI YoY (Nov)

A:--

F: --

P: --

Canada CPI MoM (Nov)

A:--

F: --

P: --

Canada CPI YoY (SA) (Nov)

A:--

F: --

P: --

Canada Core CPI MoM (SA) (Nov)

A:--

F: --

P: --

Canada CPI MoM (SA) (Nov)

A:--

F: --

P: --

Federal Reserve Board Governor Milan delivered a speech
U.S. NAHB Housing Market Index (Dec)

--

F: --

P: --

Australia Composite PMI Prelim (Dec)

--

F: --

P: --

Australia Services PMI Prelim (Dec)

--

F: --

P: --

Australia Manufacturing PMI Prelim (Dec)

--

F: --

P: --

Japan Manufacturing PMI Prelim (SA) (Dec)

--

F: --

P: --

U.K. 3-Month ILO Employment Change (Oct)

--

F: --

P: --

U.K. Unemployment Claimant Count (Nov)

--

F: --

P: --

U.K. Unemployment Rate (Nov)

--

F: --

P: --

U.K. 3-Month ILO Unemployment Rate (Oct)

--

F: --

P: --

U.K. Average Weekly Earnings (3-Month Average, Including Bonuses) YoY (Oct)

--

F: --

P: --

U.K. Average Weekly Earnings (3-Month Average, Excluding Bonuses) YoY (Oct)

--

F: --

P: --

France Services PMI Prelim (Dec)

--

F: --

P: --

France Composite PMI Prelim (SA) (Dec)

--

F: --

P: --

France Manufacturing PMI Prelim (Dec)

--

F: --

P: --

Germany Services PMI Prelim (SA) (Dec)

--

F: --

P: --

Germany Manufacturing PMI Prelim (SA) (Dec)

--

F: --

P: --

Germany Composite PMI Prelim (SA) (Dec)

--

F: --

P: --

Euro Zone Composite PMI Prelim (SA) (Dec)

--

F: --

P: --

Euro Zone Services PMI Prelim (SA) (Dec)

--

F: --

P: --

Euro Zone Manufacturing PMI Prelim (SA) (Dec)

--

F: --

P: --

U.K. Services PMI Prelim (Dec)

--

F: --

P: --

U.K. Manufacturing PMI Prelim (Dec)

--

F: --

P: --

U.K. Composite PMI Prelim (Dec)

--

F: --

P: --

Euro Zone ZEW Economic Sentiment Index (Dec)

--

F: --

P: --

Germany ZEW Current Conditions Index (Dec)

--

F: --

P: --

Germany ZEW Economic Sentiment Index (Dec)

--

F: --

P: --

Euro Zone Trade Balance (Not SA) (Oct)

--

F: --

P: --

Euro Zone ZEW Current Conditions Index (Dec)

--

F: --

P: --

Euro Zone Trade Balance (SA) (Oct)

--

F: --

P: --

U.S. Retail Sales MoM (Excl. Automobile) (SA) (Oct)

--

F: --

P: --

Q&A with Experts
    • All
    • Chatrooms
    • Groups
    • Friends
    Connecting
    .
    .
    .
    Type here...
    Add Symbol or Code

      No matching data

      All
      Trump Updates
      Recommend
      Stocks
      Cryptocurrencies
      Central Banks
      Featured News
      • All
      • Russia-Ukraine Conflict
      • Middle East Flashpoint
      • All
      • Russia-Ukraine Conflict
      • Middle East Flashpoint
      Search
      Products

      Charts Free Forever

      Chats Q&A with Experts
      Screeners Economic Calendar Data Tools
      Membership Features
      Data Warehouse Market Trends Institutional Data Policy Rates Macro

      Market Trends

      Market Sentiment Order Book Forex Correlations

      Top Indicators

      Charts Free Forever
      Markets

      News

      News Analysis 24/7 Columns Education
      From Institutions From Analysts
      Topics Columnists

      Latest Views

      Latest Views

      Trending Topics

      Top Columnists

      Latest Update

      Signals

      Copy Rankings Latest Signals Become a signal provider AI Rating
      Contests
      Brokers

      Overview Brokers Assessment Rankings Regulators News Claims
      Broker listing Forex Brokers Comparison Tool Live Spread Comparison Scam
      Q&A Complaint Scam Alert Videos Tips to Detect Scam
      More

      Business
      Events
      Careers About Us Advertising Help Center

      White Label

      Data API

      Web Plug-ins

      Affiliate Program

      Awards Institution Evaluation IB Seminar Salon Event Exhibition
      Vietnam Thailand Singapore Dubai
      Fans Party Investment Sharing Session
      FastBull Summit BrokersView Expo
      Recent Searches
        Top Searches
          Markets
          News
          Analysis
          User
          24/7
          Economic Calendar
          Education
          Data
          • Names
          • Latest
          • Prev

          View All

          No data

          Scan to Download

          Faster Charts, Chat Faster!

          Download App
          English
          • English
          • Español
          • العربية
          • Bahasa Indonesia
          • Bahasa Melayu
          • Tiếng Việt
          • ภาษาไทย
          • Français
          • Italiano
          • Türkçe
          • Русский язык
          • 简中
          • 繁中
          Open Account
          Search
          Products
          Charts Free Forever
          Markets
          News
          Signals

          Copy Rankings Latest Signals Become a signal provider AI Rating
          Contests
          Brokers

          Overview Brokers Assessment Rankings Regulators News Claims
          Broker listing Forex Brokers Comparison Tool Live Spread Comparison Scam
          Q&A Complaint Scam Alert Videos Tips to Detect Scam
          More

          Business
          Events
          Careers About Us Advertising Help Center

          White Label

          Data API

          Web Plug-ins

          Affiliate Program

          Awards Institution Evaluation IB Seminar Salon Event Exhibition
          Vietnam Thailand Singapore Dubai
          Fans Party Investment Sharing Session
          FastBull Summit BrokersView Expo

          Oil Swings as Traders Assess Prospects for Ukraine War Truce

          Adam

          Commodity

          Summary:

          Oil prices fluctuated as traders evaluated a potential US-Russia truce in Ukraine. While a ceasefire may not ease sanctions, hopes of continued Russian oil flows eased supply concerns amid weakening demand.

          Oil swung in choppy trading as investors assessed whether a prospective deal by the US and Russia to halt the war in Ukraine would receive international support and materially affect Russian crude flows.
          West Texas Intermediate edged up about 0.5% to trade above $64 a barrel after fluctuating in a roughly $1.80 range. The US and Russia are aiming to reach a deal that would lock in Russia’s occupation of territory seized during its invasion, according to people familiar with the matter. Washington is working to get buy-in from Ukraine and its European allies on the agreement, which is far from certain.
          The US and the European Union have targeted Russia’s oil revenues in response to its invasion of Ukraine, with President Donald Trump just this week doubling levies on all Indian imports to 50% as a penalty for the nation taking Russian crude and threatening similar measures against China.
          Though investors remain skeptical that Europe would support a deal representing a major victory for Russian President Vladimir Putin, the renewed collaboration between Washington and Moscow has lifted expectations that the nation’s crude will continue to flow freely to its two biggest buyers. Still, focus has shifted to whether US sanctions on Russia — which have crimped Russia’s ability to sell oil and replenish the Kremlin’s war chest in recent months — will remain in place.
          “A possible truce would be only modestly bearish crude — assuming there is no lifting of EU and US sanctions against Russian energy — since the market does not currently price in much disruption risk,” said Bob McNally, founder of the Rapidan Energy Group and a former White House official. The proposed deal resembles a ceasefire, not a full-fledged peace agreement, he added.
          At the same time, oil traders, producers and users have proved adept in recent years at responding to supply challenges, whether they stem from conflict, geopolitical risks, or administrative hurdles such as sanctions and tariffs. Among signs of that flexibility this week were Russian Urals cargoes — from the nation’s west — being offered to Chinese buyers who don’t typically take such grades.
          Russian President Vladimir Putin is demanding that Ukraine cede its eastern Donbas area to Russia, as well as Crimea, which his forces illegally annexed in 2014. That would require Ukrainian President Volodymyr Zelenskiy to order a withdrawal of troops from parts of the Luhansk and Donetsk regions still held by Kyiv.
          Deteriorating Outlook
          The development compounded general bearishness as peak summer demand season comes to an end, with oil slumping more than 7% in August following three months of gains. Investors are braced for a potential glut later this year after OPEC+ followed through on a campaign to relax output curbs. At the same time, crude futures have been weighed down by signs of slower growth in the world’s largest economy as Trump’s wider tariffs take a toll on activity, posing a risk to energy demand.
          In another sign of deteriorating conditions, commodity trading advisers, which tend to accelerate price moves, flipped to net-short on Friday for the first time since early June, according to data from Bridgeton Research Group. The algorithmic-based traders are now sitting 36% short in WTI, compared with 18% just a day earlier, Bridgeton said. Global benchmark Brent is positioned at 27% short, compared with 9% long on Thursday, the firm said.

          Source: Bloomberg

          Risk Warnings and Disclaimers
          You understand and acknowledge that there is a high degree of risk involved in trading. Following any strategies or investment methods may lead to potential losses. The content on the site is provided by our contributors and analysts for information purposes only. You are solely responsible for determining whether any trading assets, securities, strategy, or any other product is suitable for investing based on your own investment objectives and financial situation.
          Add to Favorites
          Share

          Gold futures just hit a record high. Possible U.S. tariffs could shake metal markets up further

          Adam

          Commodity

          Gold futures hit a record high on Friday after U.S. authorities said tariffs should be imposed on some gold bars — and some strategists say there is more upside ahead for the metal.
          U.S. gold futures for December delivery touched on an all-time high of $3,534.10 on Friday morning, before climbing down to trade at around $3,495 by 10 a.m. ET.
          Spot gold, meanwhile, was little changed at around $3,400 per ounce.
          It came after a “ruling” letter from the U.S. Customs and Border Protection agency (CBP) suggested cast gold bars from Switzerland should be subjected to new import tariffs on Swiss goods. The news was first reported by the Financial Times.
          Earlier this week, U.S. President Donald Trump’s 39% “reciprocal” tariffs began to apply to Swiss goods. However there has been some confusion on whether the “reciprocal” duties apply to gold bars.
          In the July 31 letter which was a response to a Swiss gold refinery’s request for clarification on tariffs, the CBP said one-kilogram and 100-ounce gold bars should be categorized under a customs code that market watchers say will not exempt them from reciprocal tariffs.
          The CBP said in its ruling letter that the bars in question should not be classified as unwrought non-monetary gold bullion or dore — which is categorized with the Harmonized Tariff Schedule (HTS) code 7108.12.10. Instead, the agency said, the bars should be classified under the customs code 7108.13.5500.
          Switzerland, the world’s largest gold refiner, shipped 192.9 metric tons of gold to the U.S. in January.
          In a Friday note to clients, Michael Hsueh, a research analyst at Deutsche Bank, said only gold fitting the 7108.12.10 classification was exempt from U.S. tariffs. He said uncertainty on gold tariffs “re-emerged” on the back of the FT publicizing the CBP’s ruling, labeling the gold futures spike “a reprise of the importing rush” that took hold in late 2024 and earlier this year.
          Demand for gold, widely seen as a safe haven asset in times of market turbulence, has risen this year, sending prices soaring.
          The CBP’s letter also explained that in line with new U.S. Executive Orders, all imported merchandise must now be reported to customs with details of either the reciprocal tariff that applies, or details of provisions that exempt the goods from reciprocal tariffs.
          The duty rate for gold varies based on its specific characteristics and country of origin, a spokesperson for the U.S. International Trade Commission said Friday.
          In its ruling letter, the CBP told the Swiss refiner that its one-kilogram and 100-ounce bars failed to qualify in the 7108.12.10 category, as they had been stamped and needled or lasered with identifying information. They were therefore too processed to qualify as unwrought.
          Deutsche Bank’s Hsueh said in his note that while it was too early to make any final judgements on the CBP’s letter, “on the face of it the CBP ruling is applicable to [gold imported from] all countries.”
          However, Hsueh suggested there could be ways for gold exporters to skirt around U.S. tariffs.
          “The failure of tariff exemption is based on the nature of the manufactured gold bar and its HTS classification, rather than being dependent on the country of origin,” he explained, referring to the International Trade Commission’s Harmonized Tariff Schedule — the database that holds the customs codes for imported goods.
          “There is nothing in the CBP ruling which precludes the gold refiner from adjusting its operations to produce gold in a format which fits HTS code 7108.12.10, thereby qualifying for tariff exemption. This could take the form of a cast bar which is only minimally processed after the fact, or granules which are likely to also qualify as minimally processed.”
          Jitters ahead
          The new ruling on tariffs surprised the gold market, according to Joni Teves, strategist at Swiss investment bank UBS.
          “This creates an issue for the global gold market which uses Comex gold futures to hedge positions, with the assumption that it can easily import metal into Comex warehouses in the US to physically settle contracts if needed,” she said in a Friday note. “The tariff adds costs to this process, and with the bulk of refining capacity sitting in Switzerland which faces 39% US tariffs, these costs would be quite high.”
          Teves argued that until there is clarity on gold tariffs, markets were likely to “remain jittery.”
          “Historically, the vast majority of Swiss gold exports to the US have fallen under the 7108.12 (unwrought) category, which is exempted from tariffs,” she said. “On average, this tariff-exempt category accounted for ~78% of Swiss gold flows to the US.”
          Like Hseuh, UBS’ Teves suggested that the gold industry may react by changing delivery standards — this could include allowing settlement in alternative locations such as London.
          “In the long run, the existence of US tariffs on deliverable gold products raises the question on the role of futures trading in the US as a means to hedge and whether other centres eventually step up as alternatives,” Teves added. “There is still a lot of uncertainty around all this and until there is clarity, we expect the gold market and precious metals markets more generally to remain very nervous.”
          Philippe Gijsels, chief strategy officer at BNP Paribas Fortis, told CNBC on Friday that he was more bullish than ever on gold. His target price for gold is $4,000 per ounce, but he believes that the metal could even exceed this price point.
          “The news on the tariffs on gold risks creating a market dislocation like copper,” Gijsels said. “So volatility will increase, but we live more than ever in an uncertain world. In a world where the independence of the Fed lies in the balance and there are more questions about the long term sustainability of [government] debt, inflation will rise and we have to invest in real assets.”
          “I think [gold] could go still higher,” Gijsels added. “But indeed, it could be a rocky path.”
          Deutsche Bank’s Hseuh said in his note on Friday that much of the trajectory for gold depends on the intentions of the U.S. administration, which he argued remains “unclear.”
          “If their intentions are to stimulate investment in and expand domestic gold refining capacity, then they may well obstruct the ability of foreign gold refiners to meet the standards required for tariff exemption,” he said.
          “Going further, they could even remove the tariff exemption for HTS code 7108.12.10, though this seems unlikely. Either of these actions would risk creating a bifurcated gold market whereby metal circulating amongst buyers and sellers in the US becomes divorced from the volume of metal similarly circulating outside the US.”

          Source : cnbc

          Risk Warnings and Disclaimers
          You understand and acknowledge that there is a high degree of risk involved in trading. Following any strategies or investment methods may lead to potential losses. The content on the site is provided by our contributors and analysts for information purposes only. You are solely responsible for determining whether any trading assets, securities, strategy, or any other product is suitable for investing based on your own investment objectives and financial situation.
          Add to Favorites
          Share

          US And Russia Plan Ukraine Truce Deal To Cement Putin’s Gains

          Devin

          Political

          Washington and Moscow are understood to be aiming to reach a deal to halt the war in Ukraine that would lock in Russia’s occupation of territory seized during its military invasion.

          US and Russian officials are working toward an agreement on territories for a planned summit meeting between Presidents Donald Trump and Vladimir Putin as early as next week, people familiar said.Putin is demanding that Ukraine cede its entire eastern Donbas area to Russia as well as Crimea, which his forces illegally annexed in 2014. Any deal on those terms would hand Russia a victory that its army couldn’t achieve militarily since the start of the full-scale invasion.

          Such an outcome would represent a major win for Putin, who has long sought direct negotiations with the US on terms for ending the war that he started, sidelining Ukraine and its European allies. Ukrainian President Volodymyr Zelenskiy risks being presented with a take-it-or-leave-it deal to accept the loss of Ukrainian territory.

          Trump said yesterday that he’d be willing to meet with Putin, even if the Russian leader hadn’t agreed to also sit down with Zelenskiy, apparently overriding earlier suggestions of a trilateral meeting.

          Germany will halt deliveries to Israel of military equipment that could be used in operations in the Gaza Strip over concern for humanitarian suffering in the territory. The ban on deliveries of spare parts for tanks and other defense-related goods will be in place until further notice, Chancellor Friedrich Merz said today in a statement. The move was prompted by Israeli Prime Minister Benjamin Netanyahu’s move to secure approval for a military takeover of Gaza City.

          Bank of England Chief Economist Huw Pill warned the central bank may need to slow its once-a-quarter pace of interest-rate cuts after a resurgence in inflation that risks changing the behavior of households and businesses. Pill — who opposed the BOE’s closely contested decision yesterday to cut rates by a quarter point — said a spike in price pressures may linger for longer than expected, pointing to the impact on household expectations from climbing food bills.

          China said its imports of Russian oil are justified, pushing back against US threats of new tariffs after Washington slapped secondary levies on India for buying energy from Moscow. “It is legitimate and lawful for China to conduct normal economic, trade and energy cooperation with all countries around the world, including Russia,” the Chinese Foreign Ministry said Friday in a statement to Bloomberg News. Trump said earlier this week he could punish China with additional tariffs over its purchases of Russian oil.

          Trade tariffs are adding to challenges facing the Irish whiskey industry, a sector already beset by oversupply, faltering US demand and soaring costs. A clutch of independent distilleries have closed or cut production in recent months, while giants like Diageo and Pernod Ricard are also impacted. The Killarney Brewing & Distilling closed down last month, the latest casualty of the reversal of a short-lived boom for the industry.

          Aircraft maker Pilatus Flugzeugwerke has stopped deliveries to the US one day after the 39% tariff rate on Switzerland went into effect. Trump’s surprise decision has roiled local manufacturers. “Massive additional costs” and the resulting competitive disadvantages with US and European competitors are causing increasing uncertainty among customers, the maker of the PC-12 single-engine utility plane and PC-24 10-passenger business jet said in a statement. That led the company to temporarily interrupt its US business, the statement said. Pilatus said it would work with clients to send the planes to other markets.

          Zimbabwe and the UK are rekindling diplomatic ties after almost three decades of tensions, driven by a global surge in demand for critical minerals. The former colonial power is pursuing $1 billion in deals with the resource-rich nation. The British Embassy in Harare said those prospective deals are across key sectors such as agriculture, finance, telecommunications, renewable energy and critical minerals.

          Source: Bloomberg Europe

          Risk Warnings and Disclaimers
          You understand and acknowledge that there is a high degree of risk involved in trading. Following any strategies or investment methods may lead to potential losses. The content on the site is provided by our contributors and analysts for information purposes only. You are solely responsible for determining whether any trading assets, securities, strategy, or any other product is suitable for investing based on your own investment objectives and financial situation.
          Add to Favorites
          Share

          Is revaluation of central bank gold reserves the answer? Federal Reserve economist analyzes five cases and their impacts

          Adam

          Commodity

          The track record of revaluing gold reserves to address monetary or fiscal challenges is mixed, with the countries that needed it the most seeing the least sustained impact while the countries that used it most judiciously didn’t need it at all, according to new research by Colin Weiss, principal economist for global financial flows at the Federal Reserve.
          “With public debt at high levels, some governments have begun to explore financing additional expenditures without raising taxes while also not increasing public debt outstanding,” he wrote in ‘Official Reserve Revaluations: The International Experience’ on August 1. “One possibility is using proceeds from valuation gains on gold reserves, as has been floated in the U.S. and Belgium recently. For the U.S., this would involve revaluing the government's 261.5 million troy ounces in gold reserves—the largest gold reserves globally— from a statutory price of $42.22 per troy ounce to current market prices, which stand around $3300 per troy ounce.”
          In the research note, Weiss reviews the handful of cases where countries revalued their gold and foreign exchange reserves to realize gains. “Over the past 30 years, only five countries have done so—Germany, Italy, Lebanon, Curacao and Saint Martin, and South Africa,” he noted. “What motivated the governments in these countries to use the proceeds from valuation changes in their official reserves? How were the revaluations implemented, and what were the outcomes?”
          Weiss said the proceeds from these revaluations were “either used by the central bank, as in the cases of Italy and Curacao and Saint Martin, or by the central government, as in South Africa, Lebanon, and Germany.”
          “Central banks have used revaluation proceeds to offset operating losses and maintain net profits or minimize reported net losses,” he wrote. “In Italy, revaluation proceeds covered a one-off loss for the conversion of a specific bond the Banca d'Italia owned. In Curacao and Saint Martin, the proceeds covered losses generated by a fall in interest income from holding relatively lower-yielding securities than previous years and realized valuation losses as the central bank rebalanced its portfolio. The use of revaluation proceeds temporarily boosted profits for both central banks, but, in Curacao and Saint Martin, the use was paired with other measures to generate additional income on a sustained basis.”
          Central governments, for their part, used the proceeds gained from revaluation “to retire existing debts, often in exceptional fiscal circumstances. While reducing the debt stock using revaluation proceeds improves the fiscal situation at the margin, drawing on revaluation proceeds may not address larger structural challenges. For example, Lebanon's debt-to-GDP ratio continued to increase even after revaluation proceeds were used to retire some existing debts.”
          Weiss pointed out that central banks have different ways of valuing their existing bullion holdings. “Some value their gold reserves at their historic cost; others report it at current market prices,” he said. “When central banks report their holdings at current market prices (fair value), the unrealized profits or losses from valuation changes are recorded in ‘revaluation accounts’ on the liability side of the balance sheet.”
          “When gold is valued at historic cost (or modified historic cost), gold reserves can be revalued at market prices (or values closer to market prices) to generate revenues,” he noted. “When all official reserves are valued at market prices the unrealized valuation changes recorded in the revaluation account can be shifted to other parts of the balance sheet to generate funds.”
          Weiss said that using revaluation of gold reserves as a funding source “is particularly salient because most gold reserves globally were acquired prior to 1990, and as shown in Figure 1, gold prices have climbed substantially since then.”
          Is revaluation of central bank gold reserves the answer? Federal Reserve economist analyzes five cases and their impacts_1
          The first category includes cases with gold reserves valued at their historic cost with the central government as the end user. “Table 1a shows the initial change to the central bank's balance sheet due to a revaluation that increases the reported value of the gold reserves by X: assets increase by X due to the change in the valuation, while liabilities also increase by X as the valuation gains are distributed to the central government's account with the central bank,” he said. “As the central government uses these new funds, the composition of the liability increase will shift from the government's account to commercial bank reserves held at the central bank (not shown in the figure).”
          The second broad category includes those cases where gold reserves are reported at fair value and the funds listed in revaluation accounts are then transferred to the central government. “Table 1b shows this example for a transfer of size Y,” Weiss wrote. “In this case, only the composition of the central bank's liabilities changes: revaluation accounts decrease by Y while the central government's account with the central bank increases by Y. Again, as with the previous case, commercial bank reserves at the central bank will increase as the central government uses its new funds.”
          The final revaluation category involves the case where gold reserves are reported at fair value and the central bank uses its revaluation accounts to offset operating losses in other areas. “Table 1c displays this for a transfer of size Z,” he said. “Here, as with the previous example where revaluation accounts were used, only the composition of the central bank's liabilities changes. In this case revaluation accounts decrease by Z while net profits increase by Z.”
          Is revaluation of central bank gold reserves the answer? Federal Reserve economist analyzes five cases and their impacts_2
          In Figure 2, Weiss plots the revaluation proceeds as a share of GDP in the year the appreciation was realized for each of the five examples. “The bars shaded green denote cases where the end-user was the central bank, while bars shaded blue mark examples where the central government sought to use revaluation proceeds,” he wrote. “Except for the German case, the transfers when the end-user is the central government are larger than the proceeds used by the central bank. For comparison, the inset note reports the potential revaluation amount as a share of GDP for the U.S.”
          Is revaluation of central bank gold reserves the answer? Federal Reserve economist analyzes five cases and their impacts_3
          Weiss then provides a historical overview of the context of each revaluation case, and their political and economic outcomes for the countries in question.
          The first example of gold revaluation with the central bank as the beneficiary was that of Curacao and Saint Martin, which “involved about 8 percent of the CBCS's gold reserves and was equivalent to about 0.6 percent of the 2021 and 2022 GDP of Curacao and Saint Martin, relatively modest amounts compared to other cases and leaving plenty of scope for additional use of the revaluation accounts.” He noted that the central bank “appears to have used its gold revaluation accounts to help offset losses in a couple years, but it relied on other means to generate a more permanent increase in income.”
          The other case of revaluation where the proceeds were used by the central bank was in Italy at the beginning of the century. “In 2002, the Banca d'Italia transferred €13 billion from its gold revaluation accounts, or about half of the 2001 value of the account, to help cover losses,” Weiss wrote. “The transfer was equal in size to about 1 percent of Italy's 2002 GDP, as seen in Figure 2, placing it on the smaller side of the examples discussed in this note. Against the objective of helping the central bank avoiding reporting overall net losses, this use of revaluation account proceeds, was quite successful, as the Banca d'Italia reported a small net profit in 2002.”
          The most recent case, and the first example in the report of revaluation for use by a central government, occurred in South Africa in 2024. “Specifically, the National Treasury and the South African Reserve Bank agreed to use R150 billion of the valuation gains recorded in the ‘Gold and Foreign Exchange Contingency Reserve Account’ (about 30 percent of the total valuation gains in the account) between 2024 and 2027 to ‘reduce borrowing, and consequently the growth in debt-service costs,’” he wrote. “This transfer is equivalent to about 2 percent of South Africa's 2023 GDP, which, as shown in Figure 2, places it in the middle of the size distribution of the actual and proposed revaluations studied in this note.”
          Weiss noted that because “South Africa's use of revaluation account proceeds is ongoing, it is too soon to assess whether their use helped place fiscal policy on a more sustainable path.”
          Another example of a central bank transferring unrealized profits on its gold and foreign exchange reserves to the central government occurred in Lebanon in December 2002, where the proceeds were used to retire $1.8 billion of treasury bills. “This was equivalent to around 11 percent of Lebanon's 2002 GDP, making it the largest use of revaluation proceeds (in domestic GDP terms),” he said.
          Weiss noted that the relatively large size of this operation “likely reflected Lebanon's extremely difficult fiscal situation at the time,” as the country’s interest payments on its post-Civil War reconstruction debt “consumed 91 percent of government revenues by 1997.”
          He noted that “Lebanon's debt to GDP ratio continued to increase after 2002,” and said that “the Lebanese experience again highlights that while gold revaluations can provide funds for the government, their ability to offset larger structural challenges can be limited.”
          The final example is that of Germany – holder of the second-largest sovereign gold reserves after the United States.
          “In 1997, German chancellor Helmut Kohl and finance minister Theo Waigel proposed a revaluation of Germany's gold and foreign exchange reserves with DM20 billion of the revaluation gains to be used to offset deficits elsewhere in the German budget,” Weiss wrote. “The Bundesbank valued its gold reserves at historic purchase prices that were significantly below the prevailing market prices in 1997. With the creation of the euro and the European Central Bank (ECB) in 1999, the Bundesbank was going to have [to] transfer at least a portion of its international reserves to the ECB. The ECB planned to value reserves at current market prices and record valuation changes in its own revaluation account, meaning that the Bundesbank would be transferring unrealized valuation gains on its gold reserves to the ECB.”
          “Kohl and Waigel planned to revalue the reserves prior to their transfer to the ECB and use a portion of the revaluation gains equivalent to 0.5 percent of 1997 German GDP to help shore up the government's budget,” he wrote, a move that was necessary “because the level of the deficit was projected to violate the threshold set in the Maastricht treaty.”
          After a period of parliamentary wrangling, “a compromise was reached where German official reserves were revalued in 1997, but the funds that were originally to be used to cover the fiscal deficit in 1997 were not distributed until 1998,” Weiss noted. “In the end, the German fiscal deficit in 1997 satisfied the Maastricht criteria even without the proceeds from the revaluation.”
          While he doesn’t offer a conclusion or attempt to draw any broad lessons from the five very different cases, the data appear to show that the revaluation of even a significant portion of a country’s gold reserves delivers only a one-time boost to the balance sheet of either the central bank or the central government, and the move cannot address a significant portion of even one years’ worth of fiscal issues.
          As Weiss points out in the notes for Figure 2, “Potential proceeds from a revaluation of U.S. gold reserves at current market prices would equal about 3 percent of U.S. GDP.” This means that the strongest economy in the world, liquidating 100% of the largest gold stockpile in the world, at the highest nominal price in history, would gain the equivalent of 3% of this year’s GDP.

          Source: kitco

          Risk Warnings and Disclaimers
          You understand and acknowledge that there is a high degree of risk involved in trading. Following any strategies or investment methods may lead to potential losses. The content on the site is provided by our contributors and analysts for information purposes only. You are solely responsible for determining whether any trading assets, securities, strategy, or any other product is suitable for investing based on your own investment objectives and financial situation.
          Add to Favorites
          Share

          Gold Is Trading At Record High Levels—These Are The Key Price Levels To Watch

          Thomas

          Commodity

          Source: TradingView.com

          Source: TradingView.com

          Gold (XAUUSD) prices have rallied over the past week and are near record-high levels after a wave of profit-taking in late July.

          Investors have bid up the precious metal amid uncertainty over the outlook for the U.S. economy and expectations that the Federal Reserve will cut interest rates in September, following July’s weaker-than-expected employment report released last Friday. Gold tends to benefit from its reputation as a safe-haven asset during times of economic uncertainty, while lower rates also support the non-yielding asset. Reports that the U.S. will impose tariffs on imports of gold bars have also underpinned gains this week.

          The commodity has soared about 30% this year, boosted by concerns over the Trump administration’s unpredictable trade policies—amid uncertainty about how tariffs will affect the economy—and ongoing tensions in the Middle East. Spot gold was trading at just under $3,400 per troy ounce recently.

          Below, we take a closer look at the spot gold price chart and use technical analysis to identify key levels that investors will likely be watching.

          Bullish Ascending Triangle Takes Shape

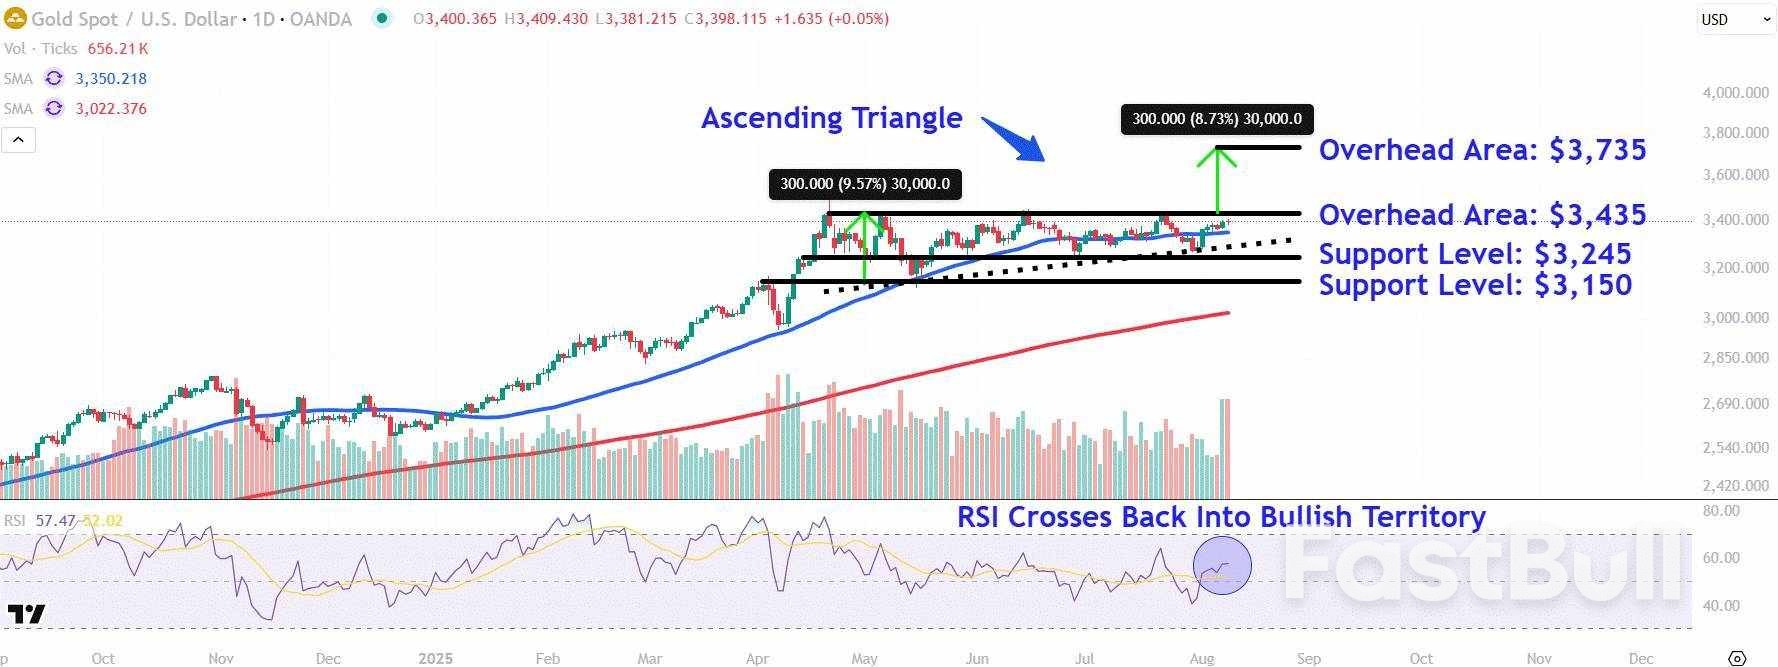
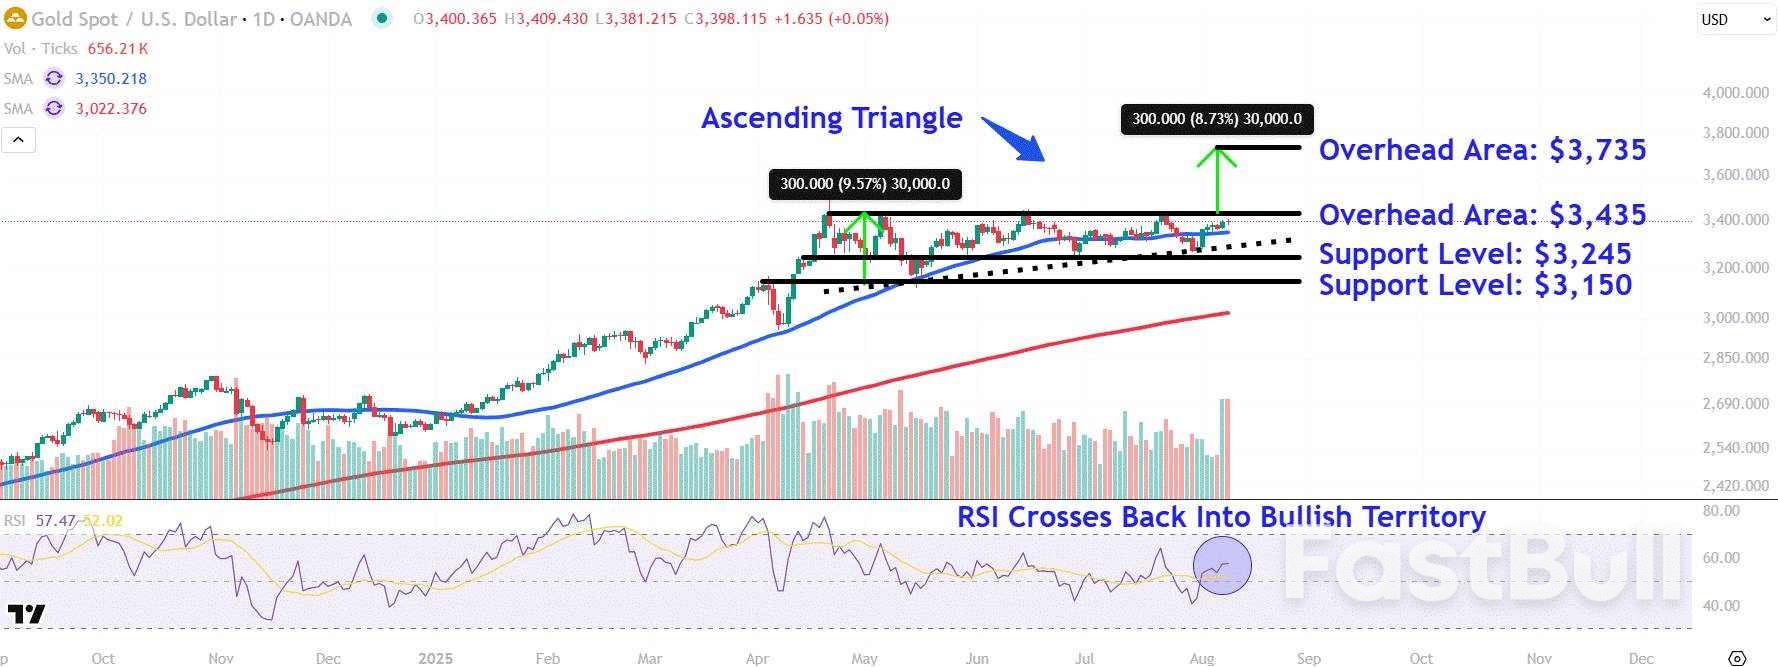
          Since a shooting star pattern marked gold’s high in late April, the commodity has consolidated in an ascending triangle, a bullish chart formation that signals a potential continuation of the longer-term uptrend.

          More recently, the price has rallied from the triangle’s lower trendline and reclaimed the respected 50-day moving average (MA), a move that has coincided with the relative strength index crossing back into bullish territory.

          Let’s identify two key overhead areas to watch on gold's chart if the recent upward momentum continues and also point out major support levels worth monitoring during possible retracements.

          Key Overhead Areas to Watch

          The first overhead area to watch sits around $3,435. This location on the chart would likely provide significant resistance near four distinct peaks that form the ascending triangle’s top trendline.

          Investors can forecast a bullish price target above gold’s all-time high by using the measured move technique, a tool that analyzes chart patterns to project future price movements. When applying this analysis, we calculate the distance of the ascending triangle near its widest section and add that amount to the pattern’s top trendline. For instance, we add $300 to $3,435, which projects a target of $3,735, about 10% above the commodity’s current trading levels.

          Source: Yahoo Finance

          Risk Warnings and Disclaimers
          You understand and acknowledge that there is a high degree of risk involved in trading. Following any strategies or investment methods may lead to potential losses. The content on the site is provided by our contributors and analysts for information purposes only. You are solely responsible for determining whether any trading assets, securities, strategy, or any other product is suitable for investing based on your own investment objectives and financial situation.
          Add to Favorites
          Share

          What Is Value At Risk, And How Do Traders Use It In Trading?

          FXOpen

          Cryptocurrency

          Forex

          Stocks

          What Does VaR Stand For?

          So what is Value at Risk? Value at Risk, abbreviated to VaR, is a statistical measure used to estimate how much a trader, portfolio, or institution could lose over a set period under normal market conditions. It provides a single risk figure, making comparison of different assets, portfolios, or strategies more straightforward.

          VaR is defined by three key components:

          ● Time Horizon – The period over which the potential loss is measured, such as one day, week, or month.
          ● Confidence Level – Expressed as a percentage, typically 95% or 99%, indicating the probability that losses will not exceed the calculated VaR amount.
          ● Potential Loss – The estimated maximum amount or percentage that could be lost within the given timeframe, based on historical or simulated market movements.

          For example, if a portfolio’s Value at Risk has a one-day 95% risk estimate of £10,000, it means that under normal conditions, there is a 95% chance that losses won’t exceed £10,000 in a single day. However, the remaining 5% represents extreme events where losses could be greater.

          VaR is widely used in trading, portfolio management, and regulatory frameworks because it quantifies risk in monetary terms. It helps traders set position limits, assess exposure, and compare risk across different assets. However, while VaR is useful, it does not account for rare but extreme losses, which is why it’s often combined with other risk measures.

          How Value at Risk Is Calculated

          There are three main ways to calculate VaR, each with its own approach to estimating potential losses: the historical method, the variance-covariance method, and the Monte Carlo simulation. Each method has strengths and weaknesses, and traders often use a combination to cross-check risk assessments.

          1. Historical Method

          This approach looks at past market data to estimate future risk. It takes the historical returns of an asset or portfolio over a given period—say, the last 250 trading days—and ranks them from worst to best. The VaR is then set at the percentile corresponding to the chosen confidence level.For example, in a 95% confidence level VaR calculation using 250 days of data, the worst 5% (12.5 worst days) would indicate the expected loss threshold. If the 13th worst loss was £8,000, that would be the VaR estimate. This method is simple and doesn’t assume a normal distribution, but it relies on past data, which may not capture extreme events.

          2. Variance-Covariance Method

          The Variance-Covariance (VCV) method assumes that potential returns follow a normal distribution and estimates risk using standard deviation (volatility).One of the main advantages of the VCV method is its simplicity and efficiency, particularly for portfolios with multiple assets. However, its accuracy depends on the assumption that potential returns are normally distributed, which may not always hold, especially during extreme market conditions.

          3. Monte Carlo Simulation

          Monte Carlo simulations generate thousands of hypothetical market scenarios based on random price movements. It models different potential outcomes by simulating how prices might evolve based on past volatility and correlations. The resulting dataset is then analysed to determine the percentile-based VaR estimate.This method is more flexible and can handle complex portfolios but is computationally intensive and requires strong assumptions about price behaviour.

          How Traders Use Value at Risk in Trading

          Traders use Value-at-Risk models to measure potential losses, manage exposure, and make decisions about position sizing. Since VaR quantifies risk in monetary terms, it provides a clear benchmark for setting risk limits on individual trades or entire portfolios.One of the most practical applications of VaR is in position sizing. A trader managing a £500,000 portfolio might have a risk tolerance of 1% per trade, meaning they are comfortable with a potential £5,000 loss per trade. By calculating VaR, they can assess whether a given trade aligns with this limit and adjust the position size accordingly.

          Hedge funds, proprietary trading firms, and institutional investors use VaR to allocate capital efficiently. If two trades have the same expected returns but one has a higher VaR, a trader may adjust exposure to avoid exceeding risk limits. Large institutions also use portfolio-wide VaR to monitor overall exposure and assess whether they need to hedge positions.

          Another key use is stress testing. Traders often compare historical VaR to actual market moves, especially during volatile periods, to gauge whether their risk model holds up. If markets experience larger-than-expected losses, traders may refine their approach by incorporating additional risk measures like Conditional VaR (CVaR) or adjusting exposure to tail risks.Ultimately, VaR is a risk filter—it doesn’t dictate decisions but helps traders identify when exposure might be higher than expected, so they can adjust accordingly.

          Strengths and Limitations of VaR

          Value at Risk is widely used in trading and portfolio management because it provides a single, quantifiable measure of potential loss. However, while it’s useful for assessing risk, it has limitations that traders need to be aware of.

          Strengths of VaR

          ● Straightforward risk measure: VaR condenses complex risk exposure into a single number, making comparison of different assets and strategies more straightforward.
          ● Applicable across asset classes: It works for stocks, forex, commodities, and fixed income, allowing traders to standardise risk assessment across different markets.
          ● Useful for position sizing: Traders can align their risk limits with VaR calculations to try keeping exposure within predefined boundaries.
          ● Regulatory and institutional use: Banks and hedge funds use VaR to comply with risk management regulations.

          Limitations of VaR

          ● Does not account for extreme losses: VaR shows the potential loss up to a given confidence level but does not measure tail risk—severe market events beyond that threshold.
          ● Assumes normal market conditions: Some VaR methods rely on historical data or normal distribution assumptions, which may not hold during volatile periods or financial crises.
          ● Sensitive to calculation method: Different approaches (historical, variance-covariance, Monte Carlo) can produce different VaR figures, leading to inconsistencies in risk estimation.
          ● Past data may not reflect future risks: Markets evolve and historical price patterns may not always be reliable indicators of future behaviour.

          Because of these limitations, traders often combine VaR with other risk measures, such as Conditional VaR (CVaR), drawdowns, and volatility analysis, for a more comprehensive risk assessment.

          Real-World Examples of VaR in Financial Markets

          Value at Risk is used by traders, hedge funds, and financial institutions to assess market exposure and manage risk. It plays a key role in everything from daily trading operations to large-scale regulatory compliance.

          J.P. Morgan and the Birth of VaR

          VaR gained prominence in the 1990s when J.P. Morgan developed its RiskMetrics system, which set a standard for institutional risk measurement. The firm used VaR to estimate potential losses across its trading desks, providing a consistent risk measure for its global operations. This approach became so influential that it was later adopted by regulators and central banks.

          Long-Term Capital Management (LTCM) – A VaR Misstep

          It’s believed that the reliance of the hedge fund Long-Term Capital Management (LTCM) on VaR to manage its highly leveraged positions in the late 1990s led to the fund’s collapse. While its models suggested limited downside risk, LTCM’s reliance on normal market conditions led to catastrophic losses when a position in Russian debt unravelled. The fund’s VaR calculations underestimated extreme market moves, contributing to a collapse that required a $3.6 billion bailout from major banks.

          Goldman Sachs During the 2008 Crisis

          During the 2008 financial crisis, Goldman Sachs relied on VaR to monitor trading risk. At the peak of market volatility in late 2008, its daily VaR jumped significantly, highlighting the increased risk in its portfolio. The firm adjusted exposure accordingly, reducing positions in high-risk assets to manage potential losses.

          FAQ

          What Is VaR?

          The Value at Risk, or VaR, meaning refers to a statistical measure used to estimate the potential loss of an asset, portfolio, or trading strategy over a specific timeframe with a given confidence level. It helps traders and institutions assess market exposure and manage risk.

          What Does VaR Mean in Trading?

          In trading, VaR quantifies the potential downside of a position or portfolio. It provides a single number that represents the maximum expected loss over a set period, such as one day or one week, under normal market conditions.

          How to Calculate Value at Risk?

          VaR is typically calculated using three methods: historical simulation, which uses past market data; the variance-covariance method, which assumes a normal distribution of potential returns; and Monte Carlo simulation, which generates potential future price movements to estimate risk.

          What Is a VaR Strategy?

          A VaR strategy involves using VaR to set position limits, manage exposure, and allocate capital efficiently. Traders and institutions often integrate VaR into broader risk management frameworks to balance potential risk and returns.

          What Does 95% VaR Mean?

          A 95% VaR means there is a 95% probability that losses will not exceed the calculated VaR amount over the chosen period. The remaining 5% represents extreme market events where losses could be higher.

          Source: FXOpen

          Risk Warnings and Disclaimers
          You understand and acknowledge that there is a high degree of risk involved in trading. Following any strategies or investment methods may lead to potential losses. The content on the site is provided by our contributors and analysts for information purposes only. You are solely responsible for determining whether any trading assets, securities, strategy, or any other product is suitable for investing based on your own investment objectives and financial situation.
          Add to Favorites
          Share

          J.P.Morgan brings forward Fed rate cut forecast to September

          Adam

          Economic

          J.P.Morgan now expects the U.S. Federal Reserve to cut interest rates by 25 basis points at its September meeting, citing signs of weakness in the labor market and uncertainty around President Donald Trump's latest Fed nomination.
          The brokerage had earlier forecast one 25 basis point rate cut in December but said in a note on Thursday that the risks now point to an earlier move, followed by three more quarter-point cuts before the Fed pauses.
          "For Powell, the risk management considerations at the next meeting may go beyond balancing employment and inflation risks," J.P.Morgan analyst Michael Feroli wrote.
          Trump on Thursday nominated Stephen Miran, Chair of the Council of Economic Advisers, to fill a temporary seat on the Fed Board, replacing outgoing Governor Adriana Kugler.
          Miran's confirmation before the September 16–17 policy meeting remains uncertain, but JPM said his presence could increase divisions within the rate-setting committee.
          The move follows months of Trump pressuring the Fed to cut rates, often clashing with Chair Jerome Powell over keeping policy tight. "In the off chance Miran is governor by the time of the next meeting, that could imply three dissents. That’s a lot of dissents," Feroli said.
          The Fed's decision may hinge on August jobs data. JPM said an unemployment rate of 4.4% or higher could justify a larger cut, while a lower reading may prompt resistance from policymakers focused on inflation.
          Separately, the JPM note said that Fed Governor Christopher Waller is emerging as the frontrunner to succeed Jerome Powell as Fed Chair, a move it said would likely be welcomed by financial markets.
          Analysts at Barclays echoed the sentiment, saying Waller's appointment would reduce uncertainty around how the Fed responds to economic data, which could support longer-dated bonds.
          Traders now price in a 91.4% chance of a rate cut in September, compared with 37.7% last week, according to CME Group's FedWatch tool.

          Source: Reuters

          To stay updated on all economic events of today, please check out our Economic calendar
          Risk Warnings and Disclaimers
          You understand and acknowledge that there is a high degree of risk involved in trading. Following any strategies or investment methods may lead to potential losses. The content on the site is provided by our contributors and analysts for information purposes only. You are solely responsible for determining whether any trading assets, securities, strategy, or any other product is suitable for investing based on your own investment objectives and financial situation.
          Add to Favorites
          Share
          FastBull
          Copyright © 2025 FastBull Ltd

          728 RM B 7/F GEE LOK IND BLDG NO 34 HUNG TO RD KWUN TONG KLN HONG KONG

          TelegramInstagramTwitterfacebooklinkedin
          App Store Google Play Google Play
          Products
          Charts

          Chats

          Q&A with Experts
          Screeners
          Economic Calendar
          Data
          Tools
          Membership
          Features
          Function
          Markets
          Copy Trading
          Latest Signals
          Contests
          News
          Analysis
          24/7
          Columns
          Education
          Company
          Careers
          About Us
          Contact Us
          Advertising
          Help Center
          Feedback
          User Agreement
          Privacy Policy
          Business

          White Label

          Data API

          Web Plug-ins

          Poster Maker

          Affiliate Program

          Risk Disclosure

          The risk of loss in trading financial instruments such as stocks, FX, commodities, futures, bonds, ETFs and crypto can be substantial. You may sustain a total loss of the funds that you deposit with your broker. Therefore, you should carefully consider whether such trading is suitable for you in light of your circumstances and financial resources.

          No decision to invest should be made without thoroughly conducting due diligence by yourself or consulting with your financial advisors. Our web content might not suit you since we don't know your financial conditions and investment needs. Our financial information might have latency or contain inaccuracy, so you should be fully responsible for any of your trading and investment decisions. The company will not be responsible for your capital loss.

          Without getting permission from the website, you are not allowed to copy the website's graphics, texts, or trademarks. Intellectual property rights in the content or data incorporated into this website belong to its providers and exchange merchants.

          Not Logged In

          Log in to access more features

          FastBull Membership

          Not yet

          Purchase

          Become a signal provider
          Help Center
          Customer Service
          Dark Mode
          Price Up/Down Colors

          Log In

          Sign Up

          Position
          Layout
          Fullscreen
          Default to Chart
          The chart page opens by default when you visit fastbull.com