- USDX
- XAUUSD
- XAGUSD
- WTI


Markets
Analysis
User
24/7
Economic Calendar
Education
Data
- Names
- Latest
- Prev


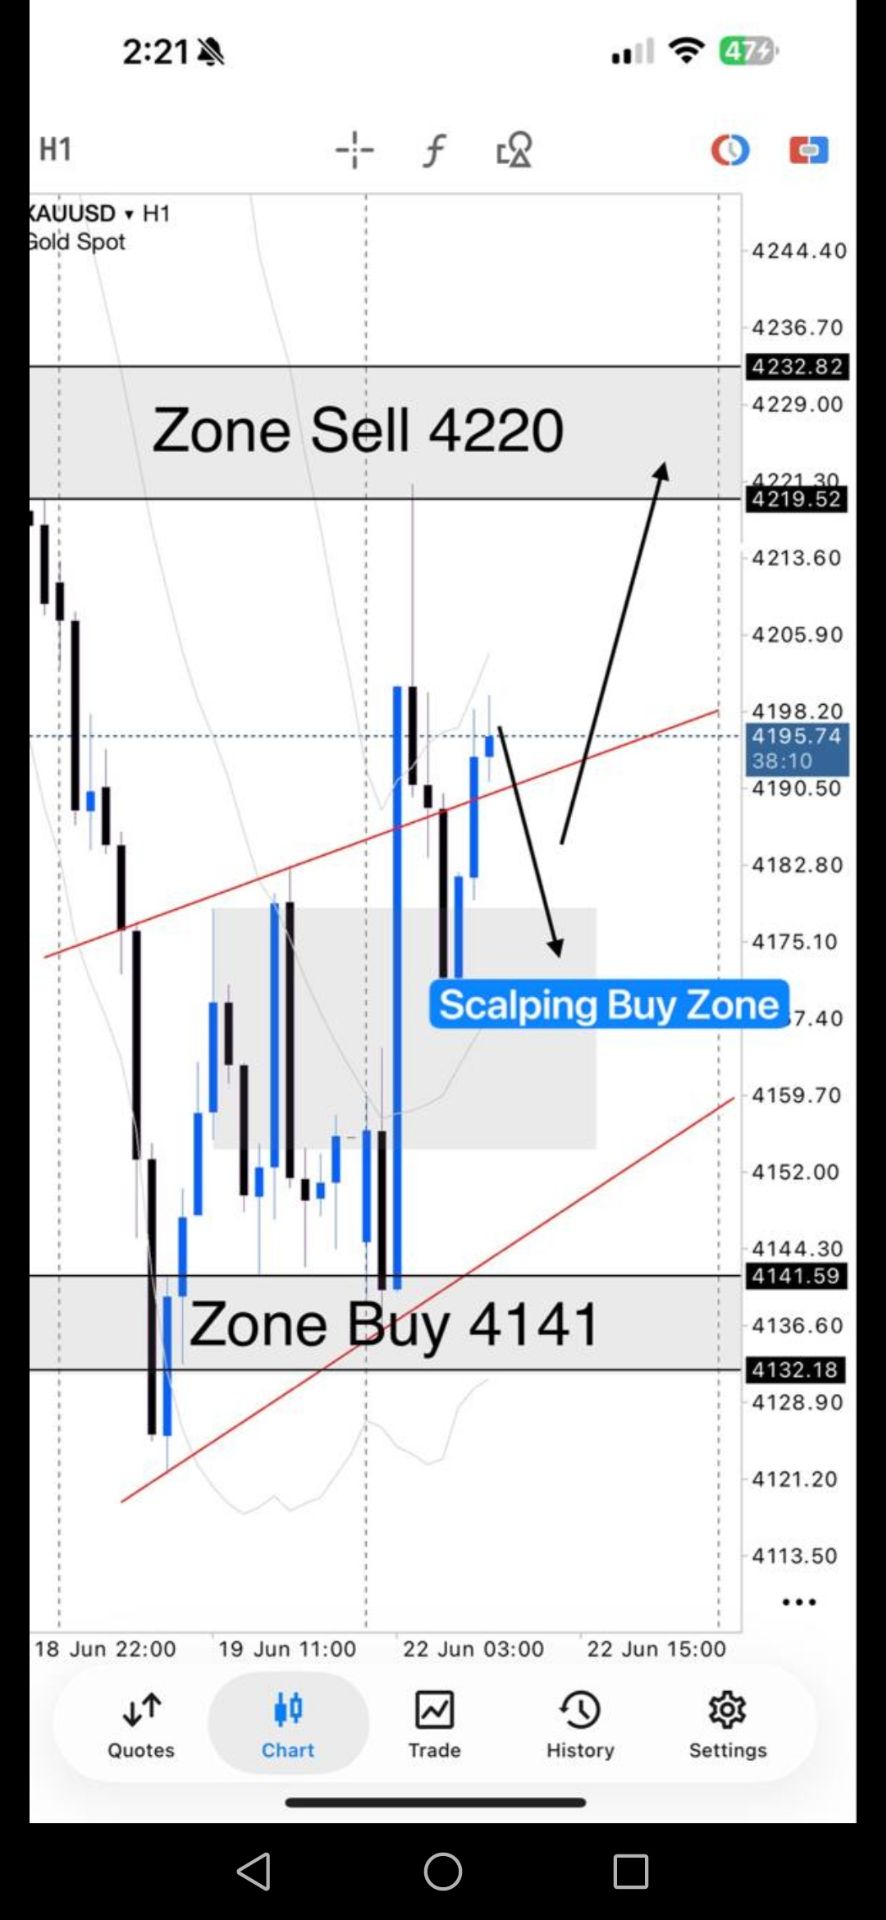

This article breaks down the wave-based progression of Gold’s rally, evaluates whether the market is entering a terminal phase or another expansion leg, and outlines key levels and behaviours traders should monitor going forward.
 Gold’s rally since 2024 has followed a textbook expansion–consolidation rhythm. Each impulse wave has been respected by the market, and each pause has strengthened the overall structure.
728 RM B 7/F GEE LOK IND BLDG NO 34 HUNG TO RD KWUN TONG KLN HONG KONG


The risk of loss in trading financial instruments such as stocks, FX, commodities, futures, bonds, ETFs and crypto can be substantial. You may sustain a total loss of the funds that you deposit with your broker. Therefore, you should carefully consider whether such trading is suitable for you in light of your circumstances and financial resources.
No decision to invest should be made without thoroughly conducting due diligence by yourself or consulting with your financial advisors. Our web content might not suit you since we don't know your financial conditions and investment needs. Our financial information might have latency or contain inaccuracy, so you should be fully responsible for any of your trading and investment decisions. The company will not be responsible for your capital loss.
Without getting permission from the website, you are not allowed to copy the website's graphics, texts, or trademarks. Intellectual property rights in the content or data incorporated into this website belong to its providers and exchange merchants.
Not Logged In
Log in to access more features


Log In
Sign Up