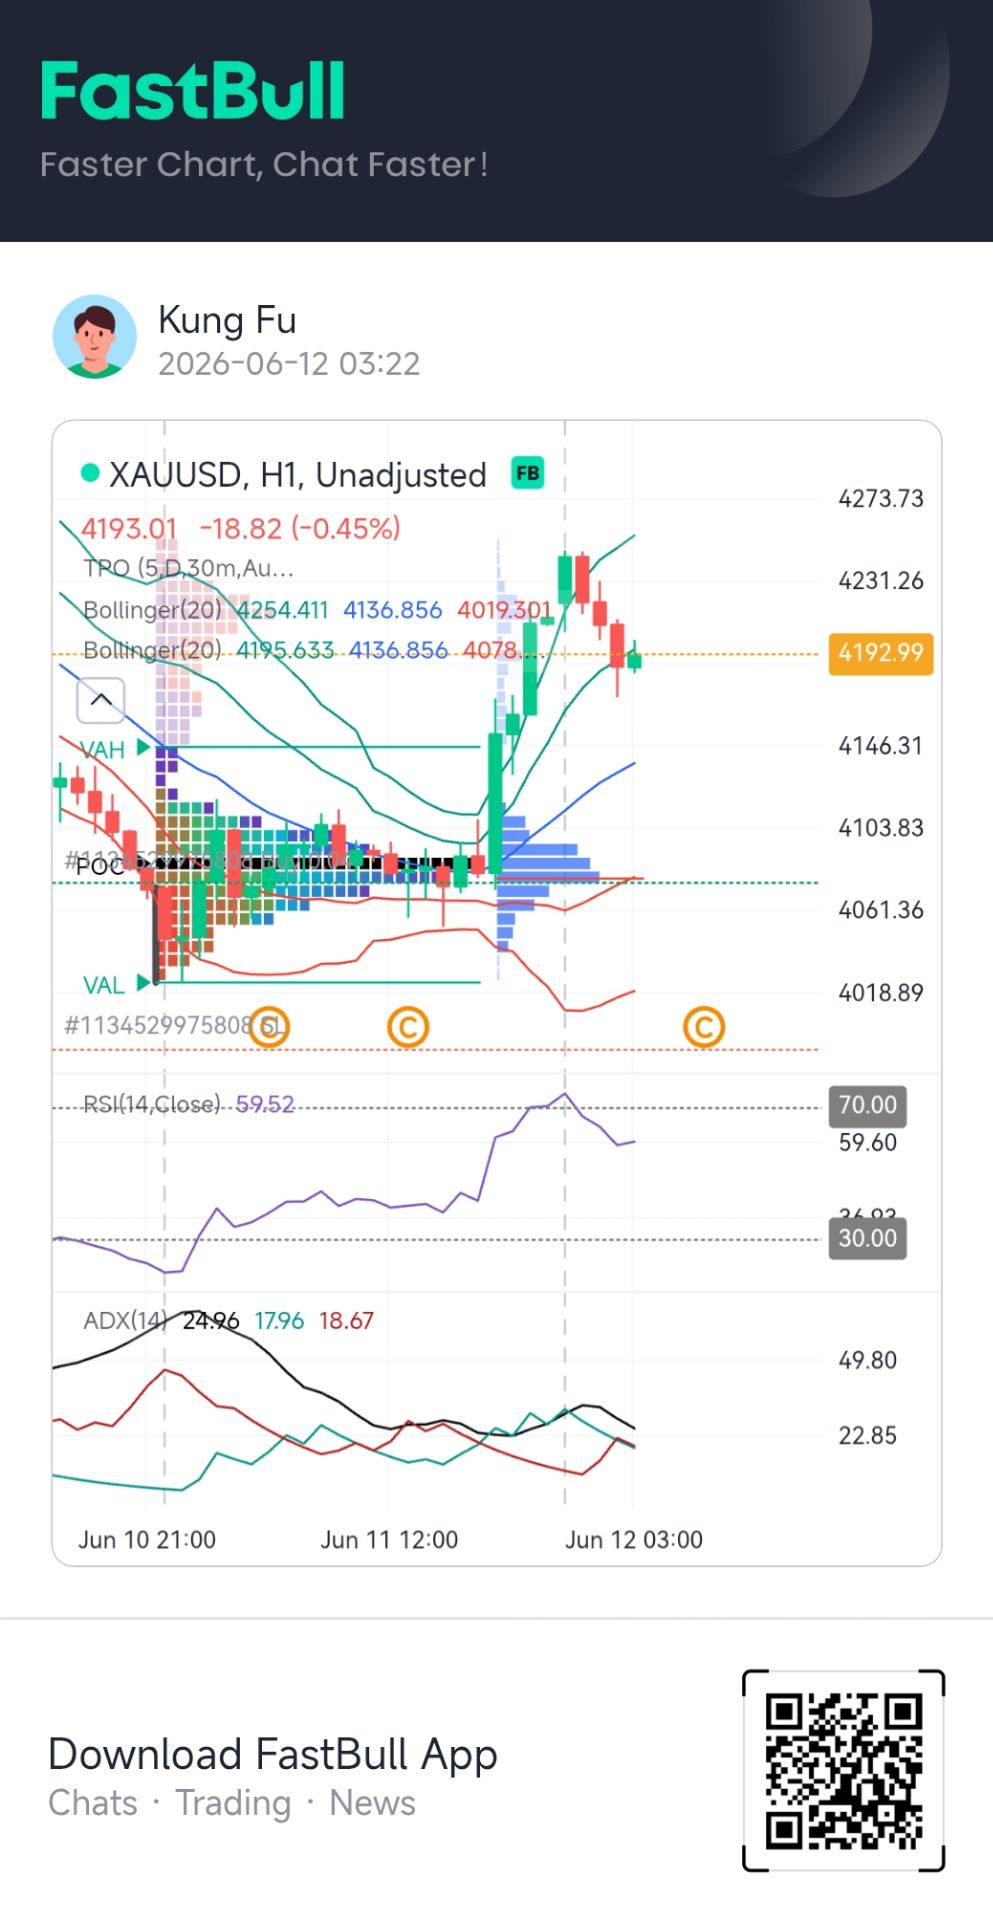
• Trade
  • Markets
  • Copy
  • Contests
  • 24/7
  • Calendar
  • Q&A
  • Chats
Screeners
SYMBOL
LAST
BID
ASK
HIGH
LOW
NET CHG.
%CHG.
SPREAD
SOURCE
SPX
S&P 500 Index
7394.31
7394.31
7394.31
7412.68
7257.33
+127.31
+ 1.75%
--
--
DJI
Dow Jones Industrial Average
50848.74
50848.74
50848.74
50968.95
49972.07
+929.97
+ 1.86%
--
--
IXIC
NASDAQ Composite Index
25809.65
25809.65
25809.65
25846.56
25109.39
+640.16
+ 2.54%
--
--
USDX
US Dollar Index
99.770
99.770
99.850
99.810
99.700
+0.110
+ 0.11%
--
--
EURUSD
Euro / US Dollar
1.15664
1.15664
1.15673
1.15862
1.15612
-0.00119
-0.10%
--
--
GBPUSD
Pound Sterling / US Dollar
1.34059
1.34059
1.34071
1.34259
1.33994
-0.00089
-0.07%
--
--
XAUUSD
Gold / US Dollar
4189.25
4189.25
4189.70
4246.22
4171.31
-22.58
-0.54%
--
--
WTI
Light Sweet Crude Oil
85.198
85.198
85.233
85.562
83.802
+0.066
+ 0.08%
--
--

Community Accounts

Signal Accounts
--
Profit Accounts
--
Loss Accounts
--
View More

Become a signal provider

Sell trading signals to earn additional income

View More

Guide to Copy Trading

Get started with ease and confidence

View More

Signal Accounts for Members

All Signal Accounts

Best Return
  • Best Return
  • Best P/L
  • Best MDD
Past 1W
  • Past 1W
  • Past 1M
  • Past 1Y

All Contests

  • All
  • Recommend
  • Stocks
  • Cryptocurrencies
  • Central Banks
  • Trump Updates
  • Featured News
Top News Only
Share

Westpac Expects The Reserve Bank Of Australia To Keep Interest Rates Unchanged At Its Meeting On June 15-16, But There Is Still A Possibility Of Future Rate Hikes

Share

U.S. Media: Officials From Multiple Countries Have Called To Persuade Trump To Shelve Military Action

Share

Spot Palladium Extended Its Gains To 2.00% On The Day, Currently Trading At $1293.78 Per Ounce

Share

Polysilicon Futures Contracts Saw A Short-term Surge, With Intraday Gains Widening To 6.00%, Currently Trading At 38,850 Yuan/ton. Palladium Futures Contracts Rose Over 6.00% Intraday, Currently Trading At 314.80 Yuan/gram

Share

Coking Coal Futures Contract 2609 Surged During The Day, With Gains Widening To 4%, Reaching A High Of 2087 Yuan/ton, And A Trading Volume Of Approximately 6.365 Billion Yuan; Open Interest Increased By Nearly 7300 Lots During The Day, With Both Trading Volume And Open Interest Activity Rising Simultaneously

Share

The Main Platinum Futures Contract Rose More Than 4.00% Intraday, Currently Trading At 433.10 Yuan/gram

Share

The Regional Governor Said The Russian City Of Toggliati, Home To Russian Automaker Avtovaz, Was Attacked By Drones

Share

The Main Coking Coal Futures Contract Rose More Than 2.00% Intraday, Currently Trading At 2047.00 Yuan/ton

Share

The Most Active Liquefied Petroleum Gas (LPG) Contract Fell 5% Intraday, Currently Trading At 5386 Yuan/ton

Share

New York Gold Futures Broke Through $4,200 Per Ounce, Up 2.10% On The Day

Share

Central Bank Indonesia: It Will Continue To Optimize The Rupiah Stabilization Measures Through Consistent And Moderate Non-deliverable Forward (NDF) Interventions In The Offshore, Onshore, And Spot Markets

Share

The Most Active PET Bottle Chip Futures Contract Fell 2.00% Intraday, Currently Trading At 7516 Yuan/ton. The Most Active Paraxylene (PX) Futures Contract Fell 2.00% Intraday, Currently Trading At 8664 Yuan/ton. The Most Active Styrene (EB) Futures Contract Fell 2.00% Intraday, Currently Trading At 8383.00 Yuan/ton

Share

Guangdong’s Foreign Trade Has Recorded Double-digit Growth For Five Consecutive Months This Year

Share

Spot Silver Fell 1.00% On The Day, Currently Trading At $66.66 Per Ounce

Share

China's Central Bank (PBOC) Announced Today That It Conducted 393 Billion Yuan Of 7-day Reverse Repurchase Operations, With A Bid Amount Of 393 Billion Yuan And A Winning Bid Amount Of 393 Billion Yuan. The Operation Rate Was 1.40%, Unchanged From The Previous Rate

Share

The 2026 China–Africa Energy Forum Focuses On China–Africa Energy Cooperation

Share

The Central Parity Rate Of The RMB In The Interbank Foreign Exchange Market On June 12, 2026

Share

The Main Liquefied Petroleum Gas (LPG) Contract Fell 4.00% Intraday, Currently Trading At 5440.00 Yuan/ton

Share

The Main Lithium Carbonate Futures Contract Rose More Than 3.00% Intraday, Currently Trading At 177,000 Yuan/ton

Share

Polysilicon 2609 Futures Saw A Significant Strengthening During The Session, With Gains Widening To 5%, Reaching A High Of 38,465 Yuan/ton, And A Trading Volume Of Approximately 2.944 Billion Yuan; Trading Activity Was High

TIME
ACT
FCST
PREV
IMPACT
Indonesia Retail Sales YoY (Apr)

A:--

F: --

P: --

XAUUSD
  • XAUUSD
  • XAGUSD
  • WTI
  • USDX
South Africa Mining Output YoY (Apr)

A:--

F: --

P: --

XAUUSD
  • XAUUSD
  • XAGUSD
  • WTI
  • USDX
South Africa Gold Production YoY (Apr)

A:--

F: --

P: --

XAUUSD
  • XAUUSD
  • XAGUSD
  • WTI
  • USDX
U.K. Refinitiv/Ipsos Primary Consumer Sentiment Index (PCSI) (Jun)

A:--

F: --

P: --

GBPUSD
  • GBPUSD
  • XAUUSD
  • XAGUSD
  • WTI
  • USDX
Turkey 1-Week Repo Rate

A:--

F: --

P: --

XAUUSD
  • XAUUSD
  • XAGUSD
  • WTI
  • USDX
Turkey Late Liquidity Window Rate (LON) (Jun)

A:--

F: --

P: --

XAUUSD
  • XAUUSD
  • XAGUSD
  • WTI
  • USDX
Turkey Overnight Lending Rate (O/N) (Jun)

A:--

F: --

P: --

XAUUSD
  • XAUUSD
  • XAGUSD
  • WTI
  • USDX
Mexico Industrial Output YoY (Apr)

A:--

F: --

P: --

XAUUSD
  • XAUUSD
  • XAGUSD
  • WTI
  • USDX
Brazil Services Growth YoY (Apr)

A:--

F: --

P: --

XAUUSD
  • XAUUSD
  • XAGUSD
  • WTI
  • USDX
Euro Zone ECB Main Refinancing Rate

A:--

F: --

P: --

EURUSD
  • EURUSD
  • XAUUSD
  • XAGUSD
  • WTI
  • USDX
Euro Zone ECB Deposit Rate

A:--

F: --

P: --

EURUSD
  • EURUSD
  • XAUUSD
  • XAGUSD
  • WTI
  • USDX
Euro Zone ECB Marginal Lending Rate

A:--

F: --

P: --

EURUSD
  • EURUSD
  • XAUUSD
  • XAGUSD
  • WTI
  • USDX
ECB Monetary Policy Statement
U.S. Core PPI MoM (SA) (May)

A:--

F: --

P: --
USDX
  • USDX
  • XAUUSD
  • XAGUSD
  • WTI
U.S. Core PPI YoY (May)

A:--

F: --

P: --
USDX
  • USDX
  • XAUUSD
  • XAGUSD
  • WTI
U.S. Weekly Continued Jobless Claims (SA)

A:--

F: --

P: --
XAUUSD
  • XAUUSD
  • XAGUSD
  • WTI
  • USDX
U.S. Initial Jobless Claims 4-Week Avg. (SA)

A:--

F: --

P: --

XAUUSD
  • XAUUSD
  • XAGUSD
  • WTI
  • USDX
U.S. PPI MoM (SA) (May)

A:--

F: --

P: --
USDX
  • USDX
  • XAUUSD
  • XAGUSD
  • WTI
U.S. PPI YoY (May)

A:--

F: --

P: --
USDX
  • USDX
  • XAUUSD
  • XAGUSD
  • WTI
U.S. Weekly Initial Jobless Claims (SA)

A:--

F: --

P: --

XAUUSD
  • XAUUSD
  • XAGUSD
  • WTI
  • USDX
Canada Building Permits MoM (SA) (Apr)

A:--

F: --

P: --
USDCAD
  • USDCAD
  • XAUUSD
  • XAGUSD
  • WTI
  • USDX
ECB Press Conference
Germany Current Account (Not SA) (Apr)

A:--

F: --

P: --
EURUSD
  • EURUSD
  • XAUUSD
  • XAGUSD
  • WTI
  • USDX
Russia Trade Balance (Apr)

A:--

F: --

P: --

WTI
  • WTI
  • XAUUSD
  • XAGUSD
  • USDX
U.S. EIA Weekly Natural Gas Stocks Change

A:--

F: --

P: --

WTI
  • WTI
  • XAUUSD
  • XAGUSD
  • USDX
China, Mainland M1 Money Supply YoY (May)

--

F: --

P: --

China, Mainland M0 Money Supply YoY (May)

--

F: --

P: --

China, Mainland M2 Money Supply YoY (May)

--

F: --

P: --

Argentina CPI MoM (May)

A:--

F: --

P: --

XAUUSD
  • XAUUSD
  • XAGUSD
  • WTI
  • USDX
U.S. Weekly Treasuries Held by Foreign Central Banks

A:--

F: --

P: --

USDX
  • USDX
  • XAUUSD
  • XAGUSD
  • WTI
U.K. Construction Output YoY (Apr)

--

F: --

P: --

U.K. GDP YoY (SA) (Apr)

--

F: --

P: --

U.K. Services Index MoM

--

F: --

P: --

U.K. Trade Balance EU (SA) (Apr)

--

F: --

P: --

U.K. Industrial Output MoM (Apr)

--

F: --

P: --

U.K. Manufacturing Output MoM (Apr)

--

F: --

P: --

U.K. Monthly GDP 3M/3M Change (Apr)

--

F: --

P: --

U.K. Trade Balance Non-EU (SA) (Apr)

--

F: --

P: --

U.K. Trade Balance (Apr)

--

F: --

P: --

U.K. Construction Output MoM (SA) (Apr)

--

F: --

P: --

U.K. Industrial Output YoY (Apr)

--

F: --

P: --

U.K. Trade Balance (SA) (Apr)

--

F: --

P: --

U.K. Manufacturing Output YoY (Apr)

--

F: --

P: --

U.K. GDP MoM (Apr)

--

F: --

P: --

France HICP Final MoM (May)

--

F: --

P: --

U.K. Inflation Rate Expectations

--

F: --

P: --

China, Mainland Outstanding Loans Growth YoY (May)

--

F: --

P: --

India CPI YoY (May)

--

F: --

P: --

India Deposit Gowth YoY

--

F: --

P: --

Brazil CPI YoY (May)

--

F: --

P: --

U.S. 5-10 Year-Ahead Inflation Expectations (Jun)

--

F: --

P: --

U.S. Weekly Total Rig Count

--

F: --

P: --

U.S. Weekly Total Oil Rig Count

--

F: --

P: --

U.K. Rightmove House Price Index YoY (Jun)

--

F: --

P: --

Saudi Arabia CPI YoY (May)

--

F: --

P: --

Euro Zone Industrial Output YoY (Apr)

--

F: --

P: --

Euro Zone Trade Balance (Not SA) (Apr)

--

F: --

P: --

Euro Zone Trade Balance (SA) (Apr)

--

F: --

P: --

Euro Zone Industrial Output MoM (Apr)

--

F: --

P: --

Euro Zone Total Reserve Assets (May)

--

F: --

P: --

Q&A with Experts
    • All
    • Chatrooms
    • Groups
    • Friends
    BNCB flag
    Kung Fu
    @BNCBit is used in reading where the big players concentrate the most when they trade, I mean with respect to price
    @Kung FuThank you very much. I am going to trade with this strategy from Monday. Hope I do good!
    Kung Fu flag
    Kung Fu flag
    Kung Fu
    @BNCBthat's it hanging vertically on the chart and printing horizontally
    Kung Fu flag
    BNCB
    @Kung FuThank you very much. I am going to trade with this strategy from Monday. Hope I do good!
    @BNCBI'm here almost always to assist. And I wish you good fortune
    Man Chez flag
    @Kung Fuhey can you please explain how it is used?
    Kung Fu flag
    Man Chez
    @Kung Fuhey can you please explain how it is used?
    @Man Chezare you asking about how the market profile I just talked about
    Kung Fu flag
    @Man Chezare you still here? If that is what you are asking about, then I can only give you only few key facts because that will take a full class on its own as a topic
    Man Chez flag
    @Kung Fuyes
    4735709 flag
    what the point for now
    4735709 flag
    who wants to be billinionare
    Kung Fu flag
    Man Chez
    @Kung Fuyes
    @Man Chezokay. On MT5 it is clearly called market profile but on FastBull you'll see it as TPO even though TPO is only a component of the indicator
    Kung Fu flag
    Man Chez
    @Kung Fuyes
    @Man Chezif you take a look again at the chart I shared just now, you'll notice that the indicator is hanging vertically and printing horizontally
    Kung Fu flag
    I want you to first understand this: it is a price and time data indicator@Man Chez
    Kung Fu flag
    Do you know what that means@Man Chez
    Man Chez flag
    @Kung Fuit shows the price at a certain time
    Man Chez flag
    i think
    Kung Fu flag
    Man Chez
    @Kung Fuit shows the price at a certain time
    @Man Chezyes, there's a big point you made here. I think you're going some findings too. That's gonna help indeed
    Kung Fu flag
    The indicator has several components as you may have found in the image shared@Man Chez
    Kung Fu flag
    Kung Fu
    The indicator has several components as you may have found in the image shared@Man Chez
    @Man Chezand they include the TPO, very important, the POC, this is key
    Kung Fu flag
    Plus there is the VA or value area@Man Chez
    Type here...
    Add Symbol or Code

      No matching data

      All
      Recommend
      Stocks
      Cryptocurrencies
      Central Banks
      Trump Updates
      Featured News
      • All
      • Russia-Ukraine Conflict
      • Middle East Flashpoint
      • All
      • Russia-Ukraine Conflict
      • Middle East Flashpoint
      Search
      Products

      Charts Free Forever

      Chats Q&A with Experts
      Screeners Economic Calendar Data Tools
      Membership Features
      Data Warehouse Market Trends Institutional Data Policy Rates Macro

      Market Trends

      Market Sentiment Order Book Forex Correlations

      Top Indicators

      Charts Free Forever
      Markets

      News

      24/7 Analysis Education

      Latest Views

      Latest Update

      Signals

      Copy Rankings Latest Signals Become a signal provider AI Rating
      Contests
      Brokers

      Overview Brokers Assessment Rankings Regulators News Claims
      Broker listing Forex Brokers Comparison Tool Live Spread Comparison Scam
      Q&A Complaint Scam Alert Videos Tips to Detect Scam
      More

      Business
      Events
      Careers About Us Advertising Help Center

      White Label

      Broker API

      Data API

      Web Plug-ins

      Affiliate Program

      Awards Institution Evaluation IB Seminar Salon Event Exhibition
      Vietnam Thailand Singapore Dubai
      Fans Party Investment Sharing Session
      FastBull Summit BrokersView Expo
      Recent Searches
        Top Searches
          Markets
          Analysis
          User
          24/7
          Economic Calendar
          Education
          Data
          • Names
          • Latest
          • Prev

          View All

          No data

          Scan to Download

          Faster Charts, Chat Faster!

          Download
          English
          • English
          • Español
          • العربية
          • Bahasa Indonesia
          • Bahasa Melayu
          • Tiếng Việt
          • ภาษาไทย
          • Français
          • Italiano
          • Türkçe
          • Русский язык
          • 简中
          • 繁中
          Open Account
          Search
          Products
          Charts Free Forever
          Markets
          News
          Signals

          Copy Rankings Latest Signals Become a signal provider AI Rating
          Contests
          Brokers

          Overview Brokers Assessment Rankings Regulators News Claims
          Broker listing Forex Brokers Comparison Tool Live Spread Comparison Scam
          Q&A Complaint Scam Alert Videos Tips to Detect Scam
          More

          Business
          Events
          Careers About Us Advertising Help Center

          White Label

          Broker API

          Data API

          Web Plug-ins

          Affiliate Program

          Awards Institution Evaluation IB Seminar Salon Event Exhibition
          Vietnam Thailand Singapore Dubai
          Fans Party Investment Sharing Session
          FastBull Summit BrokersView Expo

          Gold to Hit $5,000 by Q1 2026, UBS Forecasts

          Edward Lawson

          Economic

          Traders' Opinions

          Remarks of Officials

          Commodity

          Central Bank

          Political

          Energy

          Summary:

          UBS projects gold to $5,000 by 2026, driven by macro risks, hinting at a broader commodity surge.

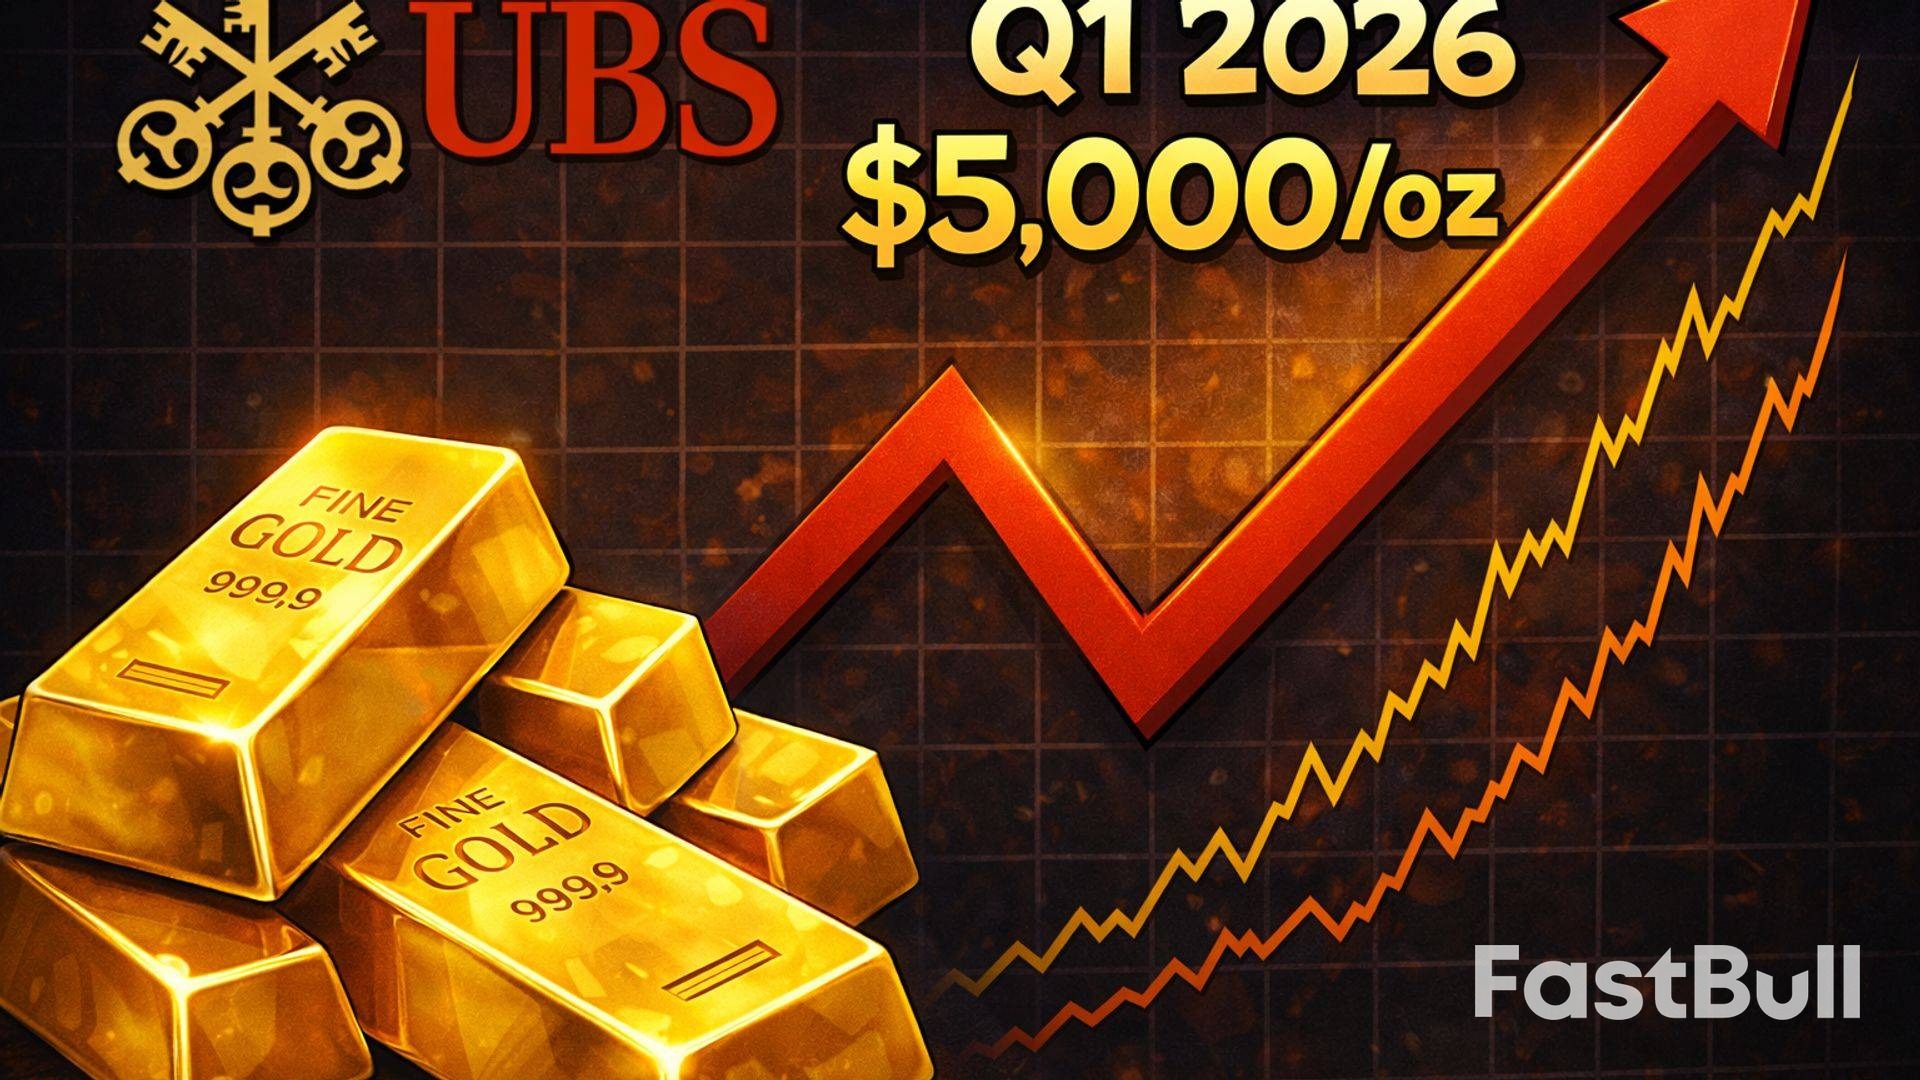
          A potent combination of central bank buying, expanding fiscal deficits, lower U.S. interest rates, and persistent geopolitical risk is set to drive gold prices to $5,000 per ounce by the first quarter of 2026, according to a new forecast from UBS Wealth Management.

          Dominic Schnider, Head of Commodities & APAC Forex CIO at the firm, stated that commodities are expected to take on a more significant role in investment portfolios in 2026. "Our forecasts point to attractive returns, supported by supply-demand imbalances, heightened geopolitical risks, and long-term trends like the global energy transition," he noted.

          UBS's Detailed Gold Price Timeline for 2026

          The Swiss banking giant has raised its gold price target significantly. In a recent report, strategists outlined a clear trajectory for the precious metal:

          • Rally to $5,000/oz by March 2026.

          • Hold at $5,000/oz through September 2026.

          • Moderate to $4,800/oz by the end of 2026.

          This updated end-of-year target of $4,800 is a substantial $500 increase from the bank's previous forecast of $4,300 per ounce.

          UBS anticipates that demand for gold will see a steady increase throughout 2026, fueled by low real yields, ongoing global economic concerns, and domestic policy uncertainties in the United States, particularly around fiscal pressures and the midterm elections.

          The Upside Case: How Gold Could Reach $5,400

          The report also highlights a scenario where political or financial risks could push prices even higher. "If political or financial risks increase, the gold price could climb to $5,400 per ounce," the strategists wrote. This is an upward revision from their previous high-end estimate of $4,900 per ounce.

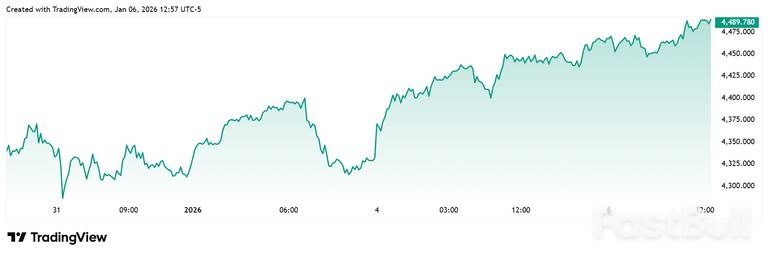
          Geopolitical events have recently demonstrated their power to move markets. Following news that the U.S. had ousted former Venezuelan President Maduro, spot gold opened sharply higher and has continued to climb, trading as high as $4,491.20 on Tuesday.

          Figure 1: A financial chart shows gold's recent price appreciation, climbing toward the $4,500 level amid market-moving events.

          A Broader Bull Market for Commodities

          While gold remains a key focus, UBS sees opportunities across the entire commodities complex, which is poised for attractive returns. Schnider identified several areas of interest:

          • Copper and Aluminum: Both metals are projected to face supply shortages that could drive prices higher. Demand is structurally supported by the global transition to clean energy and widespread electrification.

          • Crude Oil: Prices are expected to begin recovering in the second half of the year as the current surplus shrinks due to solid demand growth and moderating non-OPEC+ supply.

          • Agriculture: This sector also presents specific opportunities.

          Portfolio Strategy and Diversification

          Schnider emphasized the value of commodities as a portfolio diversifier, particularly during periods of market stress. "Returns are generally strongest when supply-demand imbalances or macro risks—like inflation or geopolitical events—are elevated," he explained.

          In favorable conditions, UBS suggests an allocation of up to 5% to a diversified commodity index to help protect against unexpected shocks.

          Concluding his outlook, Schnider reiterated the firm's positive stance. "We like broad commodities exposure, gold, and select commodity-linked equities," he said, citing the compelling mix of supply-demand dynamics, geopolitical factors, and the ongoing energy transition.

          To stay updated on all economic events of today, please check out our Economic calendar
          Risk Warnings and Disclaimers
          You understand and acknowledge that there is a high degree of risk involved in trading. Following any strategies or investment methods may lead to potential losses. The content on the site is provided by our contributors and analysts for information purposes only. You are solely responsible for determining whether any trading assets, securities, strategy, or any other product is suitable for investing based on your own investment objectives and financial situation.
          Add to Favorites
          Share
          FastBull
          Copyright © 2026 FastBull Ltd

          728 RM B 7/F GEE LOK IND BLDG NO 34 HUNG TO RD KWUN TONG KLN HONG KONG

          TelegramInstagramTwitterfacebooklinkedin
          App Store Google Play Android Windows
          Products
          Charts

          Chats

          Q&A with Experts
          Screeners
          Economic Calendar
          Data
          Tools
          Membership
          Features
          Function
          Markets
          Copy Trading
          Latest Signals
          Contests
          24/7
          Analysis
          Education
          Company
          Careers
          About Us
          Contact Us
          Advertising
          Download FastBull
          Help Center
          Feedback
          User Agreement
          Privacy Policy
          Personal Information Protection Statement
          Business

          White Label

          Broker API

          Data API

          Web Plug-ins

          Poster Maker

          Affiliate Program

          Risk Disclosure

          The risk of loss in trading financial instruments such as stocks, FX, commodities, futures, bonds, ETFs and crypto can be substantial. You may sustain a total loss of the funds that you deposit with your broker. Therefore, you should carefully consider whether such trading is suitable for you in light of your circumstances and financial resources.

          No decision to invest should be made without thoroughly conducting due diligence by yourself or consulting with your financial advisors. Our web content might not suit you since we don't know your financial conditions and investment needs. Our financial information might have latency or contain inaccuracy, so you should be fully responsible for any of your trading and investment decisions. The company will not be responsible for your capital loss.

          Without getting permission from the website, you are not allowed to copy the website's graphics, texts, or trademarks. Intellectual property rights in the content or data incorporated into this website belong to its providers and exchange merchants.

          Not Logged In

          Log in to access more features

          Connect Broker
          Become a signal provider
          Help Center
          Customer Service
          Dark Mode
          Price Up/Down Colors

          Log In

          Sign Up

          Position
          Layout
          Fullscreen
          Default to Chart
          The chart page opens by default when you visit fastbull.com