Markets
News
Analysis
User
24/7
Economic Calendar
Education
Data
- Names
- Latest
- Prev


Signal Accounts for Members
All Signal Accounts
All Contests


Turkey Retail Sales YoY (Nov)A:--
F: --
P: --
U.S. NFIB Small Business Optimism Index (SA) (Dec)A:--
F: --
P: --
Brazil Services Growth YoY (Nov)A:--
F: --
P: --
Canada Building Permits MoM (SA) (Nov)A:--
F: --
U.S. CPI MoM (SA) (Dec)A:--
F: --
P: --
U.S. CPI YoY (Not SA) (Dec)A:--
F: --
P: --
U.S. Real Income MoM (SA) (Dec)A:--
F: --
P: --
U.S. CPI MoM (Not SA) (Dec)A:--
F: --
P: --
U.S. Core CPI (SA) (Dec)A:--
F: --
P: --
U.S. Core CPI YoY (Not SA) (Dec)A:--
F: --
P: --
U.S. Core CPI MoM (SA) (Dec)A:--
F: --
P: --
U.S. Weekly Redbook Index YoYA:--
F: --
P: --
U.S. Building Permits Revised YoY (SA) (Oct)A:--
F: --
P: --
U.S. Building Permits Revised MoM (SA) (Oct)A:--
F: --
P: --
U.S. New Home Sales Annualized MoM (Oct)A:--
F: --
U.S. Annual Total New Home Sales (Oct)A:--
F: --
U.S. Cleveland Fed CPI MoM (SA) (Dec)A:--
F: --
P: --
U.S. Cleveland Fed CPI MoM (Dec)A:--
F: --
P: --
China, Mainland Exports (Dec)--
F: --
P: --
China, Mainland Imports YoY (CNH) (Dec)--
F: --
P: --
China, Mainland Imports (CNH) (Dec)--
F: --
P: --
China, Mainland Trade Balance (CNH) (Dec)--
F: --
P: --
China, Mainland Imports YoY (USD) (Dec)--
F: --
P: --
China, Mainland Exports YoY (USD) (Dec)--
F: --
P: --
China, Mainland M0 Money Supply YoY (Dec)--
F: --
P: --
China, Mainland M1 Money Supply YoY (Dec)--
F: --
P: --
China, Mainland M2 Money Supply YoY (Dec)--
F: --
P: --
U.S. EIA Natural Gas Production Forecast For The Next Year (Jan)A:--
F: --
P: --
U.S. EIA Short-Term Crude Production Forecast For The Next Year (Jan)A:--
F: --
P: --
U.S. EIA Short-Term Crude Production Forecast For The Year (Jan)A:--
F: --
P: --
EIA Monthly Short-Term Energy Outlook
U.S. 30-Year Bond Auction Avg. Yield--
F: --
P: --
Argentina 12-Month CPI (Dec)--
F: --
P: --
U.S. Budget Balance (Dec)--
F: --
P: --
Argentina CPI MoM (Dec)--
F: --
P: --
Argentina National CPI YoY (Dec)--
F: --
P: --
Richmond Federal Reserve President Barkin delivered a speech.
U.S. API Weekly Cushing Crude Oil Stocks--
F: --
P: --
U.S. API Weekly Crude Oil Stocks--
F: --
P: --
U.S. API Weekly Refined Oil Stocks--
F: --
P: --
U.S. API Weekly Gasoline Stocks--
F: --
P: --
South Korea Unemployment Rate (SA) (Dec)--
F: --
P: --
Japan Reuters Tankan Non-Manufacturers Index (Jan)--
F: --
P: --
Japan Reuters Tankan Manufacturers Index (Jan)--
F: --
P: --
China, Mainland Exports YoY (CNH) (Dec)--
F: --
P: --
China, Mainland Trade Balance (USD) (Dec)--
F: --
P: --
China, Mainland Outstanding Loans Growth YoY (Dec)--
F: --
P: --
U.K. 10-Year Note Auction Yield--
F: --
P: --
Canada Leading Index MoM (Dec)--
F: --
P: --
U.S. MBA Mortgage Application Activity Index WoW--
F: --
P: --
U.S. Core PPI YoY (Nov)--
F: --
P: --
U.S. PPI MoM (SA) (Nov)--
F: --
P: --
U.S. PPI YoY (Nov)--
F: --
P: --
U.S. Current Account (Q3)--
F: --
P: --
U.S. Retail Sales YoY (Nov)--
F: --
P: --
U.S. Retail Sales (Nov)--
F: --
P: --
U.S. Core Retail Sales MoM (Nov)--
F: --
P: --
U.S. Core Retail Sales (Nov)--
F: --
P: --


No matching data
Latest Views
Latest Views
Trending Topics
Top Columnists
Latest Update
White Label
Data API
Web Plug-ins
Affiliate Program
View All

No data
Gold and silver hit records on global instability and institutional demand, with further historic gains forecast.
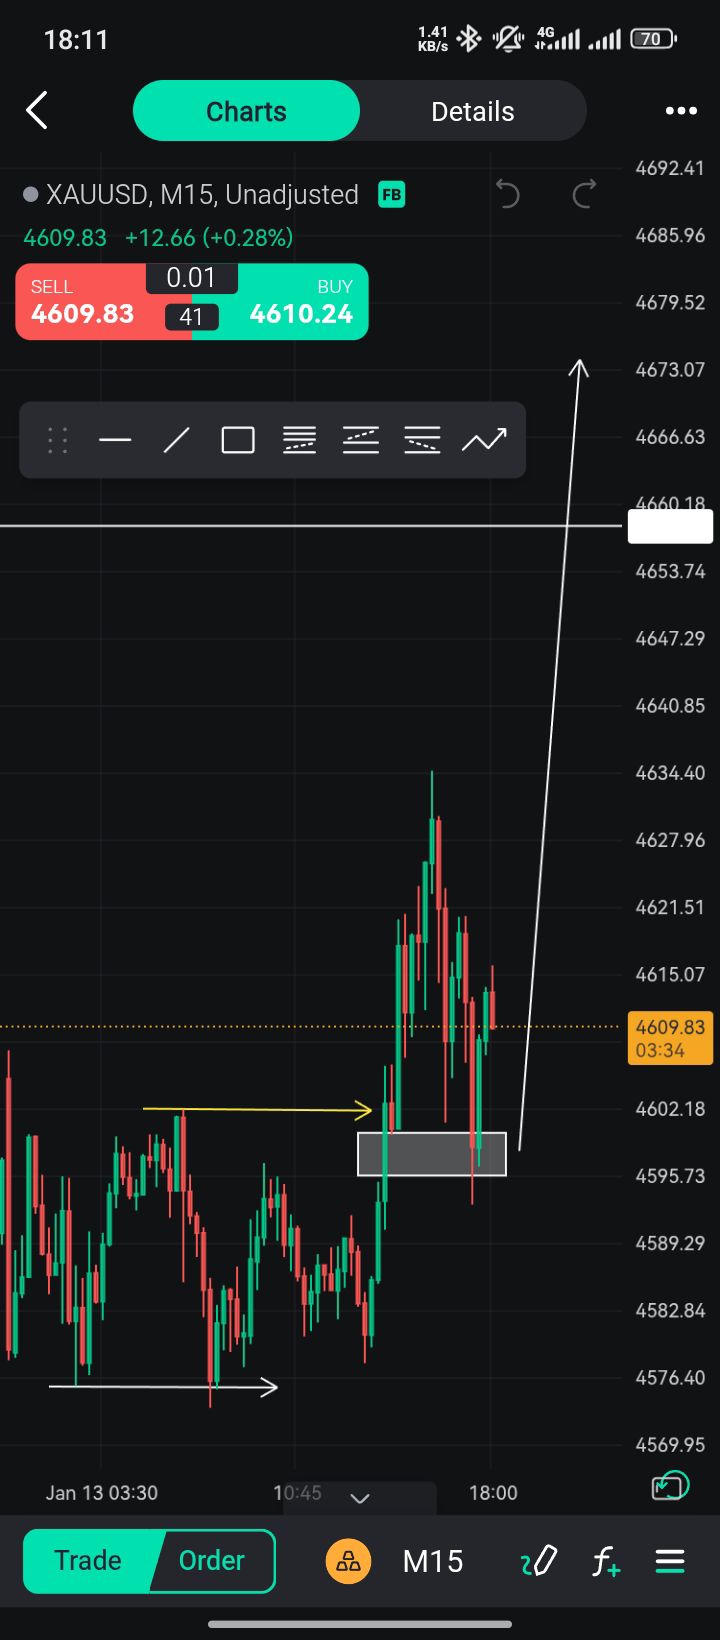
Gold and silver have reignited their powerful rally, with gold bullion crossing the $4,600 per ounce threshold for the first time as major brokerages forecast a run toward $5,000. A confluence of geopolitical and economic factors is amplifying the precious metals' appeal as safe-haven assets.
On Monday, spot gold surged to a high of $4,629.94 per ounce, while silver climbed to a record $86.22 per ounce. Gold has already gained over 6% in the first 13 days of 2026, building on a spectacular 64% advance last year.
Analysts widely expect the momentum to continue. The consensus outlook points to gold reaching $5,000 per ounce in 2026, driven by persistent geopolitical tension, anticipated monetary policy easing, strong ETF inflows, and continued purchasing by central banks.
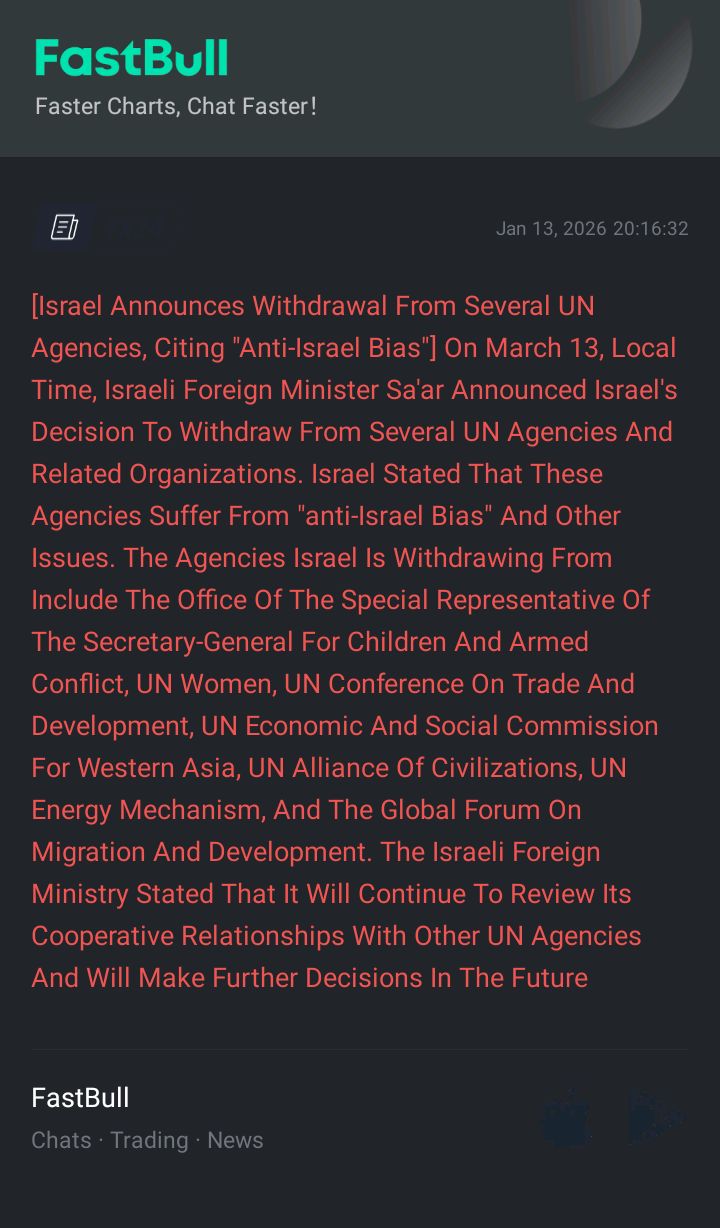
Recent price action is closely tied to rising global uncertainty. Gold's record high on Monday was directly fueled by concerns over the independence of the U.S. Federal Reserve, following Chair Jerome Powell's statement that the Trump administration had threatened him with criminal indictment.
Broader political instability is also pushing investors toward tangible assets. Key drivers include:
• The U.S. seizure of Venezuela's Nicolas Maduro in a military operation.
• President Donald Trump's threats to take control of Greenland.
• Speculation over whether Trump will intervene in the unrest in Iran.
"Real assets come to the fore in the kind of environment we're looking at," said Ross Norman, an independent precious metals analyst. "The rules are out the window. Precious metal is reflecting all of that."
Adding to gold's appeal are market expectations of U.S. interest rate cuts. Lower rates reduce the opportunity cost of holding non-yielding assets like gold, making it more attractive to investors.
"Should current geopolitical risks persist and U.S. rate-cutting expectations remain intact, gold may attempt a more sustained breach of $4,600 in the coming weeks," noted Tim Waterer, chief market analyst at KCM Trade.
Beyond immediate headlines, a powerful trend of institutional buying provides a solid foundation for gold's rally. Central banks have shown a strong appetite for gold for four consecutive years, a trend expected to continue through 2026.
Notably, China's central bank increased its gold holdings for the 14th straight month in December, bringing its total reserves to 74.15 million fine troy ounces.
Investment demand is also surging. According to the World Gold Council, 2025 saw record annual inflows of $89 billion into physically backed gold exchange-traded funds (ETFs), a year in which gold set new record highs 53 times. Holdings in the SPDR Gold Trust, the largest gold-backed ETF, hit 1,073.41 metric tons on December 29, the highest level in over three years.
While gold captures headlines, silver delivered an even more stunning performance last year, gaining 147%. Several unique factors are driving its explosive growth:
• Robust investment demand.
• Its inclusion on the U.S. list of critical minerals, which prompted significant outflows into U.S. stocks.
• Bottlenecks in refining capacity.
• A persistent structural deficit in the market.
Analysts note that silver's smaller market size often amplifies its price movements when it benefits from the same macroeconomic drivers as gold.
"It's likely that there could be volatility in the market and if things remain as they are, I think prices will be soon pushing towards $90/oz," said Soni Kumari, a commodity strategist at ANZ.
Consultancy Metals Focus believes a three-digit price peak for silver is likely this year. However, HSBC offered a more measured forecast, expecting silver to trade between $58 and $88 an ounce in 2026, while also warning of a potential market correction later in the year as supply constraints begin to ease.
Nearly two decades ago, India promised itself — and the US — that nuclear power would be its next big bet. The two countries signed a landmark deal on civilian nuclear energy in 2008, amid protests from politicians and activists alike. The late Manmohan Singh, then prime minister, bet his government's survival on passing that legislation — a wager he won, contributing to its re-election a year later.
But all that political capital was wasted in the years that followed. Investment didn't flow in. No new plants that used world-class technology or private-sector expertise got built.
That might, finally, be about to change. In December, parliament passed a new bill that is supposed to make it easier for private companies, including foreign ones, to build and operate nuclear power plants. It ends a de-facto state monopoly on the source of energy — and, even more importantly, aligns India's legal framework with global norms, so investors know what they're getting into.
Hopefully, this hasn't come too late for power-hungry India. Nuclear contributes only about 3% of its electricity. As renewable energy scales up across the country, many worry that its intermittent nature will keep dirty coal plants in business longer than necessary. But New Delhi has finally accepted that the base load power demand of the future will need supplementing, and nuclear plants are one way to go about it.
These ambitions are small compared to India's size — but vast by any other standards. The government plans for 100 gigawatts of nuclear-energy capacity by 2047, the 100th anniversary of independence, up from less than nine gigawatts today. In other words, it intends to build the equivalent of America's entire reactor fleet over the next generation.
This is one of the biggest opportunities in the energy sector in years. Unsurprisingly, there are a few companies that are already interested. Bloomberg News has reported that Adani Group intends to kick things off with small modular reactors in the most populous state, Uttar Pradesh. Several other large conglomerates are also apparently keen.
But that won't be enough. Officials have estimated a build-out of this scale will cost $217 billion. Domestic capital can't do that alone; foreign companies will need to get involved.
This is where the second part of the December law comes in. The rules have been changed to reflect global liability standards, removing the biggest reason that the 2008 nuclear deal underperformed.
This has been a political landmine for a very long time. In 1984, a pesticide plant in the central Indian town of Bhopal leaked a highly toxic gas. Thousands died. We still don't know exactly how many — but enough to make it the world's deadliest industrial disaster.
Many Indians still believe the plant's operator, the US company Union Carbide, got off too lightly. The shadow of Bhopal has meant that the Indian state has always wanted to ensure it could go after suppliers of industrial equipment if needed; but, across the world, the liability for nuclear accidents is usually shouldered by a plant's operator, not those who provide the technology and equipment.
Moving beyond this was essential to finally make nuclear energy projects financeable. But the government shouldn't skip out on the other half of the bargain: Regulation.
The controls the new law proposes appear strong enough — on paper. But unless the government is very careful, things might be different in practice. This is particularly true once well-connected business groups get involved. In sectors from coal to airports to telecom, apparently independent regulators have been accused of being too weak on politically influential Indian corporations.
That's bad anywhere. In the nuclear sector it could be disastrous. The problem of information asymmetry is unusually severe, the care required unusually high, and the damage that an accident could cause uniquely irreversible. Regulators thus have to believe they can delay projects, shut down plants, even embarrass tycoons in public.
India tends to build sectors first and regulate them later. With nuclear power, it must do both together. It will save billions by allowing the private sector in, but it must also spend billions on independent laboratories, well-paid inspectors, and real-time monitoring.
The government is right to hope that private capital will help manage the awesome up-front cost of building the world's second-largest fleet of reactors. But it has a start-up cost of its own to pay: The creation of regulatory expertise and governance capacity.
The latest Consumer Price Index (CPI) report for December shows inflation is cooling faster than anticipated, strengthening the case for the Federal Reserve to lower interest rates.
While headline inflation rose 0.3% month-on-month, matching consensus forecasts, core inflation climbed only 0.2%, missing the 0.3% expectation. The data counters concerns of a potential 0.4% spike, which some analysts feared due to timing issues related to a government shutdown that may have distorted price discovery between November 2024 and November 2025.

A closer look at the data reveals that prices for core goods remained remarkably stable, suggesting the inflationary impact from tariffs has been much weaker than predicted. Key categories often subject to import duties saw prices fall or stagnate:
• Appliances: -4.3% MoM
• Furniture: -0.4% MoM
• Used Vehicles: -1.1% MoM
• New Vehicles: 0.0% MoM
• Video and Audio Equipment: -0.4% MoM
This trend indicates that U.S. retailers may be absorbing tariff-related costs by squeezing their profit margins rather than passing them on to consumers.
However, some service sectors continue to experience price pressures. Primary rent and owners' equivalent rent both increased by 0.3%, while medical care services rose 0.4%. Transportation services saw a 0.5% increase, driven largely by a 5.2% jump in airline fares. Apparel and food prices also climbed, rising 0.6% and 0.7% respectively.
Overall, the inflation report is a positive development for policymakers. Fed Chair Jerome Powell has suggested that the impact of tariffs may peak in the current quarter. The surprisingly muted effect of these tariffs gives the central bank more room to maneuver.
With downward pressure from falling gasoline prices, slowing housing rents, and weakening wage growth, CPI is expected to continue its trend lower this year, potentially approaching the 2% target by year-end. This outlook makes two Federal Reserve rate cuts seem highly achievable, with risks skewed toward a third cut, especially given the cooling labor market.
While inflation is easing, the jobs market presents a more concerning picture. ADP private payrolls data showed an average weekly increase of just 11,750 in the four weeks to December 20. This figure is consistent with the 50,000 monthly gain in non-farm payrolls reported by the Bureau of Labor Statistics (BLS).
Crucially, Fed Chair Powell has indicated that the Fed believes official payroll figures are being overestimated by around 60,000 per month. Factoring in this adjustment suggests the U.S. labor market is effectively stagnant.
Why Consumers Feel Left Behind
This weakness in the job market helps explain why consumer confidence remains low despite easing price pressures. Household affordability is becoming a major source of anxiety. Outside of government, leisure and hospitality, and private education and healthcare, all other sectors have lost jobs in seven of the last eight months.
This sentiment is further explained by BLS data on worker compensation. The proportion of economic growth flowing to workers through their pay has declined from 64% in the 1950s to less than 54% today. With the corporate sector capturing an increasing share of economic gains, it's clear why strong GDP growth and record-high stock markets are not translating into a sense of prosperity for many households.
These underlying economic anxieties are shaping up to be a central theme in the upcoming November mid-term elections. In response, the Administration may increase efforts to generate positive economic headlines.
Potential measures could include capping credit card borrowing costs, improving mortgage availability and affordability, and removing some items from the scope of tariffs. Delivering the proposed $2,000 tariff dividend ahead of the elections will also be a key priority for the President.

The global economy is showing more resilience than previously thought, prompting the World Bank to slightly upgrade its growth forecast for 2026. However, the institution warned on Tuesday that this growth is overly dependent on advanced economies and remains too weak to make a significant dent in extreme poverty.
In its latest Global Economic Prospects report, the World Bank projects global output will slow to 2.6% this year, following 2.7% growth in 2025. The forecast for 2027 sees growth returning to 2.7%.
The 2026 growth estimate of 2.6% marks a 0.2 percentage point increase from the bank’s June predictions. The forecast for 2025 has been revised upward more substantially, by 0.4 percentage points.
The World Bank attributed roughly two-thirds of this positive revision to the better-than-expected performance of the U.S. economy, which has held up despite trade disruptions from tariffs.
The forecast for U.S. GDP growth is now 2.2% in 2026, an upward revision of 0.2 percentage points. The projection for 2025 has been raised by half a percentage point to 2.1%.
According to the report, U.S. growth in 2025 was held back by an import surge as businesses rushed to get ahead of tariffs. Looking ahead to 2026, growth will be supported by larger tax incentives, though this will be partially offset by the negative impact of tariffs on investment and consumption.
Despite the short-term upgrades, the World Bank issued a stark warning. If current trends hold, the 2020s are poised to become the weakest decade for global growth since the 1960s. This sluggish pace is considered insufficient to prevent stagnation and rising joblessness in many emerging and developing nations.
"With each passing year, the global economy has become less capable of generating growth and seemingly more resilient to policy uncertainty," said Indermit Gill, the World Bank's Chief Economist. "But economic dynamism and resilience cannot diverge for long without fracturing public finance and credit markets."
Growth across emerging market and developing economies is expected to slow from 4.2% in 2025 to 4.0% in 2026. While these figures represent upgrades of 0.3 and 0.2 percentage points respectively from the June forecast, the headline number masks a significant divergence.
The China Factor
China's economy is projected to slow, with growth falling from 4.9% in 2025 to 4.4% in 2026. However, both of these forecasts have been revised up by 0.4 percentage points due to the effects of fiscal stimulus and successful efforts to increase exports to markets outside the U.S.
Stagnation Risk Elsewhere
When China is excluded from the calculation, the growth rate for the rest of the emerging and developing world is forecast to be flat at 3.7% in both 2025 and 2026. This highlights the underlying weakness and reinforces concerns about the global economy's ability to lift populations out of poverty.
Natural Gas (NG) Price Chart
WTI Price Chart
Brent Price Chart
White Label
Data API
Web Plug-ins
Poster Maker
Affiliate Program
The risk of loss in trading financial instruments such as stocks, FX, commodities, futures, bonds, ETFs and crypto can be substantial. You may sustain a total loss of the funds that you deposit with your broker. Therefore, you should carefully consider whether such trading is suitable for you in light of your circumstances and financial resources.
No decision to invest should be made without thoroughly conducting due diligence by yourself or consulting with your financial advisors. Our web content might not suit you since we don't know your financial conditions and investment needs. Our financial information might have latency or contain inaccuracy, so you should be fully responsible for any of your trading and investment decisions. The company will not be responsible for your capital loss.
Without getting permission from the website, you are not allowed to copy the website's graphics, texts, or trademarks. Intellectual property rights in the content or data incorporated into this website belong to its providers and exchange merchants.
Not Logged In
Log in to access more features

FastBull Membership
Not yet
Purchase
Log In
Sign Up