Markets
News
Analysis
User
24/7
Economic Calendar
Education
Data
- Names
- Latest
- Prev


Signal Accounts for Members
All Signal Accounts
All Contests
 Canada Federal Government Budget Balance (Oct)
A:--
F: --
P: --
 U.S. 5-Year Note Auction Avg. Yield
A:--
F: --
P: --
U.S. Weekly Total Oil Rig CountA:--
F: --
P: --
U.S. Weekly Total Rig CountA:--
F: --
P: --
U.S. API Weekly Cushing Crude Oil StocksA:--
F: --
P: --
U.S. API Weekly Crude Oil StocksA:--
F: --
P: --
U.S. API Weekly Refined Oil StocksA:--
F: --
P: --
U.S. API Weekly Gasoline StocksA:--
F: --
P: --
 Mexico Unemployment Rate (Not SA) (Nov)
A:--
F: --
P: --
U.S. MBA Mortgage Application Activity Index WoWA:--
F: --
P: --
U.S. Weekly Continued Jobless Claims (SA)A:--
F: --
U.S. Weekly Initial Jobless Claims (SA)A:--
F: --
P: --
U.S. Initial Jobless Claims 4-Week Avg. (SA)A:--
F: --
P: --
 Japan Construction Orders YoY (Nov)
A:--
F: --
P: --
Japan New Housing Starts YoY (Nov)A:--
F: --
P: --
 Turkey Capacity Utilization (Dec)
A:--
F: --
P: --
Japan Tokyo CPI YoY (Excl. Food & Energy) (Dec)A:--
F: --
P: --
Japan Unemployment Rate (Nov)A:--
F: --
P: --
Japan Tokyo Core CPI YoY (Dec)A:--
F: --
P: --
Japan Tokyo CPI YoY (Dec)A:--
F: --
P: --
Japan Jobs to Applicants Ratio (Nov)A:--
F: --
P: --
Japan Tokyo CPI MoM (Dec)A:--
F: --
P: --
Japan Tokyo CPI MoM (Excl. Food & Energy) (Dec)A:--
F: --
P: --
Japan Industrial Inventory MoM (Nov)A:--
F: --
P: --
Japan Retail Sales (Nov)A:--
F: --
P: --
Japan Industrial Output Prelim MoM (Nov)A:--
F: --
P: --
Japan Large-Scale Retail Sales YoY (Nov)A:--
F: --
P: --
Japan Industrial Output Prelim YoY (Nov)A:--
F: --
P: --
Japan Retail Sales MoM (SA) (Nov)A:--
F: --
P: --
Japan Retail Sales YoY (Nov)A:--
F: --
P: --
 Russia Retail Sales YoY (Nov)
--
F: --
P: --
Russia Unemployment Rate (Nov)--
F: --
P: --
 Argentina Retail Sales YoY (Oct)
--
F: --
P: --
U.S. Weekly Treasuries Held by Foreign Central Banks--
F: --
P: --
 China, Mainland Industrial Profit YoY (YTD) (Nov)
--
F: --
P: --
Russia IHS Markit Manufacturing PMI (Dec)--
F: --
P: --
 India Manufacturing Output MoM (Nov)
--
F: --
P: --
India Industrial Production Index YoY (Nov)--
F: --
P: --
 France Unemployment Class-A (Nov)
--
F: --
P: --
 Euro Zone Total Reserve Assets (Nov)
--
F: --
P: --
Canada National Economic Confidence Index--
F: --
P: --
U.S. Pending Home Sales Index (Nov)--
F: --
P: --
U.S. Pending Home Sales Index MoM (SA) (Nov)--
F: --
P: --
U.S. Pending Home Sales Index YoY (Nov)--
F: --
P: --
U.S. EIA Weekly Crude Oil Imports Changes--
F: --
P: --
U.S. EIA Weekly Cushing, Oklahoma Crude Oil Stocks Change--
F: --
P: --
U.S. EIA Weekly Crude Demand Projected by Production--
F: --
P: --
U.S. EIA Weekly Gasoline Stocks Change--
F: --
P: --
U.S. Dallas Fed General Business Activity Index (Dec)--
F: --
P: --
U.S. EIA Weekly Heating Oil Stock Changes--
F: --
P: --
U.S. EIA Weekly Crude Stocks Change--
F: --
P: --
U.S. Dallas Fed New Orders Index (Dec)--
F: --
P: --
Russia CPI YoY (Dec)--
F: --
P: --
U.S. EIA Weekly Natural Gas Stocks Change--
F: --
P: --
 Brazil CAGED Net Payroll Jobs (Nov)
--
F: --
P: --
 South Korea Industrial Output MoM (SA) (Nov)
--
F: --
P: --
South Korea Retail Sales MoM (Nov)--
F: --
P: --
South Korea Services Output MoM (Nov)--
F: --
P: --
Russia IHS Markit Services PMI (Dec)--
F: --
P: --
Turkey Economic Sentiment Indicator (Dec)--
F: --
P: --


No matching data
Latest Views
Latest Views
Trending Topics
Top Columnists
Latest Update
White Label
Data API
Web Plug-ins
Affiliate Program
View All
No data
Gold and silver surged to fresh record highs on Friday as investors flocked to safe-haven assets amid escalating geopolitical tensions and a weakening U.S. dollar, extending a powerful year-end rally in precious metals.
Gold and silver surged to fresh record highs on Friday as investors flocked to safe-haven assets amid escalating geopolitical tensions and a weakening U.S. dollar, extending a powerful year-end rally in precious metals.
Spot gold was last up 0.6% at $4,506.76 an ounce by 21:55 ET (02:55 GMT), after jumping to a new record peak of $4,530.60/oz earlier in the day.
U.S. Gold Futures for February delivery rose 0.7% to $4,537.55.
Gold prices were set to jump nearly 3% this week as investors sought protection against rising global uncertainty.
Spot silver prices surged over 4% to hit a new record high of $75.14/oz, set to jump over 7% this week.
Geopolitical developments were a key driver of the move. Safe-haven demand increased after the U.S. stepped up pressure on Venezuela's oil exports, a move that raised concerns about supply disruptions and broader regional instability.
Adding to market unease, President Donald Trump said on social media that U.S. forces had carried out strikes against militant targets in Nigeria, highlighting Washington's willingness to use military force in multiple regions.
Silver tracked gold's gains, buoyed not only by its defensive appeal but also by its industrial use, particularly in electronics and clean-energy technologies.
Strong investment inflows and limited availability amplified price moves during holiday-thinned trading conditions.
The rally was further underpinned by weakness in the U.S. dollar, which slipped against a basket of major currencies.
The dollar has come under pressure amid growing expectations that the Federal Reserve will begin easing monetary policy in 2026 as inflation shows signs of cooling and economic growth moderates.
A softer dollar typically boosts demand for dollar-denominated commodities by making them cheaper for holders of other currencies.
Lower U.S. Treasury yields have also supported non-interest-bearing assets such as gold, as investors reassess the outlook for U.S. rates and shift portfolios toward stores of value.
With liquidity likely to remain thin through the holiday period, price swings could be exaggerated. Still, analysts said the broader fundamentals point to continued strength in gold and silver into the new year.
 Gold’s rally since 2024 has followed a textbook expansion–consolidation rhythm. Each impulse wave has been respected by the market, and each pause has strengthened the overall structure.
China set the yuan's daily reference rate at a level that was below market estimates by a record margin, in the latest sign of policymakers' intention to slow the currency's appreciation.
The People's Bank of China set the yuan's so-called fixing at 7.0358 per dollar, 301 pips weaker than the average estimate of traders and analysts in a Bloomberg survey. The gap between the reference rate — which limits the onshore yuan's moves by 2% on either side — and the forecast was the largest since the survey was initiated in 2018.
The move came after the offshore yuan advanced past the key psychological level of 7 per dollar on Thursday for the first time since September 2024. The PBOC has been using the reference rate to guide the yuan stronger at a measured pace as it tries to appease Beijing's trading partners while protecting its exporters. A rapid rally risks triggering a surge of hot-money inflows that may destabilize China's financial markets.
While the fixing was weaker than the market estimate, it's still stronger than where it was in the previous session. The offshore yuan was little changed at 7.0042.
The PBOC's cautious approach has come on the back of a growing chorus among Wall Street Banks including Goldman Sachs Group Inc. and Bank of America Corp. which expect the Chinese currency to strengthen well beyond 7 in 2026. Even within China, a rising number of local economists and former central bank officials have called for a stronger currency to help rebalance the economy away from exports and reduce trade tensions.
North Korean leader Kim Jong Un ordered the modernization of his country's missile and artillery production, indicating Pyongyang is moving toward expanded output of both nuclear and conventional weapons ahead of its next ruling party congress.
Kim inspected key military-industrial enterprises to review fourth-quarter production of missiles and artillery shells, and approved draft modernization plans to be submitted to the ninth congress of the Workers' Party, the Korean Central News Agency reported Friday.
Pyongyang is expected to hold its next party congress, a key gathering for setting policy goals, early in 2026.
The visit followed Pyongyang's release a day earlier of photos showing progress in the construction of an 8,700-ton nuclear-powered submarine, as well as the testing of a new high-altitude, long-range missile that KCNA said accurately hit a mock target at an altitude of 200 kilometers (124 miles). The moves have heightened tensions on the peninsula after a US nuclear-powered submarine arrived in the South Korean port of Busan earlier this week.
Kim's recent inspections amount to a "carefully choreographed sequence of moves," said Lim Eul-chul, a professor at Kyungnam University's Institute for Far Eastern Studies in Seoul. "While the nuclear-powered submarine symbolizes strategic nuclear deterrence aimed at the US mainland, missiles and artillery shells represent tactical strike capabilities intended for use on the Korean peninsula and in actual combat."
Kim was accompanied by senior officials from the ruling party, missile authority and defense science sector as he received briefings on output and capacity, KCNA said. He called for expanding production plans for next year in line with projected operational needs and for strengthening the technological base of factories to expand capacity in a balanced manner.
Looking ahead, Kim also urged newly planned military-industrial enterprises to proceed on schedule after the party congress and said existing plants should continue upgrading production structures to improve efficiency and practicality.
North Korea could use technological know-how acquired in exchange for supplying Russia with artillery shells, missiles and troops to overhaul its aging arms factories into digitized and automated facilities, a shift that points to ambitions to evolve beyond nuclear deterrence toward a more technology-driven defense industry, Lim said.
Cooling Japanese inflation indicators sent USD/JPY higher on Friday, December 26, countering Japanese government efforts to strengthen the yen through intervention warnings.
Headline inflation dropped to the Bank of Japan's 2% target, supporting a lower neutral interest rate and fewer rate hikes to achieve policy normalization. The softer inflation numbers come after Japan's Finance Minister Satsuki Katayama warned of yen interventions earlier this week. A more dovish BoJ on cooling inflation will increase the threat of a yen intervention, capping USD/JPY gains.
Cooling Japanese inflation and fading bets on a March Fed rate cut challenged the bearish medium- to longer-term outlook for USD/JPY. Nevertheless, monetary policy divergence continues to favor the yen, given the prospect of an incoming Fed Chair favoring lower rates.
Below, I'll discuss the macro backdrop, the near-term price catalysts, and technical levels traders should closely watch.
Tokyo's annual inflation rate fell from 2.7% in November to 2.0% in December, while the so-called core-core inflation rate eased to 2.6% (November: 2.8%). Despite headline inflation dropping to the BoJ's 2% target, the more influential core-core inflation rate remained above the target, supporting further rate hikes.
However, the lower inflation rate suggested fewer rate hikes to achieve price stability, aligning with last week's dovish rate hike. USD/JPY reacted to the inflation numbers, rising from 155.751 to a post-data high of 156.271.
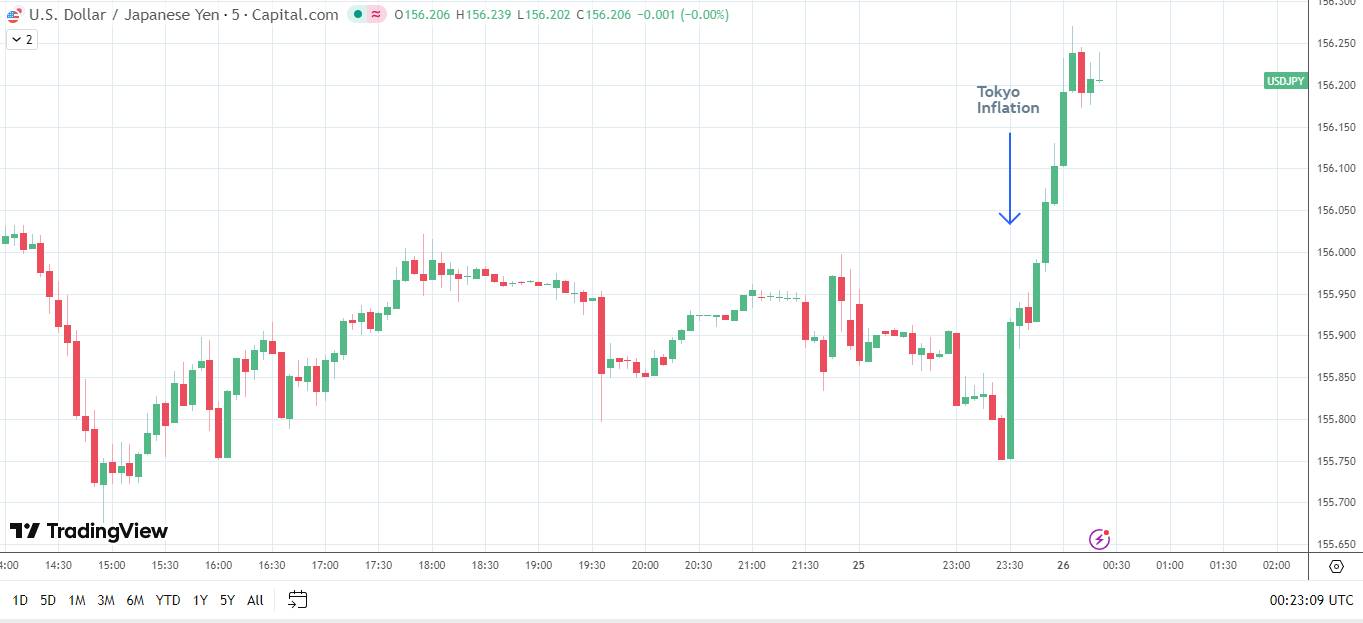 USDJPY – Five Minute Chart – 261225
December's inflation data was the key USD/JPY driver in early trading on Friday. Meanwhile, consumer spending cooled in November, supporting a softer national inflation outlook. Retail sales increased 1% year-on-year in November, down from 1.7% in October.
Crucially, a pullback in spending will also dampen economic momentum, given that private consumption contributes roughly 55% to Japan's GDP.
While inflation and retail sales data weakened demand for the yen, labor market data limited the pullback. Japan's unemployment rate remained steady at 2.6% in November, supporting higher wages. An upswing in wages could boost consumer spending and fuel demand-driven inflation.
However, policymakers would need to see higher wages translate into consumption to raise rates further. While a more dovish BoJ rate path would weaken the yen and send USD/JPY higher, government yen intervention threats would continue to push the pair lower, supporting the cautiously bearish short- to medium-term USD/JPY price outlook.
For the short-term, USD/JPY trends will hinge on the Japanese government's pain threshold for yen weakness, currently at 158, given the recent communication. With USD/JPY sitting around the 156 level, the pair would likely return to 157 before another pullback to 155 levels, given recent price trends. On this basis, the short-term outlook remains cautiously bearish.
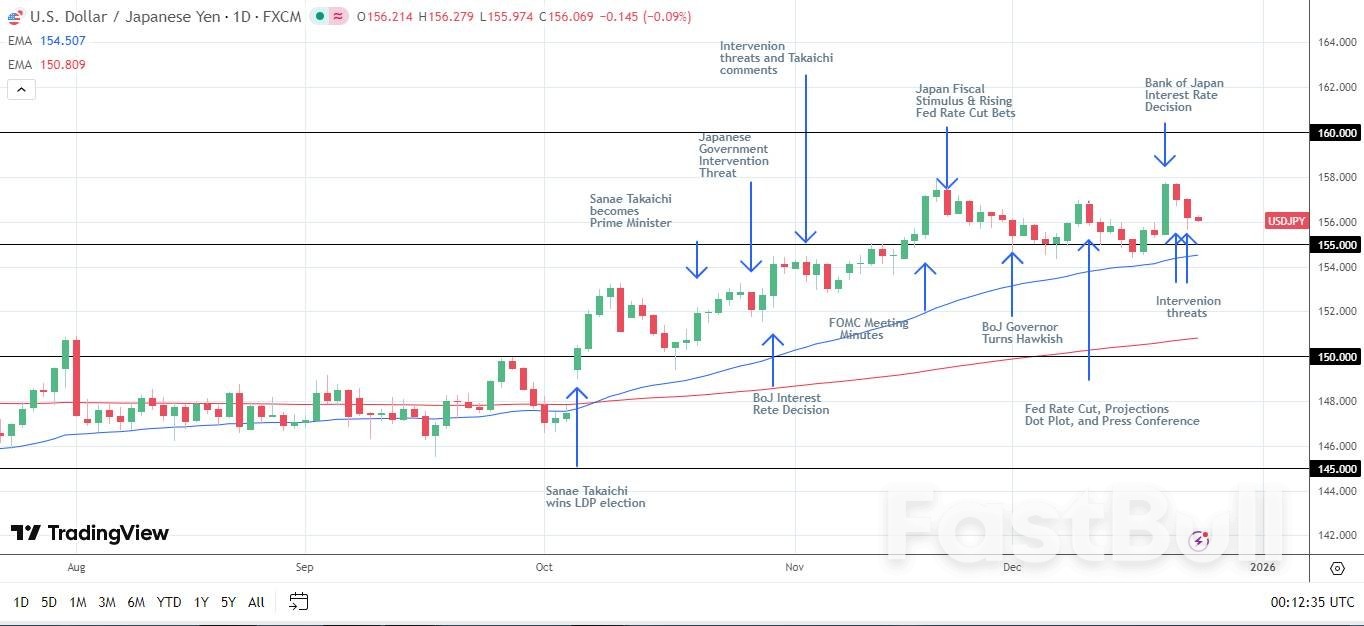 USDJPY – Daily Chart – Intervention Warnings
While USD/JPY advanced on softer retail sales and inflation data, Fed chatter will influence US dollar demand later on Friday.
This week's US GDP and deflator price data tempered bets on a March Fed rate cut, strengthening the US dollar. However, a cooling labor market and November's CPI report continue to support further Fed rate cuts, signaling a bearish short- to medium-term USD/JPY price outlook.
Dovish Fed rhetoric would revive expectations of a March rate cut, weighing on the US dollar.
According to the CME FedWatch Tool, the probability of a March Fed rate cut fell from 58.3% on December 19 to 47.0% on December 26. The sharp drop reflected the influence of the Q3 US GDP report on sentiment.
With markets monitoring technical indicators and fundamentals, they will provide crucial insights into potential USD/JPY price trends.
Looking at the daily chart, USD/JPY traded above its 50-day and 200-day Exponential Moving Averages (EMAs), indicating a bullish bias. While technicals remained bullish, fundamentals are increasingly outweighing the technical structure, suggesting a bearish outlook.
A break below the 155 support level would expose the 50-day EMA. If breached, the 200-day EMA would be the next key technical support level. Importantly, a sustained drop below the EMAs would signal a bearish near-term trend reversal, bringing sub-150 into play.
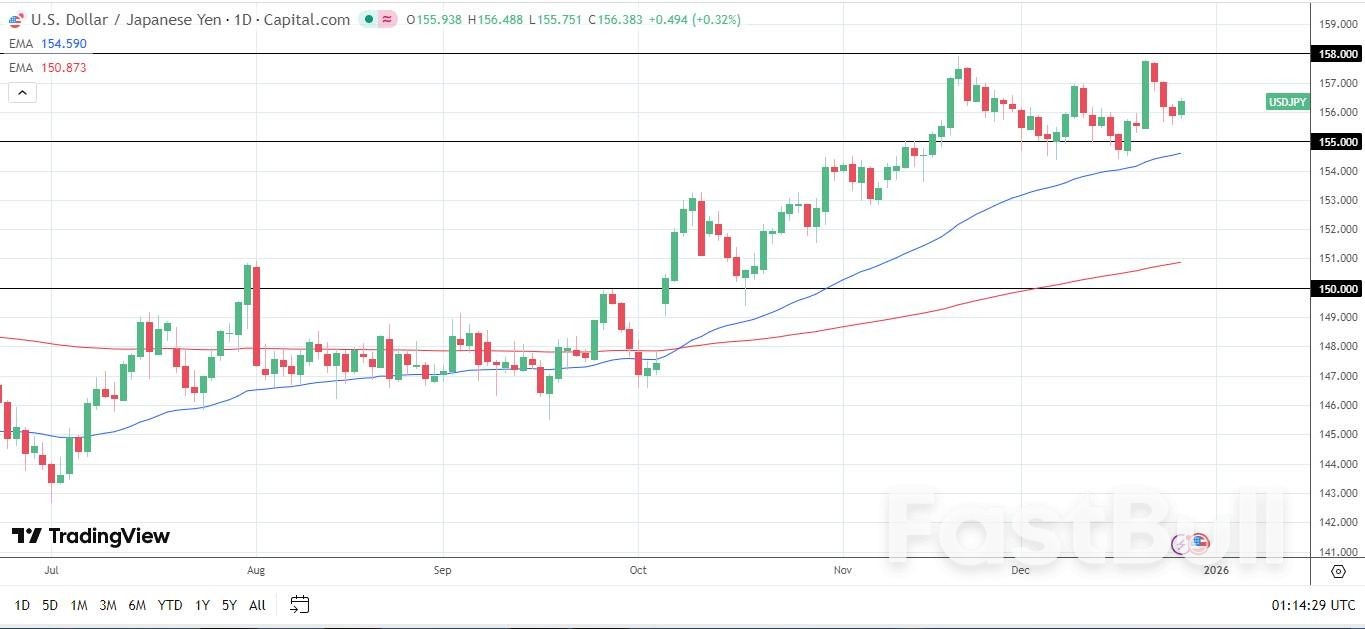 USDJPY – Daily Chart – 261225 – EMAs
In my view, intervention threats will continue to cap USD/JPY upside at 158. Meanwhile, JGB yields would likely bolster yen demand, indicating a negative price outlook. However, the BoJ's neutral interest rate will be pivotal, given recent concerns about sticky US inflation.
A higher neutral interest rate level, neither accommodative nor restrictive, would indicate a more hawkish BoJ rate path and a narrower US-Japan rate differential. A narrower rate differential would make yen carry trades into US assets less profitable, reversing yen carry trades, sending USD/JPY toward 140 over the longer term.
However, upside risks to the bearish outlook include:
These scenarios would weaken the yen and boost demand for the US dollar, sending USD/JPY higher. However, yen intervention warnings are likely to cap the upside at around the 158 level, based on the latest communication.
In summary, USD/JPY trends reflect the Japanese government's focus on forex markets and changing sentiment toward narrowing rate differentials. Market focus will remain on BoJ Governor Ueda and the Fed's outlook on monetary policy and the BoJ's view on the neutral interest rate.
A 1.5% to 2.5% neutral rate would indicate more aggressive BoJ rate hikes, supporting the bearish short- to medium-term outlook for USD/JPY. Furthermore, dovish Fed rhetoric will likely send USD/JPY toward 140 in the 6-12 month time horizon.
728 RM B 7/F GEE LOK IND BLDG NO 34 HUNG TO RD KWUN TONG KLN HONG KONG


White Label
Data API
Web Plug-ins
Poster Maker
Affiliate Program
The risk of loss in trading financial instruments such as stocks, FX, commodities, futures, bonds, ETFs and crypto can be substantial. You may sustain a total loss of the funds that you deposit with your broker. Therefore, you should carefully consider whether such trading is suitable for you in light of your circumstances and financial resources.
No decision to invest should be made without thoroughly conducting due diligence by yourself or consulting with your financial advisors. Our web content might not suit you since we don't know your financial conditions and investment needs. Our financial information might have latency or contain inaccuracy, so you should be fully responsible for any of your trading and investment decisions. The company will not be responsible for your capital loss.
Without getting permission from the website, you are not allowed to copy the website's graphics, texts, or trademarks. Intellectual property rights in the content or data incorporated into this website belong to its providers and exchange merchants.
Not Logged In
Log in to access more features

FastBull Membership
Not yet
Purchase


Log In
Sign Up