• Trade
  • Markets
  • Copy
  • Contests
  • News
  • 24/7
  • Calendar
  • Q&A
  • Chats
Screeners
SYMBOL
LAST
ASK
BID
HIGH
LOW
NET CHG.
%CHG.
SPREAD
SPX
S&P 500 Index
6978.59
6978.59
6978.59
6988.81
6958.82
+28.36
+ 0.41%
--
DJI
Dow Jones Industrial Average
49003.40
49003.40
49003.40
49157.80
48862.52
-408.99
-0.83%
--
IXIC
NASDAQ Composite Index
23817.11
23817.11
23817.11
23865.26
23694.38
+215.76
+ 0.91%
--
USDX
US Dollar Index
95.540
95.620
95.540
97.060
95.330
-1.290
-1.33%
--
EURUSD
Euro / US Dollar
1.20213
1.20221
1.20213
1.20439
1.20078
-0.00179
-0.15%
--
GBPUSD
Pound Sterling / US Dollar
1.38254
1.38261
1.38254
1.38466
1.38138
-0.00215
-0.16%
--
XAUUSD
Gold / US Dollar
5169.55
5170.00
5169.55
5184.86
5157.13
-9.03
-0.17%
--
WTI
Light Sweet Crude Oil
62.409
62.444
62.409
62.501
62.313
-0.028
-0.04%
--

Community Accounts

Signal Accounts
--
Profit Accounts
--
Loss Accounts
--
View More

Become a signal provider

Sell trading signals to earn additional income

View More

Guide to Copy Trading

Get started with ease and confidence

View More

Signal Accounts for Members

All Signal Accounts

Best Return
  • Best Return
  • Best P/L
  • Best MDD
Past 1W
  • Past 1W
  • Past 1M
  • Past 1Y

All Contests

  • All
  • Trump Updates
  • Recommend
  • Stocks
  • Cryptocurrencies
  • Central Banks
  • Featured News
Top News Only
Share

Australia Q4 CPI (All Groups) +3.6% Year-On-Year (Reuters Calculation, Reuters Poll +3.6%)

Share

Aussie Dollar Flat At $0.7012 After CPI Data

Share

Australia Q4 CPI (All Groups) +0.6% Quarter-On-Quarter (Reuters Poll +0.6%)

Share

[US Media: US Immigration And Customs Enforcement Officer Attempts To Enter Ecuadorian Consulate, Ecuador Delivers Protest Note] According To Reports From The New York Times And Other US Media Outlets, The Ecuadorian Ministry Of Foreign Affairs Issued A Statement On The 27th Local Time, Stating That A US Immigration And Customs Enforcement Officer Attempted To Enter The Ecuadorian Consulate In Minneapolis That Day But Was Stopped By Consulate Staff. The Statement Also Said That Ecuador Has Delivered A Protest Note To The US Embassy In Ecuador To Prevent Similar Incidents From Recurring

Share

Australia December Monthly Weighted Median CPI +3.6% Year-On-Year (Reuters Poll +3.40%)

Share

Australia December Monthly Trimmed Mean CPI +3.3% Year-On-Year (Reuters Poll +3.3%)

Share

Australia December Monthly CPI +1.0% Month-On-Month (Reuters Poll +0.70%)

Share

Australian Bureau Of Statistics - Australia December Monthly Trimmed Mean CPI +0.2% Month-On-Month (Reuters Poll +0.20%)

Share

Yield On 10-Year Japanese Government Bond Falls 1.0 Basis Points To 2.275%

Share

Malaysia's Ringgit Rises 0.5% To 3.925 Per USA Dollar, Strongest Level Since May 2018

Share

Yield On 2-Year Japanese Government Bond Falls 1.0 Basis Points To 1.265%

Share

Yield On 5-Year Japanese Government Bond Falls 1.0 Basis Points To 1.700%

Share

Dollar/Yen Up 0.23% At 152.53 In Early Trade After Dropping 1.3% In Previous Session

Share

Bank Of Japan Minutes: One Member Said Underlying Inflation Likely To Accelerate Gradually As Wage Growth Seen Maintaining Momentum

Share

Bank Of Japan Minutes: One Member Said Recent Rise In Food Prices Are Driven Not Just By One-Off Supply Factors But Increases In Labour, Distribution Costs

Share

Bank Of Japan Minutes: Many Members Said Inflation Somewhat Overshooting Projections Made In October

Share

Bank Of Japan Minutes: One Member Said Government's Stimulus Package Will Push Up Growth For Coming 1 To 2 Years

Share

Bank Of Japan Minutes: One Member Said Timely Rate Hike Will Help Curb Future Inflationary Pressure, Rise In Long-Term Interest Rates

Share

Bank Of Japan Minutes: One Member Said Risk Premium Is Among Factors Behind Volatility In Long-Term Interest Rates, Must Be Vigilant To Their Moves

Share

Bank Of Japan Minutes: One Member Said Long-Term Rate Moves Have Been Somewhat Rapid But Could Be Interpreted As Markets Pricing In Chance Of Sustained Achievement Of Bank Of Japan's Price Target

TIME
ACT
FCST
PREV
U.S. Dallas Fed New Orders Index (Jan)

A:--

F: --

P: --

U.S. 2-Year Note Auction Avg. Yield

A:--

F: --

P: --

U.K. BRC Shop Price Index YoY (Jan)

A:--

F: --

P: --

China, Mainland Industrial Profit YoY (YTD) (Dec)

A:--

F: --

P: --

Germany 2-Year Schatz Auction Avg. Yield

A:--

F: --

P: --

Mexico Trade Balance (Dec)

A:--

F: --

P: --

U.S. Weekly Redbook Index YoY

A:--

F: --

P: --

U.S. S&P/CS 20-City Home Price Index YoY (Not SA) (Nov)

A:--

F: --

P: --

U.S. S&P/CS 20-City Home Price Index MoM (SA) (Nov)

A:--

F: --

P: --
U.S. FHFA House Price Index MoM (Nov)

A:--

F: --

P: --

U.S. FHFA House Price Index (Nov)

A:--

F: --

P: --

U.S. FHFA House Price Index YoY (Nov)

A:--

F: --

P: --
U.S. S&P/CS 10-City Home Price Index YoY (Nov)

A:--

F: --

P: --

U.S. S&P/CS 10-City Home Price Index MoM (Not SA) (Nov)

A:--

F: --

P: --

U.S. S&P/CS 20-City Home Price Index (Not SA) (Nov)

A:--

F: --

P: --

U.S. S&P/CS 20-City Home Price Index MoM (Not SA) (Nov)

A:--

F: --

P: --

U.S. Richmond Fed Manufacturing Composite Index (Jan)

A:--

F: --

P: --

U.S. Conference Board Present Situation Index (Jan)

A:--

F: --

P: --

U.S. Conference Board Consumer Expectations Index (Jan)

A:--

F: --

P: --

U.S. Richmond Fed Manufacturing Shipments Index (Jan)

A:--

F: --

P: --

U.S. Richmond Fed Services Revenue Index (Jan)

A:--

F: --

P: --

U.S. Conference Board Consumer Confidence Index (Jan)

A:--

F: --

P: --
U.S. 5-Year Note Auction Avg. Yield

A:--

F: --

P: --

U.S. API Weekly Refined Oil Stocks

A:--

F: --

P: --

U.S. API Weekly Crude Oil Stocks

A:--

F: --

P: --

U.S. API Weekly Gasoline Stocks

A:--

F: --

P: --

U.S. API Weekly Cushing Crude Oil Stocks

A:--

F: --

P: --

Australia RBA Trimmed Mean CPI YoY (Q4)

A:--

F: --

P: --

Australia CPI YoY (Q4)

A:--

F: --

P: --

Australia CPI QoQ (Q4)

A:--

F: --

P: --

Germany GfK Consumer Confidence Index (SA) (Feb)

--

F: --

P: --

Germany 10-Year Bund Auction Avg. Yield

--

F: --

P: --

India Industrial Production Index YoY (Dec)

--

F: --

P: --

India Manufacturing Output MoM (Dec)

--

F: --

P: --

U.S. MBA Mortgage Application Activity Index WoW

--

F: --

P: --

Canada Overnight Target Rate

--

F: --

P: --

BOC Monetary Policy Report
U.S. EIA Weekly Crude Stocks Change

--

F: --

P: --

U.S. EIA Weekly Cushing, Oklahoma Crude Oil Stocks Change

--

F: --

P: --

U.S. EIA Weekly Crude Demand Projected by Production

--

F: --

P: --

U.S. EIA Weekly Crude Oil Imports Changes

--

F: --

P: --

U.S. EIA Weekly Heating Oil Stock Changes

--

F: --

P: --

U.S. EIA Weekly Gasoline Stocks Change

--

F: --

P: --

BOC Press Conference
Russia PPI MoM (Dec)

--

F: --

P: --

Russia PPI YoY (Dec)

--

F: --

P: --

U.S. Target Federal Funds Rate Lower Limit (Overnight Reverse Repo Rate)

--

F: --

P: --

U.S. Interest Rate On Reserve Balances

--

F: --

P: --

U.S. Federal Funds Rate Target

--

F: --

P: --

U.S. Target Federal Funds Rate Upper Limit (Excess Reserves Ratio)

--

F: --

P: --

FOMC Statement
FOMC Press Conference
Brazil Selic Interest Rate

--

F: --

P: --

Australia Import Price Index YoY (Q4)

--

F: --

P: --

Japan Household Consumer Confidence Index (Jan)

--

F: --

P: --

Turkey Economic Sentiment Indicator (Jan)

--

F: --

P: --

Euro Zone M3 Money Supply (SA) (Dec)

--

F: --

P: --

Euro Zone Private Sector Credit YoY (Dec)

--

F: --

P: --

Q&A with Experts
    • All
    • Chatrooms
    • Groups
    • Friends
    EuroTrader flag
    3463357
    JPY intervention is taken place selling USD bonds for cheap resulting in USD weakness and gold rallying
    @Visitor3463357Yeahh .The United states bonds are actually falling causing the weakness we are witnessing in the dollar index
    Sam flag
    Good morning
    3463090 flag
    good evening
    Sam flag
    What is the view on gold today?
    TRASH 新 ドラゴン flag
    bullish
    Kung Fu flag
    Sam
    What is the view on gold today?
    @Samit's done pumping. Now it's gonna consolidate until London
    Sheriff Se flag
    Good morning, I want to know which criteria qualify one to continue with this computation
    Kung Fu flag
    Sheriff Se
    Good morning, I want to know which criteria qualify one to continue with this computation
    @Sheriff Seare you in the contest?
    Kung Fu flag
    @Sheriff Segood morning to you, Brother
    Sheriff Se flag
    Good morning, this is confusing to me because I registered during the contest period, but I am not confirming whether I am still in the contest
    Adrian Mer flag
    Trading Contest

    Adrian Mer

    ID: 4465924

    2026 FastBull GOLD Global S1 Ongoing
    167
    Rankings
    +268,657.39
    Profit and loss(USD)
    268.66%
    Return rate
    Show your trading skills, PK top traders globally
    Contest details
    Kung Fu flag
    Sheriff Se
    Good morning, this is confusing to me because I registered during the contest period, but I am not confirming whether I am still in the contest
    @Sheriff Seyou should be able to see your contest account under your personal profile. Please check
    Sheriff Se flag
    Yes, I am already seeing this but I am not sure if I am still in the cotest or disqualify
    Khawatir_ flag
    Khawatir_ flag
    Khawatir_ flag
    Tấn Tài Ng flag
    hãy thận trọng fed có thể đi ngược su hướng của Trump fed có thể tăng lãi suất rất mạnh có thể lên 5 đến 10 phần trăm để cứu đồng USD hiện tại 2025 rất giống 1980 khi đó usd cũng bị mất niềm tinh tổng thống cũng kêu fed hạ lãi suất nhưng fed đã tăng lãi lên 21 phần trăm vàng càng tăng mạnh sẽ là mối nguy hiểm của đồng usd tăng lãi có thể gây suy thoái trong nhiều năm nhưng lấy lại được niềm tinh cho đồng USD không loại trừ fed chống lại Trump để tăng lãi
    Facaiter E flag
    Facaiter E flag
    Can anyone tell me why the price suddenly surged? Is there some news?
    3463090 flag
    yes trump speach
    Type here...
    Add Symbol or Code

      No matching data

      All
      Trump Updates
      Recommend
      Stocks
      Cryptocurrencies
      Central Banks
      Featured News
      • All
      • Russia-Ukraine Conflict
      • Middle East Flashpoint
      • All
      • Russia-Ukraine Conflict
      • Middle East Flashpoint
      Search
      Products

      Charts Free Forever

      Chats Q&A with Experts
      Screeners Economic Calendar Data Tools
      Membership Features
      Data Warehouse Market Trends Institutional Data Policy Rates Macro

      Market Trends

      Market Sentiment Order Book Forex Correlations

      Top Indicators

      Charts Free Forever
      Markets

      News

      News Analysis 24/7 Columns Education
      From Institutions From Analysts
      Topics Columnists

      Latest Views

      Latest Views

      Trending Topics

      Top Columnists

      Latest Update

      Signals

      Copy Rankings Latest Signals Become a signal provider AI Rating
      Contests
      Brokers

      Overview Brokers Assessment Rankings Regulators News Claims
      Broker listing Forex Brokers Comparison Tool Live Spread Comparison Scam
      Q&A Complaint Scam Alert Videos Tips to Detect Scam
      More

      Business
      Events
      Careers About Us Advertising Help Center

      White Label

      Data API

      Web Plug-ins

      Affiliate Program

      Awards Institution Evaluation IB Seminar Salon Event Exhibition
      Vietnam Thailand Singapore Dubai
      Fans Party Investment Sharing Session
      FastBull Summit BrokersView Expo
      Recent Searches
        Top Searches
          Markets
          News
          Analysis
          User
          24/7
          Economic Calendar
          Education
          Data
          • Names
          • Latest
          • Prev

          View All

          No data

          Scan to Download

          Faster Charts, Chat Faster!

          Download App
          English
          • English
          • Español
          • العربية
          • Bahasa Indonesia
          • Bahasa Melayu
          • Tiếng Việt
          • ภาษาไทย
          • Français
          • Italiano
          • Türkçe
          • Русский язык
          • 简中
          • 繁中
          Open Account
          Search
          Products
          Charts Free Forever
          Markets
          News
          Signals

          Copy Rankings Latest Signals Become a signal provider AI Rating
          Contests
          Brokers

          Overview Brokers Assessment Rankings Regulators News Claims
          Broker listing Forex Brokers Comparison Tool Live Spread Comparison Scam
          Q&A Complaint Scam Alert Videos Tips to Detect Scam
          More

          Business
          Events
          Careers About Us Advertising Help Center

          White Label

          Data API

          Web Plug-ins

          Affiliate Program

          Awards Institution Evaluation IB Seminar Salon Event Exhibition
          Vietnam Thailand Singapore Dubai
          Fans Party Investment Sharing Session
          FastBull Summit BrokersView Expo

          Gold Forecast: CPI As The Key Catalyst For The Next XAUUSD Move

          ACY

          Commodity

          Forex

          Summary:

          Gold remains structurally bullish, with price consolidating above a key 4H bullish Fair Value Gap after an impulsive expansion.

          · Gold remains structurally bullish, with price consolidating above a key 4H bullish Fair Value Gap after an impulsive expansion.
          · The incoming U.S. CPI release is the primary volatility catalyst, likely determining whether price continues higher or retraces into premium demand zones.
          · Higher-timeframe structure remains intact, suggesting any CPI-driven pullback is corrective unless key imbalance levels fail.

          Structure First, CPI Second

          Gold continues to trade at elevated levels, but the current phase is no longer about expansion — it is about acceptance and reaction.

          After a strong impulsive leg higher, price has paused and begun consolidating near highs. This behavior is consistent with institutional digestion, not distribution. The market is now positioned in a premium zone, waiting for CPI to provide the next liquidity-driven catalyst.

          Rather than invalidating the bullish trend, CPI is more likely to act as a trigger for a retracement into value or a continuation breakout, depending on how inflation data reshapes real yield and dollar expectations.

          Drivers with CPI in Focus

          Inflation Expectations and Real Yield Sensitivity

          Gold is acutely sensitive to inflation outcomes—not simply headline inflation, but how CPI reshapes real interest rate expectations.

          · A cooler-than-expected CPI print would reinforce the narrative of easing inflation pressures, likely pushing real yields lower and supporting gold's upside.
          · A hotter-than-expected CPI print could temporarily lift yields and the U.S. dollar, pressuring gold in the short term through repricing of policy expectations.

          Importantly, even upside CPI surprises may struggle to reverse gold's broader trend unless they signal a sustained re-acceleration of inflation that forces a materially more hawkish stance from the Fed.

          Federal Reserve Policy Repricing Risk

          CPI remains one of the Federal Reserve's most influential data points. Markets are currently positioned for a policy environment where restrictive conditions cannot be sustained indefinitely.

          Gold benefits from:

          · Any CPI outcome that reduces confidence in prolonged tight policy
          · Evidence that inflation is cooling faster than expected, increasing the probability of policy flexibility

          Conversely, CPI-induced volatility can create short-term drawdowns, but these are increasingly viewed by market participants as tactical repositioning opportunities rather than structural reversals.

          Safe-Haven Demand Ahead of High-Impact Data

          As CPI approaches, risk appetite across equities and risk-sensitive assets often becomes more cautious. This environment typically benefits gold, especially when positioning turns defensive ahead of binary macro events.

          Gold's ability to hold elevated levels into major data releases is a signal of underlying strength, suggesting buyers are willing to maintain exposure despite headline risk.

          What the Market Is Telling Us

          Daily Structure – Trend Integrity Remains Intact

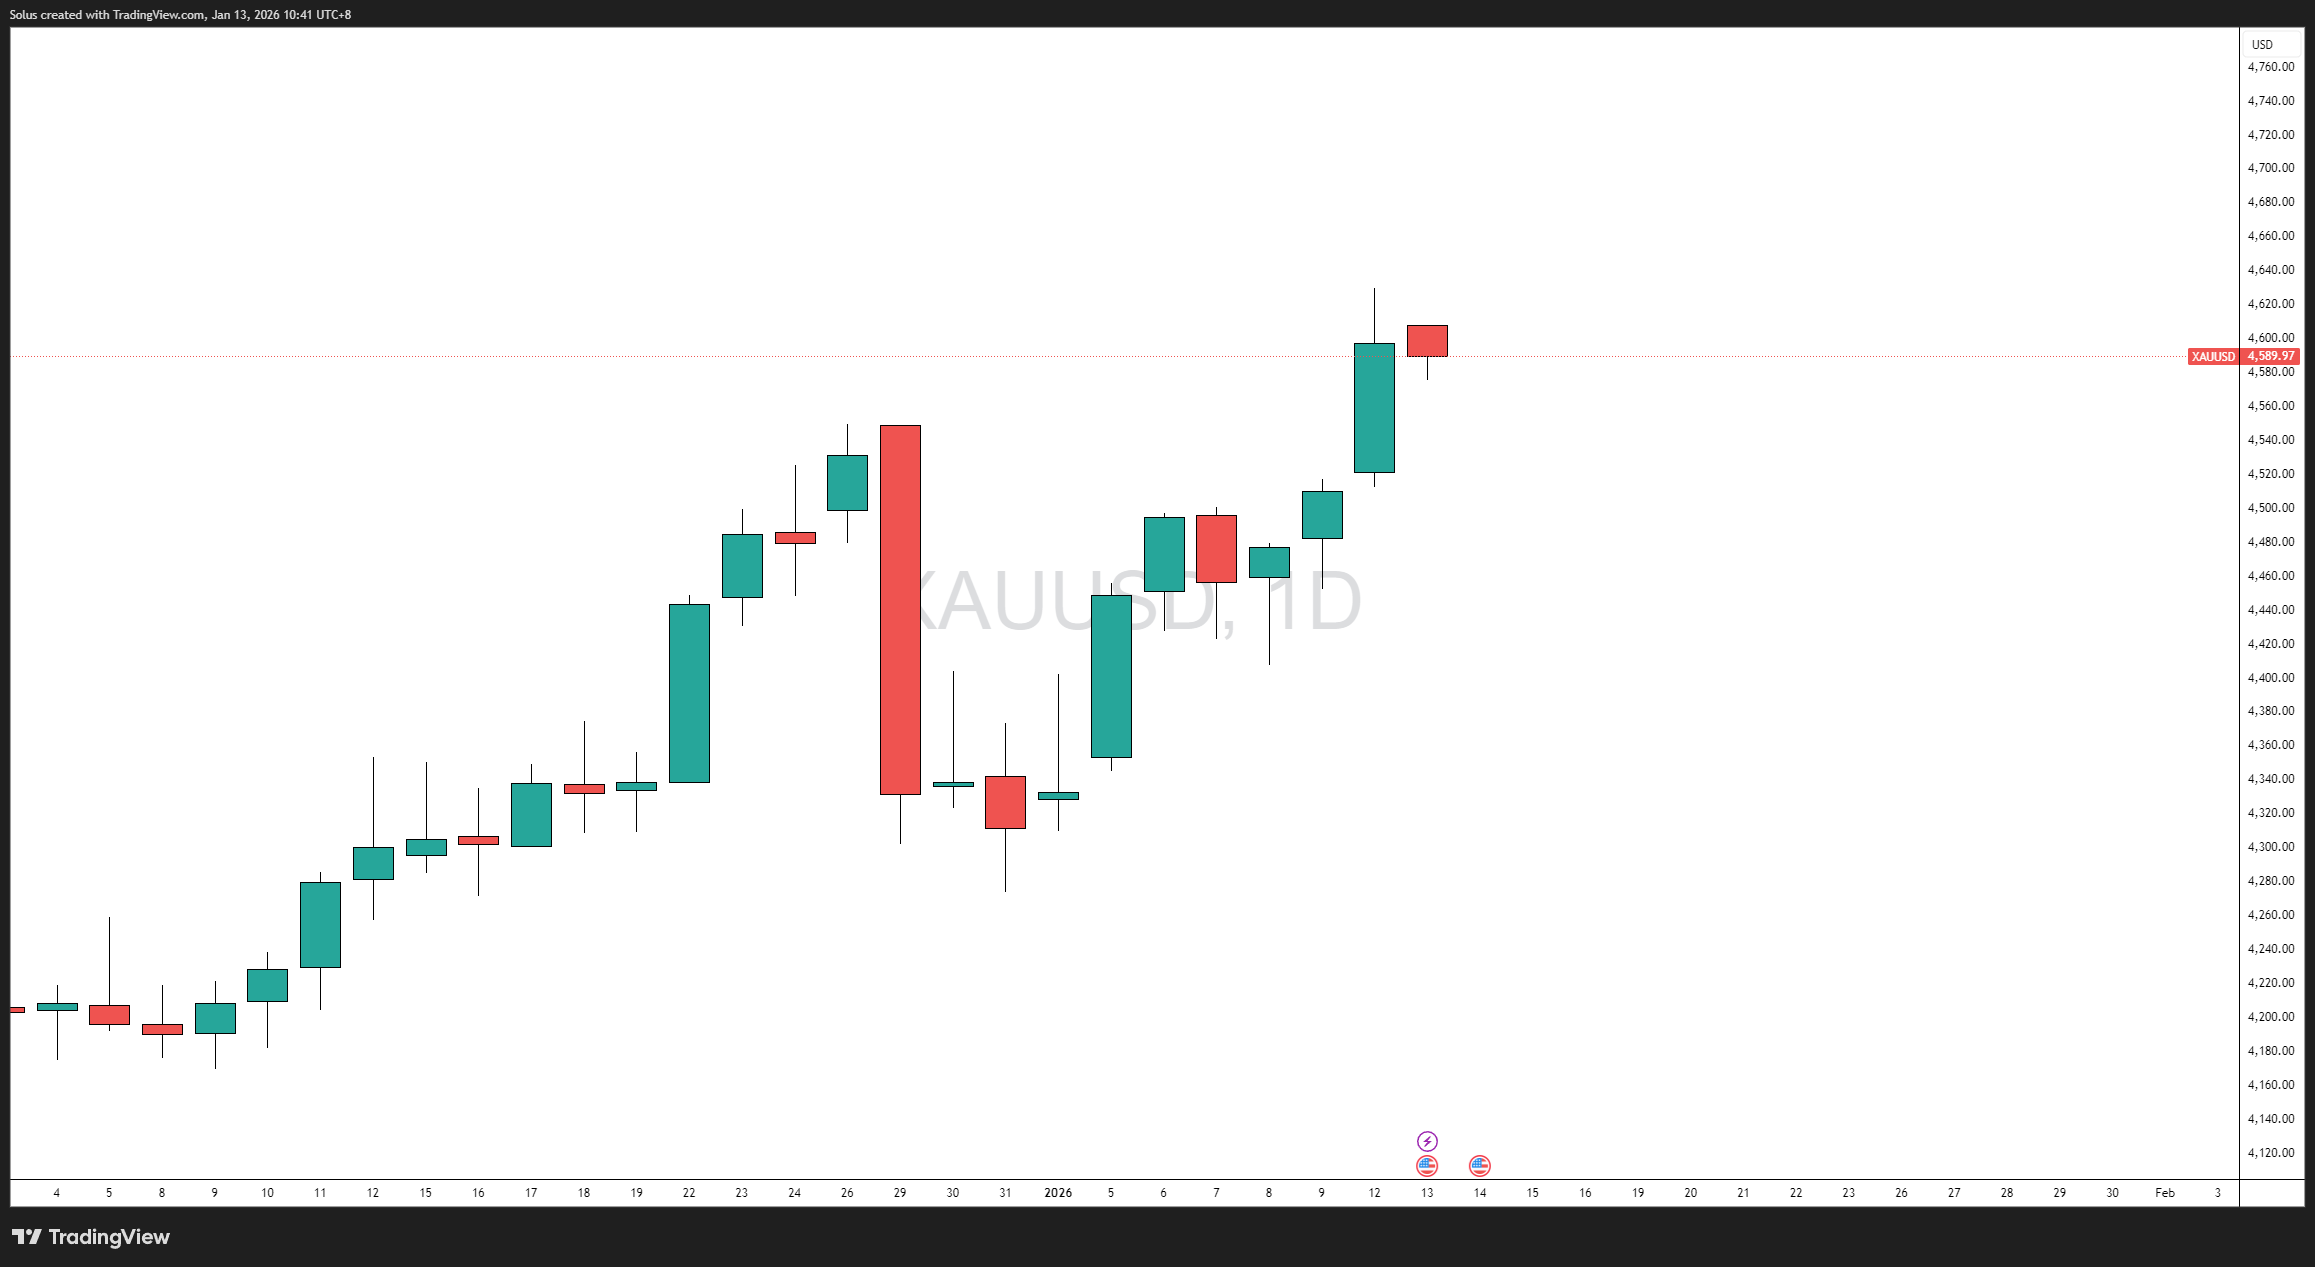
          On the daily timeframe, gold continues to print higher highs and higher lows, maintaining bullish market structure despite intermittent volatility.

          The recent daily pullbacks have:

          · Failed to break structure
          · Respected prior demand zones
          · Shown rejection wicks rather than sustained bearish closes

          This reinforces the idea that sellers lack follow-through at current levels, and that downside moves are primarily liquidity-driven corrections, not trend reversals.

          4H Structure – Bullish Fair Value Gap in Control

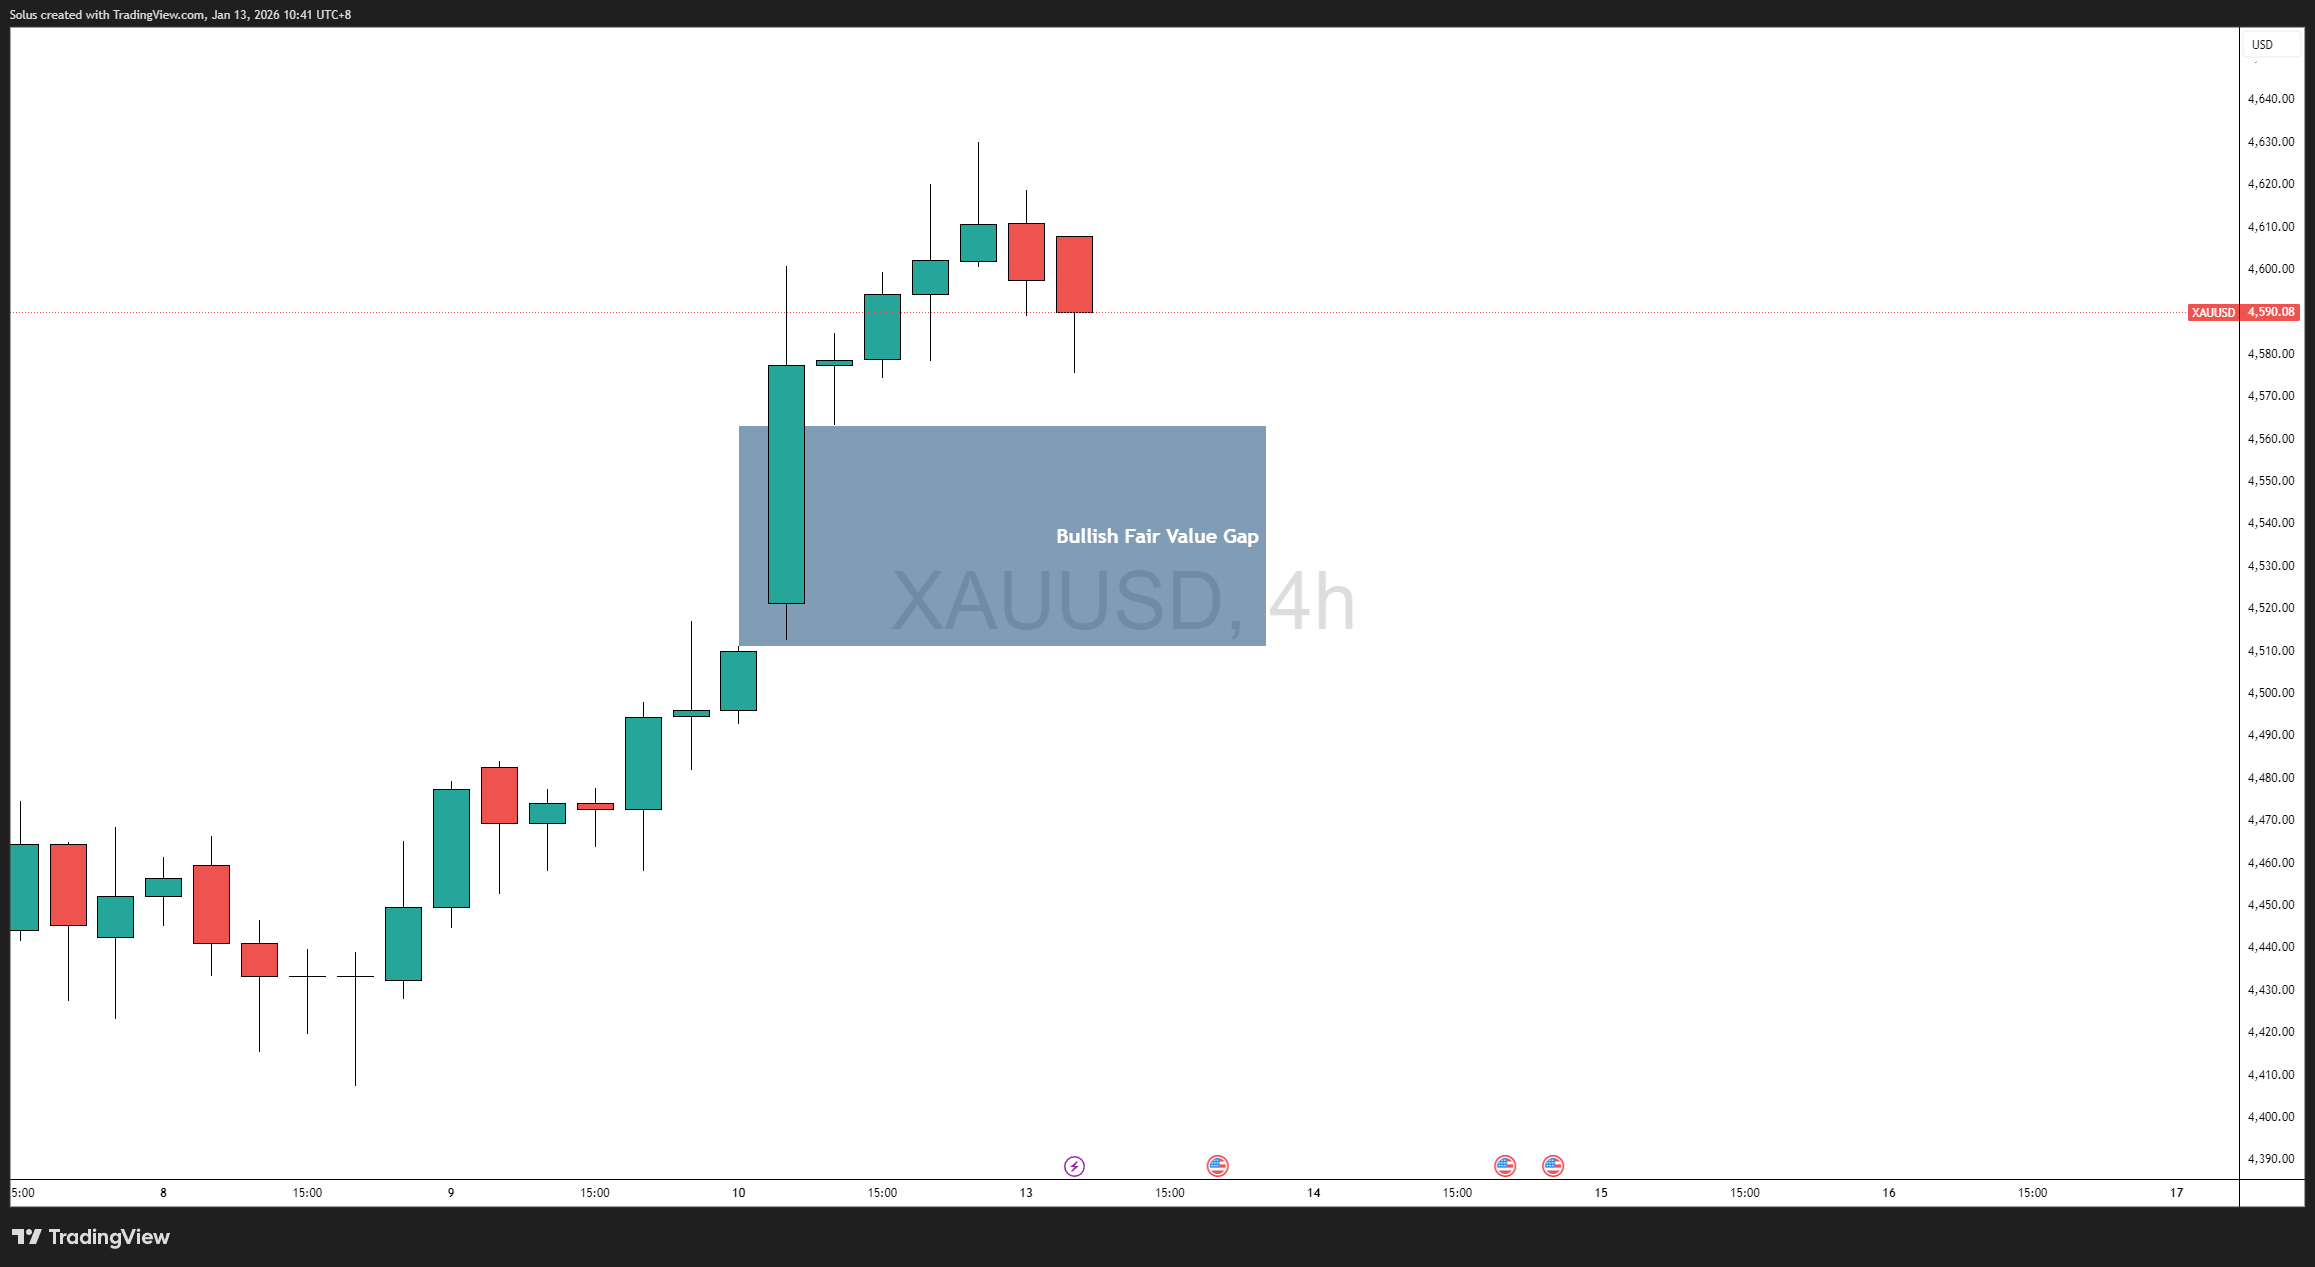
          On the 4-hour chart, gold left behind a clear bullish Fair Value Gap following an aggressive displacement to the upside. Price is currently trading above this imbalance, signaling that buyers remain in control of short-term structure.

          This Fair Value Gap represents:

          · Institutional inefficiency from aggressive buying
          · A high-probability reaction zone if price retraces
          · A technical "decision point" ahead of CPI

          As long as price holds above or reacts cleanly within this FVG, the bullish narrative remains valid.

          CPI as the Liquidity Catalyst

          CPI matters not because it changes the trend — but because it determines where liquidity is taken next.

          If CPI Prints Softer or In-Line

          · Real yields likely compress
          · The U.S. dollar weakens or stalls
          · Gold holds above the 4H FVG or reacts shallowly

          In this scenario, CPI becomes a continuation catalyst, allowing gold to resume expansion toward new highs after rebalancing inefficiencies.

          If CPI Prints Hotter Than Expected

          · Real yields spike temporarily
          · Dollar strength forces a retracement
          · Price likely trades back into the bullish Fair Value Gap

          This scenario does not automatically invalidate the trend. Instead, it creates a mean-reversion move into value, offering structural confirmation if buyers defend the imbalance zone.

          Only a clean breakdown below the FVG with acceptance would suggest a deeper corrective phase.

          Technical Outlook

          Bullish Scenario: FVG Hold and Expansion

          Gold remains bullish if:
          · Price respects the 4H bullish Fair Value Gap
          · CPI does not force sustained acceptance below imbalance
          · Daily structure remains intact

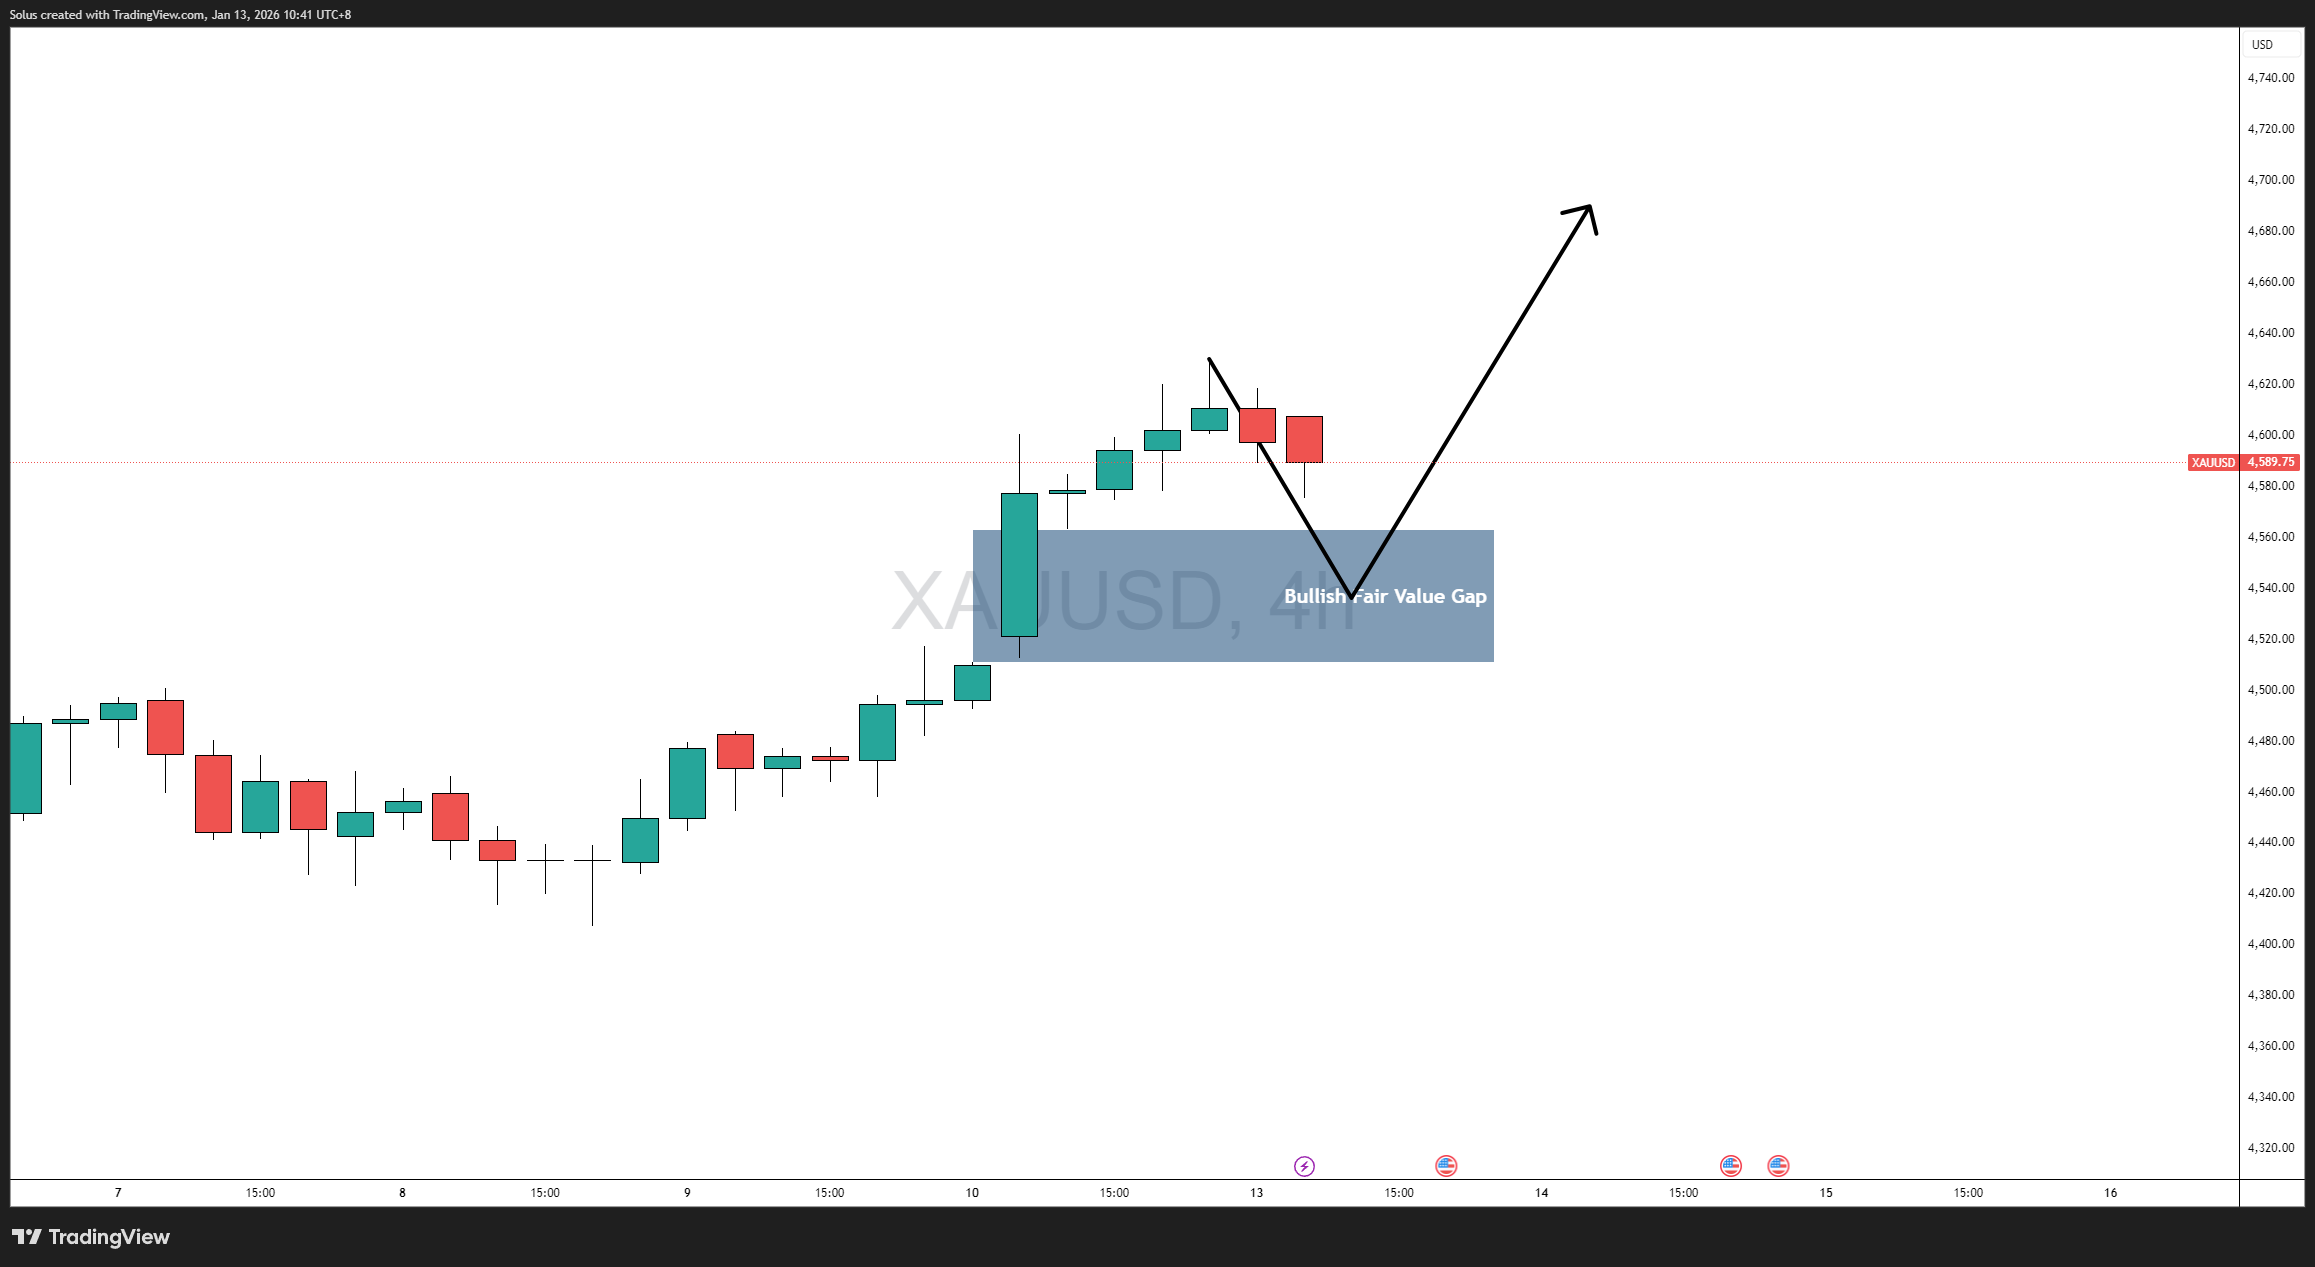
          This sets the stage for continuation toward higher premium zones, driven by institutional positioning rather than retail momentum.

          Bearish Scenario: Acceptance Below Value

          A bearish shift only materializes if:

          · CPI triggers a strong displacement below the Fair Value Gap
          · Price accepts below imbalance with follow-through
          · Daily structure begins to fracture

          Without these conditions, downside moves remain corrective within a broader bullish trend.

          Final Thoughts

          Gold is not breaking down — it is pausing at premium.

          The charts show a market that has expanded aggressively, left behind inefficiencies, and is now waiting for CPI to determine how those inefficiencies are resolved. Until proven otherwise, structure favors buy-side control, with Fair Value Gaps acting as the roadmap rather than lagging indicators.

          CPI will inject volatility — but structure will decide direction.

          Source: ACY

          Risk Warnings and Disclaimers
          You understand and acknowledge that there is a high degree of risk involved in trading. Following any strategies or investment methods may lead to potential losses. The content on the site is provided by our contributors and analysts for information purposes only. You are solely responsible for determining whether any trading assets, securities, strategy, or any other product is suitable for investing based on your own investment objectives and financial situation.
          Add to Favorites
          Share

          Fed's Williams: Interest Rates Are Correct, Cuts on Hold

          Nathaniel Wright

          Central Bank

          Remarks of Officials

          Economic

          John Williams, President of the Federal Reserve Bank of New York, stated that current interest rates are appropriately positioned to support sustainable job creation and economic growth while guiding inflation back to the central bank's 2% target.

          His confidence stems from the belief that the Federal Reserve has gained better control over risks to its dual mandate, particularly after the Federal Open Market Committee (FOMC) projected 75 basis points of rate cuts for 2025.

          Speaking on January 12 at a Council on Foreign Relations event in New York City, Williams affirmed that monetary policy is in a strong position. He is known as a key official who favors a patient approach, preferring to wait for more data before considering further interest rate reductions.

          According to the median estimate from the Fed's latest economic forecast in December, policymakers anticipate only a single quarter-point rate reduction this year.

          Williams Details a Stable Economic Outlook

          Williams provided a specific forecast for the U.S. economy, expressing confidence in the labor market and a predictable path for inflation.

          He expects the unemployment rate to hold steady this year before gradually declining over the next few years. Williams noted that key labor market indicators have returned to pre-pandemic levels, signaling a gradual and healthy normalization. "I want to stress that this has been gradual, with no signs of a sudden increase in layoffs or other quick declines," he said.

          On the inflation front, Williams suggested that import tariffs implemented under the Trump administration would likely have a one-time effect on prices. He projects inflation to peak between 2.75% and 3% in the first half of the year before falling to 2.5% by year-end. He also anticipates that economic growth will continue at an above-average pace.

          Despite this outlook, some policymakers have raised concerns about persistent financial strain, as inflation has remained above the Fed's 2% target for nearly five years.

          A Divided Fed on the Path for Rate Cuts

          The Federal Reserve is not entirely unified on its interest rate strategy. Minutes from the Fed's December meeting, released on December 30, revealed a divided committee.

          The report showed that some officials who voted for a quarter-point rate cut were not fully committed, indicating they could have just as easily supported a decision to hold rates steady. "Some members who favored lowering the policy rate at this meeting mentioned that their decision was very close," the minutes stated.

          The release of these minutes immediately impacted market expectations, with the probability of a rate cut at the next meeting in January dropping to approximately 15%.

          Stephen Stanley, chief U.S. economist at Santander US Capital Markets, commented on the situation. He suggested that the narrow vote in favor of a rate cut highlighted the continued influence of Federal Reserve Chair Jerome Powell over the near-evenly divided committee.

          To stay updated on all economic events of today, please check out our Economic calendar
          Risk Warnings and Disclaimers
          You understand and acknowledge that there is a high degree of risk involved in trading. Following any strategies or investment methods may lead to potential losses. The content on the site is provided by our contributors and analysts for information purposes only. You are solely responsible for determining whether any trading assets, securities, strategy, or any other product is suitable for investing based on your own investment objectives and financial situation.
          Add to Favorites
          Share

          G7 and Partners Seek Strategic Break from Chinese Rare Earth Dominance

          Gerik

          Economic

          Global Finance Leaders Rally to Cut Rare Earth Dependency on China

          In a pivotal meeting held in Washington on Monday, finance ministers from the G7 economies and key partner nations discussed the urgent need to reduce dependence on China for critical mineral supplies, particularly rare earth elements. The meeting, convened by U.S. Treasury Secretary Scott Bessent, brought together representatives from the United States, Japan, the United Kingdom, France, Germany, Italy, Canada, Australia, South Korea, India, and Mexico. The agenda focused on actionable measures to secure and diversify mineral supply chains that are foundational to global industries ranging from defense to renewable energy.
          Rather than pursuing an aggressive decoupling, the collective aim was to adopt what Bessent described as “prudent de-risking.” This approach seeks to lower strategic vulnerability to China's market dominance without destabilizing global trade. China currently controls an overwhelming share of critical mineral processing ranging between 47% and 87% across copper, lithium, cobalt, graphite, and rare earths, according to data from the International Energy Agency.
          This concentration has become a source of significant geopolitical risk, particularly after recent Chinese export restrictions targeting Japan’s dual-use technologies. The urgency of the situation was reinforced by last week’s export ban on materials with both military and civilian applications.

          Policy Options: Price Floors, Incentives, and Market Standards

          Japanese Finance Minister Satsuki Katayama underscored a comprehensive framework of short- to long-term responses. These include setting minimum price levels for rare earths to stabilize markets, offering financial and tax incentives to encourage exploration and processing, and creating new trade and tariff structures to support emerging suppliers. A strong emphasis was placed on enforcing ethical and environmental standards, including labor rights, in future supply contracts a shift that could redefine market entry norms and trade eligibility.
          This strategy introduces a causal link between strategic policy formation and market rebalancing: by reshaping how demand is fulfilled and what conditions are attached to mineral sourcing, participating countries aim to reduce the systemic leverage currently held by China.

          Europe Acknowledges Lag, Vows Independent Action

          German Finance Minister Lars Klingbeil voiced strong support for developing European capacities while cautioning against framing the initiative as an anti-China coalition. He stressed the necessity of increasing EU-level financing, referencing Germany’s new raw materials fund as an example. Klingbeil also emphasized recycling as a vital and underutilized pillar in Europe’s effort to reduce external reliance, citing its untapped potential to broaden domestic supply availability.
          His comments underline a growing consensus that Europe must accelerate both state-supported investment and regulatory initiatives to secure independent access to essential minerals. This illustrates not just a correlation but a deliberate causal pathway: policy inaction directly sustains dependence, while proactive financing and regulation can shift structural outcomes.

          Structural Imperatives: Security and Sustainability

          The strategic minerals at the center of these discussions are essential not only for commercial products like semiconductors and EV batteries but also for national defense and energy resilience. Participants acknowledged that with over 60% of global critical mineral demand coming from this expanded alliance of nations, there exists a powerful incentive to cooperate on joint ventures, stockpiling, and infrastructure development.
          The idea of creating a price floor is particularly notable. It represents a market intervention aimed at reducing volatility and incentivizing investment in mining and refining outside of China. While no joint declaration was issued at the end of the meeting, the cohesion among participants suggests continued momentum.

          Outlook: From Dialogue to Implementation

          Though the talks remain in their early stages, the breadth of participation and alignment signals a turning point in the global minerals landscape. With France set to lead the G7 presidency this year, rare earths and broader supply chain independence are expected to remain central themes. The path forward likely involves a combination of national initiatives and multinational frameworks designed to foster both economic resilience and political autonomy.
          The challenge will be converting this broad agreement into actionable frameworks that reshape trade, investment, and industrial policy. As Katayama warned, commitment not rhetoric will determine whether this emerging coalition can rebalance one of the most strategically sensitive supply chains of the modern era.

          Source: Reuters

          To stay updated on all economic events of today, please check out our Economic calendar
          Risk Warnings and Disclaimers
          You understand and acknowledge that there is a high degree of risk involved in trading. Following any strategies or investment methods may lead to potential losses. The content on the site is provided by our contributors and analysts for information purposes only. You are solely responsible for determining whether any trading assets, securities, strategy, or any other product is suitable for investing based on your own investment objectives and financial situation.
          Add to Favorites
          Share

          Nikkei Soars to Record High on Wall Street Gains and Early Election Hopes

          Gerik

          Economic

          Stocks

          Nikkei Hits Record on Optimism Over Global and Domestic Catalysts

          Japan’s Nikkei 225 index soared to a historic peak on Tuesday, climbing as much as 3.6% to reach 53,814.79, marking a significant bullish milestone for the Japanese equity market. The rally reflected both a delayed reaction to Wall Street’s strong performance and growing investor confidence in the likelihood of domestic stimulus, following reports of a possible snap election by Prime Minister Sanae Takaichi.
          After a public holiday earlier in the week, Japanese markets opened with a strong catch-up momentum. The broader Topix index also hit a record, rising 2.4% to 3,599.31, as optimism swept across both export-heavy and technology sectors.

          Wall Street Momentum Transfers to Tokyo

          The surge followed two consecutive sessions of gains in U.S. markets, where the Dow Jones Industrial Average and the S&P 500 both reached all-time highs. Technology stocks were standout performers, lifting global sentiment and contributing to an upbeat tone in Asian trading. The Nikkei’s rally mirrored the enthusiasm seen globally, suggesting that external tailwinds remain a powerful force behind asset price appreciation.
          A key domestic catalyst for Japan’s market surge came from mounting speculation that Prime Minister Takaichi may dissolve parliament and call an early general election. According to the leader of coalition partner Ishin, Takaichi has been actively weighing the political move, with local media reporting a possible election as soon as next month. This would be her first electoral test since taking office in October and could be an attempt to consolidate her support amid strong approval ratings.
          The potential for a snap election has driven market expectations of expanded fiscal spending, as governments often accompany such moves with voter-friendly stimulus measures. This narrative has strengthened investor belief in a policy mix that includes a weaker yen, rising equity valuations, and declining bond prices factors typically associated with expansionary fiscal strategies.

          Causal Link Between Election Hopes and Market Rally

          The rally in Japanese equities appears to be causally linked to the prospect of political developments that could lead to increased public spending. The expectation that a successful election would empower Takaichi to implement broader fiscal measures has shifted investor behavior toward risk-on positioning, particularly in sectors benefiting from yen depreciation and global demand strength.
          Investor enthusiasm was further amplified by the yen’s depreciation, which enhances the overseas earnings potential of Japanese exporters. The yen was notably weaker compared to Friday’s close, offering a tailwind for automakers and technology companies.
          Toyota Motor surged by 5.1%, while Subaru advanced 4.1%, reflecting stronger outlooks for their international revenue streams. However, the most pronounced gains came from semiconductor-related firms. Advantest, a leading chip-testing equipment manufacturer, soared 8.4%, and Tokyo Electron, which produces chip-making tools, jumped 7.7%. These moves align with a broader global trend of bullish sentiment toward high-tech manufacturing amid strong U.S. tech earnings.

          Investors Downplay U.S. Fed Probe, Focus on Domestic Fundamentals

          Notably, Japanese investors remained relatively unaffected by ongoing political turbulence in the U.S., including the Department of Justice’s criminal probe into Federal Reserve Chair Jerome Powell. While the investigation has rattled global markets and raised concerns about the Fed’s independence, Japanese equities appeared to decouple from that risk narrative, focusing instead on localized political and economic signals.
          With both domestic political developments and global tailwinds driving Japanese equities higher, investor attention will likely remain fixated on signals from the Prime Minister’s office regarding the timing and scope of any early election. Should the election be confirmed, and fiscal stimulus measures accompany it, markets could see continued momentum.
          However, the sustainability of the rally may also depend on global monetary stability and how Japanese policymakers balance fiscal expansion with inflationary control. For now, the combination of political optimism, a softer yen, and strong global cues has propelled Japan’s stock market into uncharted territory.

          Source: Reuters

          To stay updated on all economic events of today, please check out our Economic calendar
          Risk Warnings and Disclaimers
          You understand and acknowledge that there is a high degree of risk involved in trading. Following any strategies or investment methods may lead to potential losses. The content on the site is provided by our contributors and analysts for information purposes only. You are solely responsible for determining whether any trading assets, securities, strategy, or any other product is suitable for investing based on your own investment objectives and financial situation.
          Add to Favorites
          Share

          Indian Rupee Slides as Trump’s Tariff Threat and Weak Asia FX Undermine Sentiment

          Gerik

          Economic

          Forex

          Rupee Faces Renewed Pressure Amid Tariff Uncertainty and Regional Weakness

          The Indian rupee opened under pressure on Tuesday as a confluence of geopolitical tensions and regional currency weakness continued to weigh on investor confidence. The 1-month non-deliverable forward market projected the rupee trading between 90.22 and 90.26 per U.S. dollar, slightly lower than Monday’s close at 90.1525. This decline reflects growing anxiety around U.S. President Donald Trump’s latest tariff warning and the broader risk-off mood in Asia following political instability in the United States.
          On Monday, Trump announced that countries conducting business with Iran would face a 25% tariff on U.S. trade, a move that has yet to be formally codified or clarified through official policy documents. Despite the ambiguity, the announcement has intensified market fears due to India’s long-standing energy and trade ties with Iran. India is among the top destinations for Iranian goods, making it potentially vulnerable if the U.S. adopts a broad interpretation of the new sanctions.
          The threat arrives at a time when India is already contending with an existing 50% U.S. tariff on certain exports one of the highest among major trading partners. The combination of escalating trade barriers and geopolitical tensions has reinforced downward pressure on the rupee, which has already weakened by approximately 0.3% in January following a 5% decline over the course of 2025.

          Intervention Offers Temporary Relief, But Trend Remains Weak

          The Reserve Bank of India (RBI) has intervened at several key moments to stabilize the rupee, including a notable recovery last month after the currency briefly touched an all-time low of 91.0750. However, according to foreign exchange traders, the overall trajectory remains skewed to the downside. Absent a significant reversal in capital flows or a relaxation of global pressure points, the rupee is likely to re-test and potentially breach record lows.
          A currency trader at a global bank emphasized that unless there is a “meaningful shift in flows,” further depreciation seems inevitable. The sentiment reflects not only India’s specific trade dynamics but also broader macroeconomic forces now being shaped by both U.S. domestic politics and global risk aversion.

          Regional Context: Weakness Across Asia and U.S. Political Risk Spillover

          The rupee’s decline is mirrored across Asian currencies, many of which have also slipped amid concerns over political risks in the United States. The announcement of a criminal investigation into Federal Reserve Chair Jerome Powell has sparked a new wave of uncertainty over the independence of U.S. monetary policy, contributing to general investor unease and shifting capital flows away from emerging markets.
          While the direct connection between the Powell probe and the rupee is more correlational than causal, the overall environment of instability and lack of policy clarity in the U.S. amplifies risk sensitivity for vulnerable emerging markets like India.

          Key Market Indicators Reflect Bearish Sentiment

          Broader market indicators support the bearish narrative for the rupee. The U.S. dollar index was up at 98.97, suggesting sustained dollar strength against a basket of global currencies. Brent crude, a key input for India’s import bill, rose modestly by 0.2% to $64 per barrel, adding to concerns over trade imbalances. Meanwhile, the 10-year U.S. Treasury yield hovered at 4.18%, reflecting resilience in U.S. bond markets despite political noise.
          Foreign institutional investors remained net sellers, offloading $409 million in Indian equities and $14.2 million in Indian bonds on January 9, according to NSDL data. These persistent outflows highlight continued capital flight and reinforce downward momentum on the rupee.

          Outlook: Persistent Vulnerability Amid External Shocks

          As long as geopolitical tensions and policy ambiguity persist, the rupee is likely to face sustained depreciation pressure. While the RBI may offer tactical support, the structural factors undermining confidence in the currency including trade risks, foreign investor outflows, and global volatility continue to dominate.
          Without a clear reversal in either geopolitical rhetoric or capital market behavior, the rupee’s trajectory suggests a return to record lows may not be far off. The key inflection points ahead will likely be tied to whether Trump’s tariff threats materialize into policy and whether India can navigate shifting alliances without further economic disruption.

          Source: Reuters

          To stay updated on all economic events of today, please check out our Economic calendar
          Risk Warnings and Disclaimers
          You understand and acknowledge that there is a high degree of risk involved in trading. Following any strategies or investment methods may lead to potential losses. The content on the site is provided by our contributors and analysts for information purposes only. You are solely responsible for determining whether any trading assets, securities, strategy, or any other product is suitable for investing based on your own investment objectives and financial situation.
          Add to Favorites
          Share

          Ukraine War's Grim Milestone: Longer Than Soviet-Nazi War

          James Riley

          Remarks of Officials

          Russia-Ukraine Conflict

          Economic

          Political

          The Russia-Ukraine war has reached a somber new landmark, officially surpassing the duration of the Soviet Union's fight against Nazi Germany in World War II. The conflict has now stretched beyond 1,419 days, exceeding the 1,418 days from the German invasion in June 1941 to its defeat in May 1945.

          Unlike the Red Army's historic advance from the Volga River to Berlin, the current war is a grinding and tragic battle of attrition. While Russia maintains momentum on the battlefield, its progress is a slow and deadly slog. According to a report in The Times of London, Russian forces in the Donetsk region have advanced only about 30 miles from their starting positions despite prolonged combat.

          The Staggering Human Cost of the Conflict

          The human toll of this protracted war is immense, with estimates suggesting hundreds of thousands of casualties on both sides. Ukraine's military has been sustained by billions of dollars in weapons, training, and financial aid from NATO and other Western allies.

          A recent study by the BBC's Russian service and Mediazona found that at least 160,000 Russian soldiers have been killed. However, the actual number remains uncertain; it could be significantly higher, or potentially lower, as casualty figures are often weaponized for propaganda by both sides.

          Meanwhile, international observers widely believe Ukraine's casualties could be several times higher than Russia's. The conflict is effectively wiping out a generation of young men from both nations.

          Ukraine's Military Swells Amid Protracted War

          One of the war's most significant consequences is the transformation of Ukraine's armed forces. Analysis from The Wall Street Journal notes that when the conflict ends, Ukraine will possess a military that is larger and more battle-hardened than any of its European supporters.

          This creates a long-term challenge for both Ukraine and the continent. Sustaining a force of 800,000 troops and vast amounts of equipment will be one of Kyiv's most difficult post-war tasks. To address a looming cash crunch and keep its army fighting, European Union leaders recently agreed to lend Ukraine 90 billion euros (approximately $105 billion).

          Ukrainian officials continue to warn of new Russian offensives, particularly in the north near the city of Sumy. This comes as the Kremlin still legally defines the conflict as a "special military operation," a status that stops short of a full declaration of war that would require mass societal mobilization.

          Geopolitical Stalemate and Lingering Tensions

          Despite the devastating cost, a clear diplomatic solution remains elusive. Peace efforts by the Trump administration have not succeeded, though communication channels between Washington and Moscow are still active.

          Western leaders have consistently affirmed their support for Ukraine, accusing Russia of prolonging the war. At the same time, many have been slow to acknowledge Russia's long-stated grievances regarding NATO's eastward expansion, which Moscow cites as a core driver of the conflict.

          President Trump's position has appeared complex; he has hinted at understanding Russia's security concerns while also reportedly authorizing U.S. intelligence support for Ukrainian drone attacks deep inside Russian territory. As both Ukrainian President Volodymyr Zelensky and Russian leader Vladimir Putin vie for his attention, the geopolitical landscape remains tense and uncertain.

          To stay updated on all economic events of today, please check out our Economic calendar
          Risk Warnings and Disclaimers
          You understand and acknowledge that there is a high degree of risk involved in trading. Following any strategies or investment methods may lead to potential losses. The content on the site is provided by our contributors and analysts for information purposes only. You are solely responsible for determining whether any trading assets, securities, strategy, or any other product is suitable for investing based on your own investment objectives and financial situation.
          Add to Favorites
          Share

          Natural Gas Price Forecast: Breakdown Keeps Pressure On Prices

          Justin

          Forex

          Commodity

          Price Stalls After Breakdown Below Key Support

          Natural gas remained stalled near the trend low of $3.13 on Monday, as it traded higher for the day and inside Friday's range. Monday's high was $3.43 and the low $3.18. This shows minor support near the 78.6% Fibonacci retracement area at $3.24. Friday's close at $3.14 confirmed a breakdown from that potential support area. Although minor strength was seen on Monday, natural gas remains below the 200-day moving average, which broke last week as support, and testing support near the uptrend line at the bottom of a rising channel. A breakdown of the channel confirmed with Friday's close below the line.

          Reclaim Levels Needed to Ease Downside Pressure

          Before there were signs of strength from the current low that could signal further upside, the lower swing high at $3.63 would need to be reclaimed, along with the 200-day average, now at $3.55. Until then, natural gas is showing continued downward pressure that could take it to lower price levels. Potential support around a long-term uptrend is next. If it was hit today, it would be around $3.03.

          Fibonacci and ABCD Targets Define Lower Support Zone

          A little below the trendline is a relatively large price range starting from the 88.6% retracement level at $2.95. That retracement level is followed by a 100% projected target for a falling ABCD pattern at $2.89. It shows when the decline in the second leg down (CD) off the December peak (AB), matches the drop in the first downswing (AB), and therefore it identifies a possible pivot level.

          Monthly Structure Supports Potential Long-Term Support

          On the monthly chart, natural gas has two higher monthly lows that occurred near the lower price zone. October's low was at $2.89 and the higher low in September was at $2.77. So far, during the bearish correction. Potentially, this supports the likelihood of support being seen near the 88.6% level or a little lower. It is interesting to note that the previous bearish measured move from the March peak ended once price was down by 46.6%. A similar percentage decline for the current decline will end near the ABCD target. In summary, there are at least five-indicators pointing to likely support near the 88.6% price zone, in case it is approached.

          Source: FX Empire

          Risk Warnings and Disclaimers
          You understand and acknowledge that there is a high degree of risk involved in trading. Following any strategies or investment methods may lead to potential losses. The content on the site is provided by our contributors and analysts for information purposes only. You are solely responsible for determining whether any trading assets, securities, strategy, or any other product is suitable for investing based on your own investment objectives and financial situation.
          Add to Favorites
          Share
          FastBull
          Copyright © 2026 FastBull Ltd

          728 RM B 7/F GEE LOK IND BLDG NO 34 HUNG TO RD KWUN TONG KLN HONG KONG

          TelegramInstagramTwitterfacebooklinkedin
          App Store Google Play Google Play
          Products
          Charts

          Chats

          Q&A with Experts
          Screeners
          Economic Calendar
          Data
          Tools
          Membership
          Features
          Function
          Markets
          Copy Trading
          Latest Signals
          Contests
          News
          Analysis
          24/7
          Columns
          Education
          Company
          Careers
          About Us
          Contact Us
          Advertising
          Help Center
          Feedback
          User Agreement
          Privacy Policy
          Personal Information Protection Statement
          Business

          White Label

          Data API

          Web Plug-ins

          Poster Maker

          Affiliate Program

          Risk Disclosure

          The risk of loss in trading financial instruments such as stocks, FX, commodities, futures, bonds, ETFs and crypto can be substantial. You may sustain a total loss of the funds that you deposit with your broker. Therefore, you should carefully consider whether such trading is suitable for you in light of your circumstances and financial resources.

          No decision to invest should be made without thoroughly conducting due diligence by yourself or consulting with your financial advisors. Our web content might not suit you since we don't know your financial conditions and investment needs. Our financial information might have latency or contain inaccuracy, so you should be fully responsible for any of your trading and investment decisions. The company will not be responsible for your capital loss.

          Without getting permission from the website, you are not allowed to copy the website's graphics, texts, or trademarks. Intellectual property rights in the content or data incorporated into this website belong to its providers and exchange merchants.

          Not Logged In

          Log in to access more features

          Connect Broker
          Become a signal provider
          Help Center
          Customer Service
          Dark Mode
          Price Up/Down Colors

          Log In

          Sign Up

          Position
          Layout
          Fullscreen
          Default to Chart
          The chart page opens by default when you visit fastbull.com