Markets
News
Analysis
User
24/7
Economic Calendar
Education
Data
- Names
- Latest
- Prev


Signal Accounts for Members
All Signal Accounts
All Contests


U.K. Trade Balance Non-EU (SA) (Oct)A:--
F: --
P: --
U.K. Trade Balance (Oct)A:--
F: --
P: --
U.K. Services Index MoMA:--
F: --
P: --
U.K. Construction Output MoM (SA) (Oct)A:--
F: --
P: --
U.K. Industrial Output YoY (Oct)A:--
F: --
P: --
U.K. Trade Balance (SA) (Oct)A:--
F: --
P: --
U.K. Trade Balance EU (SA) (Oct)A:--
F: --
P: --
U.K. Manufacturing Output YoY (Oct)A:--
F: --
P: --
U.K. GDP MoM (Oct)A:--
F: --
P: --
U.K. GDP YoY (SA) (Oct)A:--
F: --
P: --
U.K. Industrial Output MoM (Oct)A:--
F: --
P: --
U.K. Construction Output YoY (Oct)A:--
F: --
P: --
France HICP Final MoM (Nov)A:--
F: --
P: --
China, Mainland Outstanding Loans Growth YoY (Nov)A:--
F: --
P: --
China, Mainland M2 Money Supply YoY (Nov)A:--
F: --
P: --
China, Mainland M0 Money Supply YoY (Nov)A:--
F: --
P: --
China, Mainland M1 Money Supply YoY (Nov)A:--
F: --
P: --
India CPI YoY (Nov)A:--
F: --
P: --
India Deposit Gowth YoYA:--
F: --
P: --
Brazil Services Growth YoY (Oct)A:--
F: --
P: --
Mexico Industrial Output YoY (Oct)A:--
F: --
P: --
Russia Trade Balance (Oct)A:--
F: --
P: --
Philadelphia Fed President Henry Paulson delivers a speech
Canada Building Permits MoM (SA) (Oct)A:--
F: --
P: --
Canada Wholesale Sales YoY (Oct)A:--
F: --
P: --
Canada Wholesale Inventory MoM (Oct)A:--
F: --
P: --
Canada Wholesale Inventory YoY (Oct)A:--
F: --
P: --
Canada Wholesale Sales MoM (SA) (Oct)A:--
F: --
P: --
Germany Current Account (Not SA) (Oct)A:--
F: --
P: --
U.S. Weekly Total Rig CountA:--
F: --
P: --
U.S. Weekly Total Oil Rig CountA:--
F: --
P: --
Japan Tankan Large Non-Manufacturing Diffusion Index (Q4)--
F: --
P: --
Japan Tankan Small Manufacturing Outlook Index (Q4)--
F: --
P: --
Japan Tankan Large Non-Manufacturing Outlook Index (Q4)--
F: --
P: --
Japan Tankan Large Manufacturing Outlook Index (Q4)--
F: --
P: --
Japan Tankan Small Manufacturing Diffusion Index (Q4)--
F: --
P: --
Japan Tankan Large Manufacturing Diffusion Index (Q4)--
F: --
P: --
Japan Tankan Large-Enterprise Capital Expenditure YoY (Q4)--
F: --
P: --
U.K. Rightmove House Price Index YoY (Dec)--
F: --
P: --
China, Mainland Industrial Output YoY (YTD) (Nov)--
F: --
P: --
China, Mainland Urban Area Unemployment Rate (Nov)--
F: --
P: --
Saudi Arabia CPI YoY (Nov)--
F: --
P: --
Euro Zone Industrial Output YoY (Oct)--
F: --
P: --
Euro Zone Industrial Output MoM (Oct)--
F: --
P: --
Canada Existing Home Sales MoM (Nov)--
F: --
P: --
Euro Zone Total Reserve Assets (Nov)--
F: --
P: --
U.K. Inflation Rate Expectations--
F: --
P: --
Canada National Economic Confidence Index--
F: --
P: --
Canada New Housing Starts (Nov)--
F: --
P: --
U.S. NY Fed Manufacturing Employment Index (Dec)--
F: --
P: --
U.S. NY Fed Manufacturing Index (Dec)--
F: --
P: --
Canada Core CPI YoY (Nov)--
F: --
P: --
Canada Manufacturing Unfilled Orders MoM (Oct)--
F: --
P: --
Canada Manufacturing New Orders MoM (Oct)--
F: --
P: --
Canada Core CPI MoM (Nov)--
F: --
P: --
Canada Manufacturing Inventory MoM (Oct)--
F: --
P: --
Canada CPI YoY (Nov)--
F: --
P: --
Canada CPI MoM (Nov)--
F: --
P: --
Canada CPI YoY (SA) (Nov)--
F: --
P: --
Canada Core CPI MoM (SA) (Nov)--
F: --
P: --


No matching data
Latest Views
Latest Views
Trending Topics
Top Columnists
Latest Update
White Label
Data API
Web Plug-ins
Affiliate Program
View All

No data
Canada’s economy is likely in the early stages of a recession, according to forecasters, as unemployment rises and exports fall because of a trade war with the US.
Economists surveyed by Bloomberg say output will shrink 1% on an annualized basis in the second quarter and 0.1% in the third quarter, a technical recession.
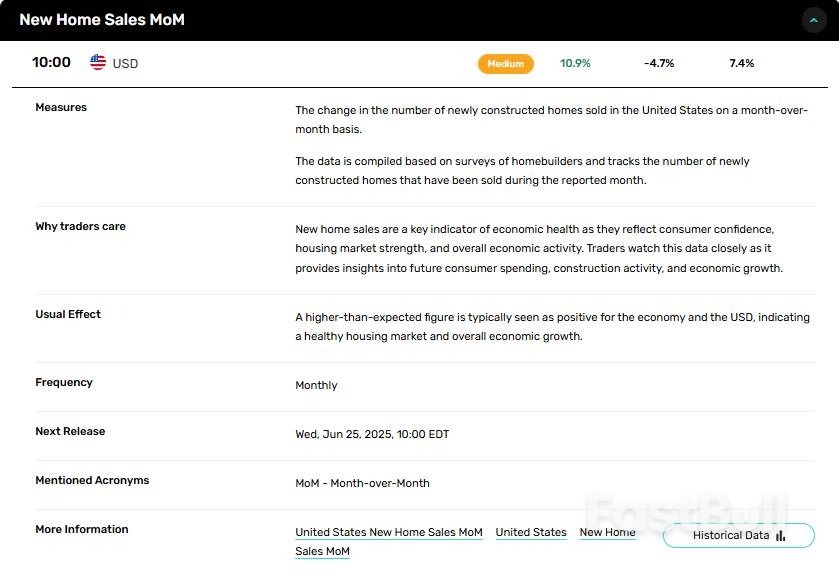
Exports are tumbling — they will drop 7.4% on an annualized basis in the current quarter, forecasters estimate, after President Donald Trump’s tariff threats caused US importers to pull forward their shipments earlier in the year. But exporters should be able stage a modest recovery, starting later in the year.
The trade dispute with Canada’s closest trading partner is hitting the labor market and household consumption. Economists now say unemployment will rise to 7.2% in the second half of the year before easing in 2026.
They expect inflation to run above the central bank’s target, at 2.1% in the third quarter and 2.2% in the fourth.
That puts the Bank of Canada in a difficult position, with now a less than 30% probability of a change to interest rates at its June meeting, according to Bloomberg’s World Interest Rate Probability.
“The more we can get uncertainty down, the more we can be more forward-looking as we move forward in our monetary policy decisions,” Bank of Canada Governor Tiff Macklem said on Thursday.
Businesses and consumers are waiting for more clarity on what the US relationship looks like before making major decisions. That uncertainty has contributed to a notable slowdown in the housing market, with home prices and sales falling. Economists say housing starts may be weaker in the second half of 2025 than in the second quarter.
“I know Canada is keen to sit down with the US and work through our differences and come to an agreement,” Macklem said. “If we can get that clarity, we can get back to growth. Clearly if things move in the other direction, yes, it will be worse.”
Prime Minister Mark Carney will get another chance to meet with Trump soon, with the US president set to make his first trip to Canada since returning to power when he attends the G-7 leaders’ summit in Alberta in June.
But Carney has warned that the long period of deepening integration between the two countries is over.
Economists see gross domestic product rising 1.2% in 2025 and 1% in 2026. Those figures are in line with the previous Bloomberg survey.
The survey of 34 economists was conducted from May 16 to May 21.
Asian spot liquefied natural gas (LNG) prices rose for the third week running to a two-week high amid renewed demand, weak production in Malaysia and as Egypt seeks to secure huge volumes for the rest of the year.
The average LNG price for July delivery into north-east Asia (LNG-AS) was at $12.40 per million British thermal units (mmBtu), up from $11.75/mmBtu last week, industry sources estimated.
"The market has been on a rising trend since its recent lows at the start of the month, though overall it remains a long way down from its mid-February highs," said Alex Froley, senior LNG analyst at data intelligence firm ICIS.
Froley attributed the rise to buying interest from Asian importers including Bangladesh and Taiwan, and to reports of Egypt looking to secure large volumes over the rest of the year.
The Asian market continues to monitor LNG supply outages in Australia and Malaysia, said Laura Page, head of LNG insight at data analytics firm Kpler.
Page said that Australia's North West Shelf plant ceased LNG exports between May 16-22, while exports out of Malaysia's Bintulu complex have been on a steep downward trajectory.
"While part of the reduction is due to planned maintenance, the severity of the decline suggests there may also be an unplanned issue affecting capacity," she said.
Martin Senior, head of LNG pricing at Argus, said that weekly loadings at Malaysia's Bintulu have fallen to 13-year low and a growing number of ships are holding off the shore of the facility waiting for production to pick up again.
He added that hot weather forecasts for parts of north-east Asia and southern Europe could boost early summer cooling demand.
In Europe, gas prices at the Dutch TTF hub rose this week on the back of Norwegian maintenance and worries about Ukraine peace talks which have not seen that much progress.
"Looking ahead, TTF prices could increase slightly as heavy pipeline maintenance continues in Norway, despite weather forecasts anticipating strong renewable generation and a gradual rise in temperatures across the continent," Kpler's Page said.
Europe’s underground gas storage is building up reasonably comfortably and supply is increasing, ICIS' Froley said, adding that possible EU storage target reductions should prevent major price rises, although downside could be limited by potential new demand from Asian buyers entering the market as prices move lower.
S&P Global Commodity Insights assessed its daily North West Europe LNG Marker (NWM) price benchmark for cargoes delivered in July on an ex-ship (DES) basis at $11.646/mmBtu on May 22, a $0.55/mmBtu discount to the July futures price at the TTF hub.
Argus assessed the price for July delivery at $11.510/mmBtu, while Spark Commodities assessed the June price at $11.467/mmBtu.
The U.S. arbitrage to north-east Asia via the Cape of Good Hope decreased this week but was still pointing towards Europe, while the arbitrage via Panama continues to point to Asia, said Spark Commodities analyst Qasim Afghan.
In the LNG freight market, Atlantic rates dropped to $32,000/day on Friday, while Pacific rates dropped to $20,750/day, Afghan added.
New home sales climbed sharply in April, posting a seasonally adjusted annual rate of 743,000 units, according to fresh data from the U.S. Census Bureau and HUD. This marks a notable 10.9% increase from March and places sales 3.3% above year-ago levels. For traders watching housing stocks and rate-sensitive assets, the data may reinforce optimism around consumer resilience and homebuilder performance.

The 743,000 pace surprised to the upside and indicates a pickup in buyer activity despite higher mortgage rates. April’s figures suggest that buyers are adapting to financing conditions, potentially turning toward new construction due to limited existing home supply. With consumer demand holding steady, builders like Lennar, D.R. Horton, and PulteGroup could continue to benefit from elevated order backlogs and favorable pricing trends.
The number of new homes for sale at the end of April stood at 504,000 units—down slightly from March, but still 8.6% higher than a year ago. More importantly for the market, the months’ supply dropped from 9.1 to 8.1, indicating faster absorption. This drop in months’ supply, paired with rising sales, may point to a stabilizing market where excess inventory is gradually being cleared. Traders focused on housing ETFs and REITs tied to residential development will want to watch for sustained inventory drawdowns as a bullish signal.
Pricing trends also supported the positive tone. The median sales price rose 0.8% from March to $407,200, while the average price surged 3.7% to $518,400. Though the median remains 2.0% lower than last year, the average price has rebounded above year-ago levels. These shifts may indicate renewed pricing power for builders, especially in mid-to-high-end segments. This could support margins across the sector, particularly if input cost pressures remain stable.
The stronger-than-expected sales data, falling months’ supply, and improving price action point toward a bullish short-term outlook for U.S. homebuilders. Equities tied to residential construction, mortgage origination, and home improvement retail could see tailwinds. For rate watchers, the data may reinforce arguments for a cautious Federal Reserve, as housing resilience complicates the case for imminent rate cuts. Traders should monitor upcoming inflation prints and builder earnings for confirmation.
The short answer is that the Bank of Japan (BoJ) is letting the market set yields. For years, the BoJ has run an extremely loose monetary policy, including capping yields at extremely low levels and negative interest rates.
Limited economic growth and disinflation made such a policy possible. However, inflationary pressures and a weak yen have prompted the BoJ to shift its stance. Policy normalization started in 2023, when the BoJ allowed 10-year JGB yields to rise above 1% for the first time in over a decade.
Today, 10-year and 30-year bond yields are 1.60% and 3.20%, respectively. They better reflect expectations of continued tighter monetary policy as inflation lingers above the BoJ’s 2% target. Moreover, the yen’s persistent weakness, exacerbated by low interest rates versus the U.S., forces the BOJ to encourage higher interest rates to stabilize the currency.
Japan’s improving economy and higher inflation lead many to anticipate that the BoJ may entirely abandon interest rate caps and negative interest rates. Additionally, with public debt exceeding 250% of GDP, concerns about long-term fiscal sustainability are percolating. Consequently, these factors add to the upward pressure on yields.
The risk to US and global stock and bond investors is that higher Japanese yields and a stronger yen force a reversal of the yen carry trade. If you recall, we saw what that may look like in August 2024.
Yesterday, we discussed the backdrop to bonds. We also added to our longer-duration bond holdings in portfolios due to the deep oversold condition. However, there is a rather large and glaring mistake between the current narrative that “deficts” are causing yields to rise.
The problem is that we have been running deficits for more than 40 years, and deficits today are lower than they were five years ago. But therein lies the key to why rates are currently higher than they were in 2020.
As shown, the correlation between deficits and rates makes sense. The reduction in the deficit since 2020 has been a function of stronger growth and less debt issuance. As deficits decline, and economic growth strengthens, borrowers are able to ask for more yield. Conversely, when economic growth is declining sharply, and deficits increase due to increased debt issuance, yields fall. You can see this correlation in the chart below.
In the short term, narratives drive yields along with massive short-positioning and NO central bank interventions. When the Federal Reserve and the Treasury begin to intervene to control the rise in yields, which they will do to protect financial stability, the reversal in yields will be rather sharp. However, that could be months or quarters away.
In the meantime, we will have to take advantage of swings in the bond market to increase returns from our fixed income holdings. Currently, as shown, longer-duration bonds are deeply oversold and due for a reflexive rally. What causes that rally? Who knows, but some headline will emerge suggesting lower inflation or slower economic growth, and yields will respond accordingly.
As shown, TLT is currently trading 3-standard deviations below the mean which suggest a rally to 88 (the mean) is possible which is a decent short-term trade setup.
In the meantime, we get to clip a 4.5% coupon while we wait for a short-term gain.
Social and traditional media made Wednesday’s 20-year auction out as one of the worst Treasury auctions ever. We, however, would categorize it as tepid. Let’s review a few facts and let you make up your own mind.
For starters, the 20-year Treasury is an orphan bond of sorts. The demand and supply of 20-year bonds are not as large as the more liquid 2-year, 3-year, 5-year, 10-year, and 30-year bonds. As such, the reduced liquidity and smaller auction sizes tend to lead to more volatile auction results.
The Tweet of the Day shows that the “tail” on the auction was 1.2 bps. Thus, the auction rate was 1.2 bps higher than where it was trading prior to the auction. The graph shows that a +/- 1bps result is somewhat normal.
Consider that indirect bidders, predominantly central banks, took 88% of the auction. Direct bidders, the backstop for auctions, took a relatively low 8%. In other words, the auction did not need the largest banks to support it. The graph below shows that the direct bidder allotment was on the low side of recent auctions.
Indeed, the auction could have been better, but the media exaggerates the outcome to feed their current bearish bond narrative.
Tweet of the Day.

Simply the fact that the aircraft is coming from abroad, from an uncertain regulatory environment, raises the possibility that it could be tainted in some respect.
The Department of Defense has formally accepted a Boeing 747-8 jet from the Qatari royal family that President Trump hopes to use as his new Air Force One. Before Trump can use the Qatari jet, though, the Pentagon will need to modify the aircraft to meet the demanding specifications required of the president’s transport.
“The Department of Defense will work to ensure proper security measures and functional-mission requirements are considered for an aircraft used to transport the President of the United States,” Pentagon spokesman Sean Parnell said in a statement. According to Parnell, the US Air Force will be responsible for modifying the aircraft—and is expected to award a contract to a US firm to make the required changes. The exact modifications needed for the aircraft have not been publicly disclosed.
“As we lay out the plan, we will make sure that we do what’s necessary to ensure the aircraft is fit to carry the president with all the communications, safety, and self-defense measures required,” said Air Force Secretary Troy E. Meink. These modifications could cost US taxpayers in excess of $1 billion.
The gifted jet aircraft, valued around $400 million, raises questions about foreign political influence on the Trump administration—as well as the ethics of accepting a plane that, due to the structuring of the gift, appears to be for Trump’s personal use.
The Emoluments Clause of the US Constitution (Article I, Section 9, Clause 8) prohibits federal officials from accepting gifts, payments, or other benefits from foreign governments without the consent of Congress. The Emoluments Clause is designed to prevent foreign influence and corruption, to ensure that officials prioritize national interests over personal benefits.
Predictably, Trump’s acceptance of a $400 million luxury airliner from a foreign government—for which he notably did not seek the consent of Congress—has raised Emoluments Clause-related concerns. Whether or not the president has actually violated the clause, though, seems to depend on who one asks. Representative Jamie Raskin (D-Md.) has opened an inquiry into the gifted plane, suggesting that the acceptance violates the Constitution.
It is certain that the gift of the plane would be far less controversial if Trump had not added the proviso that after his term ends, the 747 will be donated to his presidential library—meaning that he will continue to have personal access to the jet once he leaves office. In effect, this transforms the gift from a presidential one to a personal one, and raises significant concerns about the Emoluments Clause.
Of course, accepting a foreign-donated presidential plane necessarily raises security questions. Simply the fact that the aircraft is coming from abroad, from an uncertain regulatory environment, raises the possibility that it could be tainted in some respect.
Of course, the Air Force will execute its due diligence upon receiving the jet, to make sure the aircraft is perfectly safe. Still, a seed of doubt has been planted that would not exist were the jet coming off the line in Seattle. Moreover, some critics of the deal are raising questions about the potential for using the jet for espionage purposes, like electronic surveillance or data collection—though the scandal if this were to emerge would seriously endanger the US-Qatar relationship, an outcome that no leader in Doha is likely to risk.
Espionage aside, the gifted 747 will need to undergo security-enhancing modifications, especially with respect to bolstering the jet’s electromagnetic pulse hardening and self-defense suites, which are standard on current Air Force One models. Given the urgent timeline that Trump is imposing on the project, it is unclear if the Air Force will be able to modify the jet to the highest standards while sticking to Trump’s insisted timeline.
Data on Friday signaled unexpected positive momentum in the country's economy, with retail sales rising by a much better-than-expected 1.2% in April, and GfK's consumer confidence index showing an improvement in sentiment.
Sterling gained 0.6% against the U.S. dollar after the figures were published on Friday, to trade at around $1.35.
The combination of the two positive figures on Friday bucked expectations, and logic, for some economists. Economic activity in April was widely expected to show a downtrend, in part thanks to U.S. President Donald Trump's global trade war.
"Well now, that challenges the idea of a cautious consumer," said Rob Wood, chief U.K. economist at Pantheon Macroeconomics, adding that a number of factors, some not influenced by politicians or businesses, were at play.
"That said, official sales growth looks too good to be true, likely as the seasonal adjustment fails to adequately control for the later Easter this year," Wood added. "There's no doubt the weather helped a lot, with both March and April registering the most sunshine since records began."
Taken in isolation, Friday's retail figures and consumer confidence data perhaps point to growth in the current quarter. However, British electricity regulator Ofgem added to the positive sentiment by declaring on Friday that electricity prices are set to decline by 7% in July. That could potentially fuel spending in other sectors in the coming months.
"This is certainly an improvement for household expenses, with monthly bills likely to fall on average by around £11," said Ellie Henderson, economist at Investec.
Meanwhile, the string of positive elements could potentially bump up U.K. economic growth for the second quarter as a whole, according to Allan Monks, chief U.K. economist at JPMorgan who is forecasting a 0.6% annualised gain.
"With the household savings rate so high, a continued improvement in confidence has the potential to unlock further consumer spending gains," JP Morgan's Monks said in a note to clients on Friday. "High inflation, softer wage growth and weak employment argue against a continuation of that trend. But the rise in confidence in May was matched by a notable drop in unemployment fears, lower inflation expectations and a rise in spending intentions."
The outlook for the U.K. has seesawed over the past year. The country has grappled with setbacks like unexpected economic contraction and mounting concern about fiscal spending plans, while also seeing some more positive data and the agreement of landmark trade deals with the U.S., India and the EU.
Earlier this week, official figures showed the economy grew by 0.7% in the first quarter of 2025 — although that came as domestic inflation surged to 3.5% in April. Last week, another data print showed average earnings in the U.K. had grown by 5.9% on an annual basis.
The mix of data meant economists appeared divided on Friday about what the latest bout of data meant for the U.K.'s long term economic picture.
Alex Kerr, U.K. economist at Capital Economics, warned that "the sun won't shine on [Britain's] retail sector forever."
"Although for the first time since 2015, excluding the pandemic, retail sales volumes have risen for four months in a row, April's impressive 1.2% m/m rise was largely driven by the unusually warm weather," he said in a note sent shortly after the figures were published.
"That boost won't last. So even though consumer confidence ticked up slightly in May, we suspect retail sales growth will slow over the coming months."
While most economists viewed the small increase in consumer confidence in May as a positive signal for next quarter's economic growth, others suggested that as overall sentiment remains below pre-pandemic levels, the link between spending and sentiment may be broken instead.
"Depressed British consumers have resorted to retail therapy to cope with their economic and financial woes," said Andrew Wishart, senior UK economist at Berenberg.
Instead, Wishart said a combination of the pandemic, and the ensuing inflation and interest rate hikes led consumers to shore up their finances.
"Households have increased their saving rate (the share of household income not spent) to a level previously unseen outside of periods of mass unemployment," Wishart added.
Having stabilized their bank balances and secured pay rises, consumers are now spending in anticipation of a more stable interest rate and price environment, according to the economist.
Counter intuitively, the additional spending means the Bank of England was more likely to hold rates for the rest of the year, than cut, he added.
U.S. President Donald Trump’s pro-energy policies were meant to speed the construction of the United States’ next generation of energy infrastructure, but many oil and gas pipeline operators would still rather buy than build their way to expansion due to a host of factors impeding large projects.
Trump declared an energy emergency on his first day in office and has issued directives to support exports, reform permitting and roll back environmental standards. Since his November election, a number of large-scale projects have been greenlit, including a liquefied natural gas terminal and a handful of pipelines.
But higher costs from a global trade war sparked by U.S. tariffs, labor shortages, low oil prices, and the risk of legal snags mean many companies are generally reluctant to commit to bold new construction.
Instead, operators see mergers and acquisitions as a more efficient way to grow. In the first quarter of this year, 15 U.S. midstream deals were struck, the highest quarterly number since the final three months of 2021, according to energy tech company Enverus.
“We have spent a lot of time thinking about the buy versus build question and, at this time, we’re seeing more opportunities to buy assets,” said Angelo Acconcia, a partner at ArcLight Capital Partners, which invests in energy infrastructure.
Acconcia said factors including tariffs and high demand for supplies and labor made it challenging to calculate the economics of building a project.
One of the most prevalent trends in dealmaking so far in 2025 has been pipeline companies buying back stakes in joint ventures, previously sold to help fund the initial development costs of prior-year builds.
Targa Resources TRGP.N said in February it would acquire preferred equity in its Targa Badlands pipeline system from Blackstone BX.N for $1.8 billion, while MPLX MPLX.N said in the same month it would buy the 55 per cent interest in the BANGL natural gas pipeline previously owned by WhiteWater Midstream and Diamondback Energy FANG.O for $715 million.
Private equity owners of energy infrastructure are keen sellers, having spent recent years developing systems that are now online.
Northwind Midstream, a New Mexico-focused pipeline operator, is currently being marketed for sale by Five Point Infrastructure, for example.
In recent years, U.S. oil and gas pipeline projects have faced regulatory hurdles and robust environmental opposition, resulting in years of delay and substantial cost overruns.
The Mountain Valley Pipeline, a natural gas conduit owned by an EQT Corp-led group EQT.N, started operating last June but took six years to build and cost more than double its initial $3.5 billion budget.
While the industry has welcomed Trump’s pro-fossil fuel sentiment, some of his other policies - including tariffs on products like steel - are pushing up the cost of new energy projects.
Weak global crude prices have also prompted warnings from U.S. oil and gas producers that they could curtail output growth, making pipeline firms cautious about new spending.
Some companies, including Kinder Morgan KMI.N, said they believe there are better economics in smaller-scale projects that expand existing infrastructure than in big new ones.
Others are wary of even those types of projects.
DT Midstream DTM.N CEO David Slater said last month that while some bite-size expansion may continue on the company’s LEAP system in the Haynesville basin, he wanted to see how local producers react to commodity price movements before considering new plans.
“I think we just need to let the clock run here a little bit, see how the basin responds,” he told analysts on a call.
Despite the hurdles, the math still favors new construction for some companies.
Energy Transfer ET.N said it will build the $2.7 billion Hugh Brinson natural gas pipeline in Texas, and Tallgrass Energy plans to construct a pipeline to move natural gas from the Permian to its Rockies Express Pipeline running through Colorado and Wyoming.
“Generally, on buy versus build, if you have the opportunity to build, you build because the returns are largely better,” said Ali Akbar, managing director of energy investment banking at Greenhill, a Mizuho affiliate.
He said buying an asset like a pipeline can sometimes cost two times more than building something similar.
Williams Companies WMB.N unveiled in March its $1.6 billion Socrates project to build natural gas infrastructure to support data center development in Ohio and has said Washington’s newfound support for projects is a welcome change.
“It’s nice to see some people that actually think their job is to help get infrastructure built as opposed to being obstructive,” outgoing CEO Alan Armstrong said on an earnings call this month.
White Label
Data API
Web Plug-ins
Poster Maker
Affiliate Program
The risk of loss in trading financial instruments such as stocks, FX, commodities, futures, bonds, ETFs and crypto can be substantial. You may sustain a total loss of the funds that you deposit with your broker. Therefore, you should carefully consider whether such trading is suitable for you in light of your circumstances and financial resources.
No decision to invest should be made without thoroughly conducting due diligence by yourself or consulting with your financial advisors. Our web content might not suit you since we don't know your financial conditions and investment needs. Our financial information might have latency or contain inaccuracy, so you should be fully responsible for any of your trading and investment decisions. The company will not be responsible for your capital loss.
Without getting permission from the website, you are not allowed to copy the website's graphics, texts, or trademarks. Intellectual property rights in the content or data incorporated into this website belong to its providers and exchange merchants.
Not Logged In
Log in to access more features

FastBull Membership
Not yet
Purchase
Log In
Sign Up