• Trade
  • Markets
  • Copy
  • Contests
  • News
  • 24/7
  • Calendar
  • Q&A
  • Chats
Screeners
SYMBOL
LAST
ASK
BID
HIGH
LOW
NET CHG.
%CHG.
SPREAD
SPX
S&P 500 Index
6978.59
6978.59
6978.59
6988.81
6958.82
+28.36
+ 0.41%
--
DJI
Dow Jones Industrial Average
49003.40
49003.40
49003.40
49157.80
48862.52
-408.99
-0.83%
--
IXIC
NASDAQ Composite Index
23817.11
23817.11
23817.11
23865.26
23694.38
+215.76
+ 0.91%
--
USDX
US Dollar Index
95.960
96.040
95.960
96.080
95.660
+0.420
+ 0.44%
--
EURUSD
Euro / US Dollar
1.19763
1.19770
1.19763
1.20439
1.19616
-0.00629
-0.52%
--
GBPUSD
Pound Sterling / US Dollar
1.37808
1.37819
1.37808
1.38466
1.37674
-0.00661
-0.48%
--
XAUUSD
Gold / US Dollar
5264.88
5265.29
5264.88
5311.48
5157.13
+86.30
+ 1.67%
--
WTI
Light Sweet Crude Oil
62.575
62.605
62.575
62.989
61.932
+0.138
+ 0.22%
--

Community Accounts

Signal Accounts
--
Profit Accounts
--
Loss Accounts
--
View More

Become a signal provider

Sell trading signals to earn additional income

View More

Guide to Copy Trading

Get started with ease and confidence

View More

Signal Accounts for Members

All Signal Accounts

Best Return
  • Best Return
  • Best P/L
  • Best MDD
Past 1W
  • Past 1W
  • Past 1M
  • Past 1Y

All Contests

  • All
  • Trump Updates
  • Recommend
  • Stocks
  • Cryptocurrencies
  • Central Banks
  • Featured News
Top News Only
Share

Question Of Putin, Zelenskiy Meeting Was Raised Several Times In Putin-Trump Call

Share

[Report Shows Nearly 60% Of Surveyed US Companies Plan To Increase Investment In China] The China Council For The Promotion Of International Trade (CCPIT) Released The "2026 China Business Environment Survey Report" On The 28th, Compiled By The American Chamber Of Commerce In China. The Report Shows That Nearly 60% Of Surveyed US Companies Plan To Increase Their Investment In China. According To The Recently Released Report, Over Half Of The Surveyed US Companies Operating In China Expect To Achieve Profitability Or Significant Profitability By 2025, And Over 70% Of The Surveyed Companies Are Not Currently Considering Transferring Production Or Procurement Outside Of China. Wang Wenshuai, Spokesperson For The CCPIT, Stated At A Regular Press Conference Held That Day That This Reflects, From One Perspective, That China Will Undoubtedly Remain A Fertile Ground For Foreign Investment And Business Development For A Long Time To Come

Share

Paris-Denmark Prime Minister­:­ I Think There Are Som Lessons Learned For Europe In The Last Weeks

Share

French President Macron: We Are Ready To Act Together At Any Time

Share

Deutsche Bank: We Are Cooperating Fully With Prosecutor's Office. We Cannot Comment Further On This Matter

Share

French President Macron: France Backs Reinforcement Of Defence Position In Arctic Region

Share

US President Trump: The Next Attack On Iran Will Be Worse Than The Attack On Its Nuclear Facilities

Share

French President Macron: France Reiterates Support To Greenland

Share

Trump: Hopefully Iran Comes To The Table

Share

Trump: Next Attack On Iran Will Be Far Worse

Share

Trump: Larger Fleet Than That Sent To Venezuela

Share

Trump: A Massive Armada Is Heading To Iran. It Is Moving Quickly

Share

TotalEnergies Executive: LNG Buyers Prioritising Supply Security Over Price

Share

Bank Of America Will Match The USA Government's $1000 Pilot Contribution For All Eligible USA Teammates To Trump Accounts

Share

The US MBA Mortgage Application Activity Index Fell 8.5% Week-over-week For The Week Ending January 23, Compared To 14.1% Previously

Share

US Mortgage Refinance Index Falls 15.7 Percent To 1332.2 In Jan 23 Week

Share

US Average 30-Year Mortgage Rate Rises 8 Bps To 6.24 Percent In Jan 23 Week

Share

US Mortgage Purchase Index Falls 0.4 Percent To 193.3 In Jan 23 Week

Share

US Mortgage Market Index -8.5 Percent To 363.3 In Week Ended Jan 23

Share

Israel Shekel Hits 30-Year High Versus Dollar At Rate Of 3.085

TIME
ACT
FCST
PREV
Mexico Trade Balance (Dec)

A:--

F: --

P: --

U.S. Weekly Redbook Index YoY

A:--

F: --

P: --

U.S. S&P/CS 20-City Home Price Index YoY (Not SA) (Nov)

A:--

F: --

P: --

U.S. S&P/CS 20-City Home Price Index MoM (SA) (Nov)

A:--

F: --

P: --
U.S. FHFA House Price Index MoM (Nov)

A:--

F: --

P: --

U.S. FHFA House Price Index (Nov)

A:--

F: --

P: --

U.S. FHFA House Price Index YoY (Nov)

A:--

F: --

P: --
U.S. S&P/CS 10-City Home Price Index YoY (Nov)

A:--

F: --

P: --

U.S. S&P/CS 10-City Home Price Index MoM (Not SA) (Nov)

A:--

F: --

P: --

U.S. S&P/CS 20-City Home Price Index (Not SA) (Nov)

A:--

F: --

P: --

U.S. S&P/CS 20-City Home Price Index MoM (Not SA) (Nov)

A:--

F: --

P: --

U.S. Richmond Fed Manufacturing Composite Index (Jan)

A:--

F: --

P: --

U.S. Conference Board Present Situation Index (Jan)

A:--

F: --

P: --

U.S. Conference Board Consumer Expectations Index (Jan)

A:--

F: --

P: --

U.S. Richmond Fed Manufacturing Shipments Index (Jan)

A:--

F: --

P: --

U.S. Richmond Fed Services Revenue Index (Jan)

A:--

F: --

P: --

U.S. Conference Board Consumer Confidence Index (Jan)

A:--

F: --

P: --
U.S. 5-Year Note Auction Avg. Yield

A:--

F: --

P: --

U.S. API Weekly Refined Oil Stocks

A:--

F: --

P: --

U.S. API Weekly Crude Oil Stocks

A:--

F: --

P: --

U.S. API Weekly Gasoline Stocks

A:--

F: --

P: --

U.S. API Weekly Cushing Crude Oil Stocks

A:--

F: --

P: --

Australia RBA Trimmed Mean CPI YoY (Q4)

A:--

F: --

P: --

Australia CPI YoY (Q4)

A:--

F: --

P: --

Australia CPI QoQ (Q4)

A:--

F: --

P: --

Germany GfK Consumer Confidence Index (SA) (Feb)

A:--

F: --

P: --

Germany 10-Year Bund Auction Avg. Yield

A:--

F: --

P: --

India Industrial Production Index YoY (Dec)

A:--

F: --

P: --

India Manufacturing Output MoM (Dec)

A:--

F: --

P: --

U.S. MBA Mortgage Application Activity Index WoW

A:--

F: --

P: --

Canada Overnight Target Rate

--

F: --

P: --

BOC Monetary Policy Report
U.S. EIA Weekly Crude Stocks Change

--

F: --

P: --

U.S. EIA Weekly Cushing, Oklahoma Crude Oil Stocks Change

--

F: --

P: --

U.S. EIA Weekly Crude Demand Projected by Production

--

F: --

P: --

U.S. EIA Weekly Crude Oil Imports Changes

--

F: --

P: --

U.S. EIA Weekly Heating Oil Stock Changes

--

F: --

P: --

U.S. EIA Weekly Gasoline Stocks Change

--

F: --

P: --

BOC Press Conference
Russia PPI MoM (Dec)

--

F: --

P: --

Russia PPI YoY (Dec)

--

F: --

P: --

U.S. Target Federal Funds Rate Lower Limit (Overnight Reverse Repo Rate)

--

F: --

P: --

U.S. Interest Rate On Reserve Balances

--

F: --

P: --

U.S. Federal Funds Rate Target

--

F: --

P: --

U.S. Target Federal Funds Rate Upper Limit (Excess Reserves Ratio)

--

F: --

P: --

FOMC Statement
FOMC Press Conference
Brazil Selic Interest Rate

--

F: --

P: --

Australia Import Price Index YoY (Q4)

--

F: --

P: --

Japan Household Consumer Confidence Index (Jan)

--

F: --

P: --

Turkey Economic Sentiment Indicator (Jan)

--

F: --

P: --

Euro Zone M3 Money Supply (SA) (Dec)

--

F: --

P: --

Euro Zone Private Sector Credit YoY (Dec)

--

F: --

P: --

Euro Zone M3 Money Supply YoY (Dec)

--

F: --

P: --

Euro Zone 3-Month M3 Money Supply YoY (Dec)

--

F: --

P: --

South Africa PPI YoY (Dec)

--

F: --

P: --

Euro Zone Consumer Confidence Index Final (Jan)

--

F: --

P: --
Euro Zone Selling Price Expectations (Jan)

--

F: --

P: --

Euro Zone Industrial Climate Index (Jan)

--

F: --

P: --

Euro Zone Services Sentiment Index (Jan)

--

F: --

P: --

Q&A with Experts
    • All
    • Chatrooms
    • Groups
    • Friends
    SlowBear ⛅ flag
    3469449
    @SlowBear ⛅alright
    @3469449 That is very cool bro,
    SlowBear ⛅ flag
    3469449
    i am just here for market check
    @3469449 That is cool, so you are mostly into the crypto market right?
    EuroTrader flag
    3469449
    i am just here for market check
    @Visitor3469449Okey it's all good to actually do market survey to explore other markets
    miki maka flag
    SlowBear ⛅ flag
    miki maka
    @miki makai agree bro the first correction is alomost done and from there we might see the next rally towards 5350
    SlowBear ⛅ flag
    miki maka
    @miki makathe scond corrective wave is much suitable for post FOMC and that is more suited for my swing plan - Thanks for sharing
    miki maka flag
    SlowBear ⛅
    @SlowBear ⛅ok my brother
    SlowBear ⛅ flag
    miki maka
    @miki makaAre you in any position on gold as of now? or you are waiting for one of the setups you just shared to play out?
    miki maka flag
    SlowBear ⛅
    @SlowBear ⛅I close 5300 i wait another set up
    EuroTrader flag
    miki maka
    @miki makaI love your chart Markup my friend. Do you have limit orders at that price level?
    SlowBear ⛅ flag
    miki maka
    @miki makaWow 5300 close that is awesome - i could not bring myself to closing 5300 to be honest but i will addd somemore and maybe close the earliers at a better level and leave the newst to run
    SlowBear ⛅ flag
    miki maka
    @miki makaI must say again, those setup are mind blowing, well done!
    miki maka flag
    SlowBear ⛅
    @SlowBear ⛅thank you bro
    SlowBear ⛅ flag
    miki maka
    @miki maka You are very welcome, when you get an entry keep me posted bro! So nice!
    SlowBear ⛅ flag
    miki maka
    @miki maka I still had to check again like this is impressive - talk about perfect setup - it covers all major bullish scenarios! Trading is simple when you know what you are doing - And this speaks volume!
    EuroTrader flag
    EuroTrader flag
    EuroTrader
    @miki makaThis would be the money printer for the day? Pay attention to how the euro trades in the coming New York session
    EuroTrader flag
    3469753 flag
    how i van buy or sell
    Market Sniper🎯 flag
    Hello everyone 👋 I’m a Forex trader focused mainly on Gold (XAUUSD), using structured price action and disciplined risk management. I currently offer: 📌 Account management 📌 Trade guidance / session scalping 📌 Market structure analysis on Gold No false promises — just patience, consistency, and proper execution. If anyone is interested in account management or trade collaboration, feel free to send a DM for details. Let’s grow with discipline, not hype.
    Type here...
    Add Symbol or Code

      No matching data

      All
      Trump Updates
      Recommend
      Stocks
      Cryptocurrencies
      Central Banks
      Featured News
      • All
      • Russia-Ukraine Conflict
      • Middle East Flashpoint
      • All
      • Russia-Ukraine Conflict
      • Middle East Flashpoint
      Search
      Products

      Charts Free Forever

      Chats Q&A with Experts
      Screeners Economic Calendar Data Tools
      Membership Features
      Data Warehouse Market Trends Institutional Data Policy Rates Macro

      Market Trends

      Market Sentiment Order Book Forex Correlations

      Top Indicators

      Charts Free Forever
      Markets

      News

      News Analysis 24/7 Columns Education
      From Institutions From Analysts
      Topics Columnists

      Latest Views

      Latest Views

      Trending Topics

      Top Columnists

      Latest Update

      Signals

      Copy Rankings Latest Signals Become a signal provider AI Rating
      Contests
      Brokers

      Overview Brokers Assessment Rankings Regulators News Claims
      Broker listing Forex Brokers Comparison Tool Live Spread Comparison Scam
      Q&A Complaint Scam Alert Videos Tips to Detect Scam
      More

      Business
      Events
      Careers About Us Advertising Help Center

      White Label

      Data API

      Web Plug-ins

      Affiliate Program

      Awards Institution Evaluation IB Seminar Salon Event Exhibition
      Vietnam Thailand Singapore Dubai
      Fans Party Investment Sharing Session
      FastBull Summit BrokersView Expo
      Recent Searches
        Top Searches
          Markets
          News
          Analysis
          User
          24/7
          Economic Calendar
          Education
          Data
          • Names
          • Latest
          • Prev

          View All

          No data

          Scan to Download

          Faster Charts, Chat Faster!

          Download App
          English
          • English
          • Español
          • العربية
          • Bahasa Indonesia
          • Bahasa Melayu
          • Tiếng Việt
          • ภาษาไทย
          • Français
          • Italiano
          • Türkçe
          • Русский язык
          • 简中
          • 繁中
          Open Account
          Search
          Products
          Charts Free Forever
          Markets
          News
          Signals

          Copy Rankings Latest Signals Become a signal provider AI Rating
          Contests
          Brokers

          Overview Brokers Assessment Rankings Regulators News Claims
          Broker listing Forex Brokers Comparison Tool Live Spread Comparison Scam
          Q&A Complaint Scam Alert Videos Tips to Detect Scam
          More

          Business
          Events
          Careers About Us Advertising Help Center

          White Label

          Data API

          Web Plug-ins

          Affiliate Program

          Awards Institution Evaluation IB Seminar Salon Event Exhibition
          Vietnam Thailand Singapore Dubai
          Fans Party Investment Sharing Session
          FastBull Summit BrokersView Expo

          Dollar Breaches 1.2 Against Euro, Weakness Deepens As Trump Welcomes Weakness

          Winkelmann

          Forex

          Economic

          Summary:

          Dollar's selloff extended through the week, only managing a brief pause after slipping through the key psychological level of 1.2 against Euro briefly.

          Dollar's selloff extended through the week, only managing a brief pause after slipping through the key psychological level of 1.2 against Euro briefly. While the pace of decline has slowed, there is little sign of a meaningful recovery taking shape. The bounce has so far been shallow. And, Dollar remains under pressure on multiple fronts, with headwinds increasingly coming from within the US rather than from external shocks or data surprises.

          Markets took particular note of remarks from US President Donald Trump, who expressed clear comfort with Dollar's decline. In a market accustomed to verbal pushback against sharp currency moves, the lack of resistance from the White House has been interpreted as a green light for further weakness.

          Asked directly whether the Dollar had fallen too far after sliding about 10% over the past year, Trump dismissed the concern, saying the currency was "doing great" and pointing to strong business activity as justification. Trump also revisited his long-standing complaints about Asian currencies, recalling past disputes with Japan and China over devaluation. The contrast between those confrontations and his current stance reinforces the impression that a weaker Dollar is no longer seen as a problem.

          Such remarks matter for markets. When the President signals indifference—or endorsement—toward currency depreciation, it emboldens traders to maintain pressure rather than anticipate a policy-backed rebound.

          Adding to the unease, IMF Managing Director Kristalina Georgieva said earlier this week that the Fund is preparing for scenarios involving sharp selloffs in US dollar-denominated assets. While framed as contingency planning, the comments highlights growing institutional awareness of tail risks around the Dollar. Georgieva noted that the IMF is stress-testing "unthinkable" scenarios, including potential runs on Dollar assets, as part of its broader surveillance work. Even without assigning probabilities, the acknowledgement adds to a fragile confidence backdrop.

          In currency markets, the impact is clear. For the week so far, Dollar sits at the bottom of the performance table, followed by Loonie and Sterling. At the other end, Yen remains the strongest, supported by lingering intervention threats, though follow-through buying has been limited. Swiss Franc is the second strongest, with gains against both Euro and Sterling pointing to underlying risk aversion. Aussie ranks third, buoyed by strong inflation data that has all but confirmed an RBA rate hike next week. Euro and Kiwi trade in the middle of the pack.

          Australia CPI surges to 3.6% in Q4, 3.8% in December

          Australia's Q4 CPI showed little relief for RBA where it matters most for policy. Headline inflation rose 0.6% qoq, slightly below expectations of 0.7% and slowing sharply from the prior quarter's 1.3% gain. However, on an annual basis, CPI accelerated from 3.2% yoy to 3.6% yoy, matching forecasts and keeping inflation well above the RBA's target band.

          The more important signal came from underlying inflation. Trimmed mean CPI rose 0.9% qoq, easing marginally from 1.0% previously but beating expectations of 0.8%. Annual trimmed mean inflation climbed from 3.0% yoy to 3.4% yoy, above the expected 3.2%, reinforcing concerns that price pressures remain persistent.

          December's monthly details added to that unease. Headline CPI jumped 1.0% mom, lifting the annual rate from 3.5% yoy to 3.8%, both above expectations. Trimmed mean CPI rose a more modest 0.2% mom, but annual core inflation still edged up from 3.2% yoy to 3.3% yoy.

          Price pressures remain broad in December. Goods inflation accelerated from 3.2% yoy to 3.4%, driven largely by a 21.5% surge in electricity prices. Services inflation climbed from 3.6% yoy to 4.1%, led by domestic travel and accommodation and rising rents.

          Markets are now firming up their expectation that RBA will return to rate hike in February.

          AUD/USD surges past 0.70 as RBA hike solidify, 0.72 the test for long term strength

          Australian Dollar extended its rally this week, with AUD/USD breaking above 0.70 psychological level. The move has been supported by broad-based Dollar weakness, but domestic factors have played a central role following Australia's stronger-than-expected inflation data.

          December CPI showed another month of acceleration, while Q4 headline inflation printed at 3.6%. More importantly for policymakers, trimmed mean CPI at 3.4% underscored persistent underlying inflation that sits uncomfortably above the RBA's target band. That inflation shock has quickly filtered into economist forecasts. Westpac and ANZ revised their outlooks, now expecting the RBA to raise the cash rate at its upcoming meeting next week. All four major Australian banks now forecast a 25bp hike back to 3.85%.

          The key uncertainty now lies beyond the initial move. The question is whether the RBA would signal scope for a more extended tightening cycle, or frame the hike as a one-off adjustment designed to reassert inflation control.

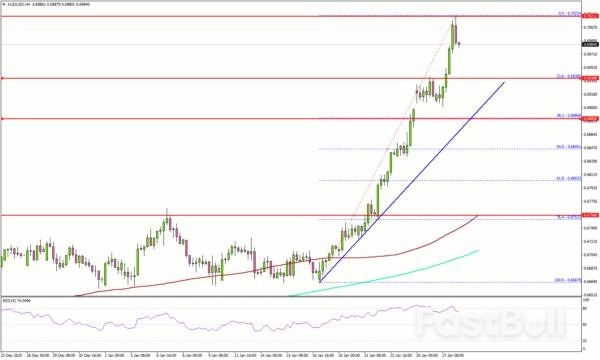
          Technically, AUD/USD remains in clear upward acceleration, with D MACD still pointing higher. The advance from 0.5913 is on track toward its 100% projection of 0.5913 to 0.6706 from 0.6420 at 0.7213 next. On the downside, below 0.6901 support will bring consolidations first. But downside should be contained above 0.6706 resistance turned support to bring another rally.

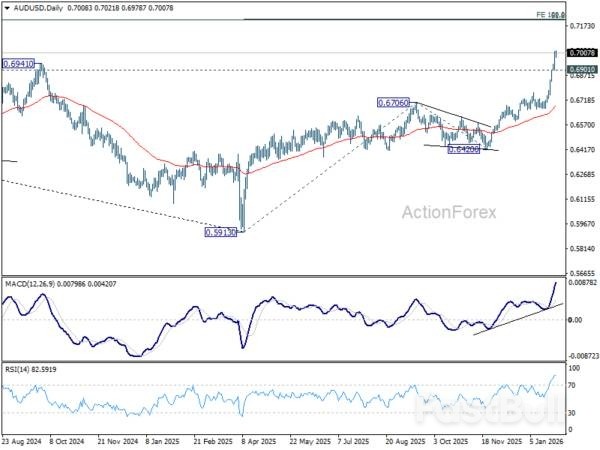
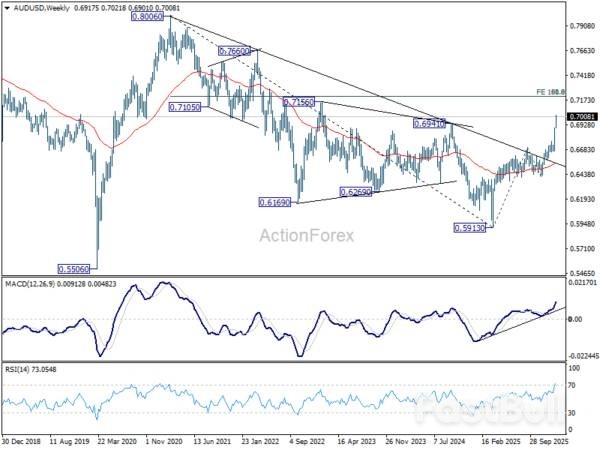
          More importantly, the decisive break above 0.6941 structural resistance this week strengthens the case that the rise from 0.5913 is reversing the entire decline from the 0.8006 (2020 high). Next target is 61.8% retracement of 0.8006 to 0.5913 at 0.7206, which is close to the above 0.7213 projection level.

          Reactions to this 0.72 resistance zone will decide whether current rise from 0.5913 is the third leg of the pattern from 0.5506 (2020 low), and open the door to further medium up trend through 0.8006.

          Fed and BoC holds unlikely to alter USD/CAD downtrend

          Two major central bank decisions from North America headline the day, with both the BoC and the Fed widely expected to keep interest rates unchanged. USD/CAD, meanwhile, is unlikely to see its broader trend altered by either decision. The current selloff would likely continue through 1.3538 low as driven by the overall selloff in Dollar.

          For the BoC, markets expect rates to remain at 2.25%, the lower bound of the bank's estimated 2.25–3.25% neutral range. A recent Reuters poll showed nearly 75% of economists expect the BoC to keep policy unchanged through 2026.

          At this stage, the BoC appears comfortable with a prolonged wait-and-see stance. However, slack remains in the labour market, growth momentum is uncertain, and policy is not yet clearly stimulative despite the 275bp of rate cuts delivered between June 2024 and October 2025.

          Hence, if policy does move again this year, risks are tilted toward further cuts rather than hikes. That bias hinges heavily on trade outcomes. As long as key sectors retain preferential access to the US—either through deals or prolonged negotiations—the growth outlook remains intact.

          However, should tariffs expand to a broader range of industries, the drag on activity would intensify. In that scenario, the BoC would likely be forced to resume easing to cushion the economic impact.

          Turning to the Fed, rates are expected to remain unchanged at 3.50–3.75%, making this very much a holding meeting. Markets will be listening closely for any shift in tone that hints at future action rather than focusing on the decision itself.

          Voting dynamics will be watched carefully. Stephen Miran, a known dove, is expected to dissent in favor of a cut. Any additional votes for easing beyond Miran would be interpreted as a clear dovish signal.

          For now, the Fed is expected to remain on hold through the remainder of Jerome Powell's term in May. Markets price roughly a 63% chance of a June cut, but conviction remains limited given multiple wild cards, including economic data, trade relations, financial market stability, and President Donald Trump's choice of the next Fed chair.

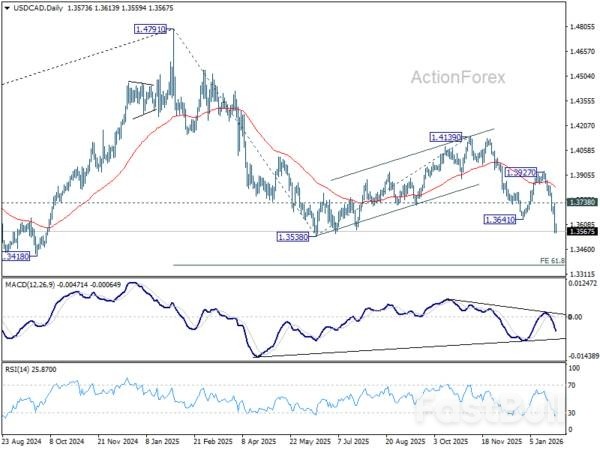
          Technically, for USD/CAD, current decline should continue as long as 1.3738 resistance holds. It's seen as part of the downtrend from 14791. Break of 1.3538 will pave the way to 61.8% projection of 1.4791 to 1.3538 from 1.4139 at 1.3365 in the near term.

          EUR/USD Daily Outlook

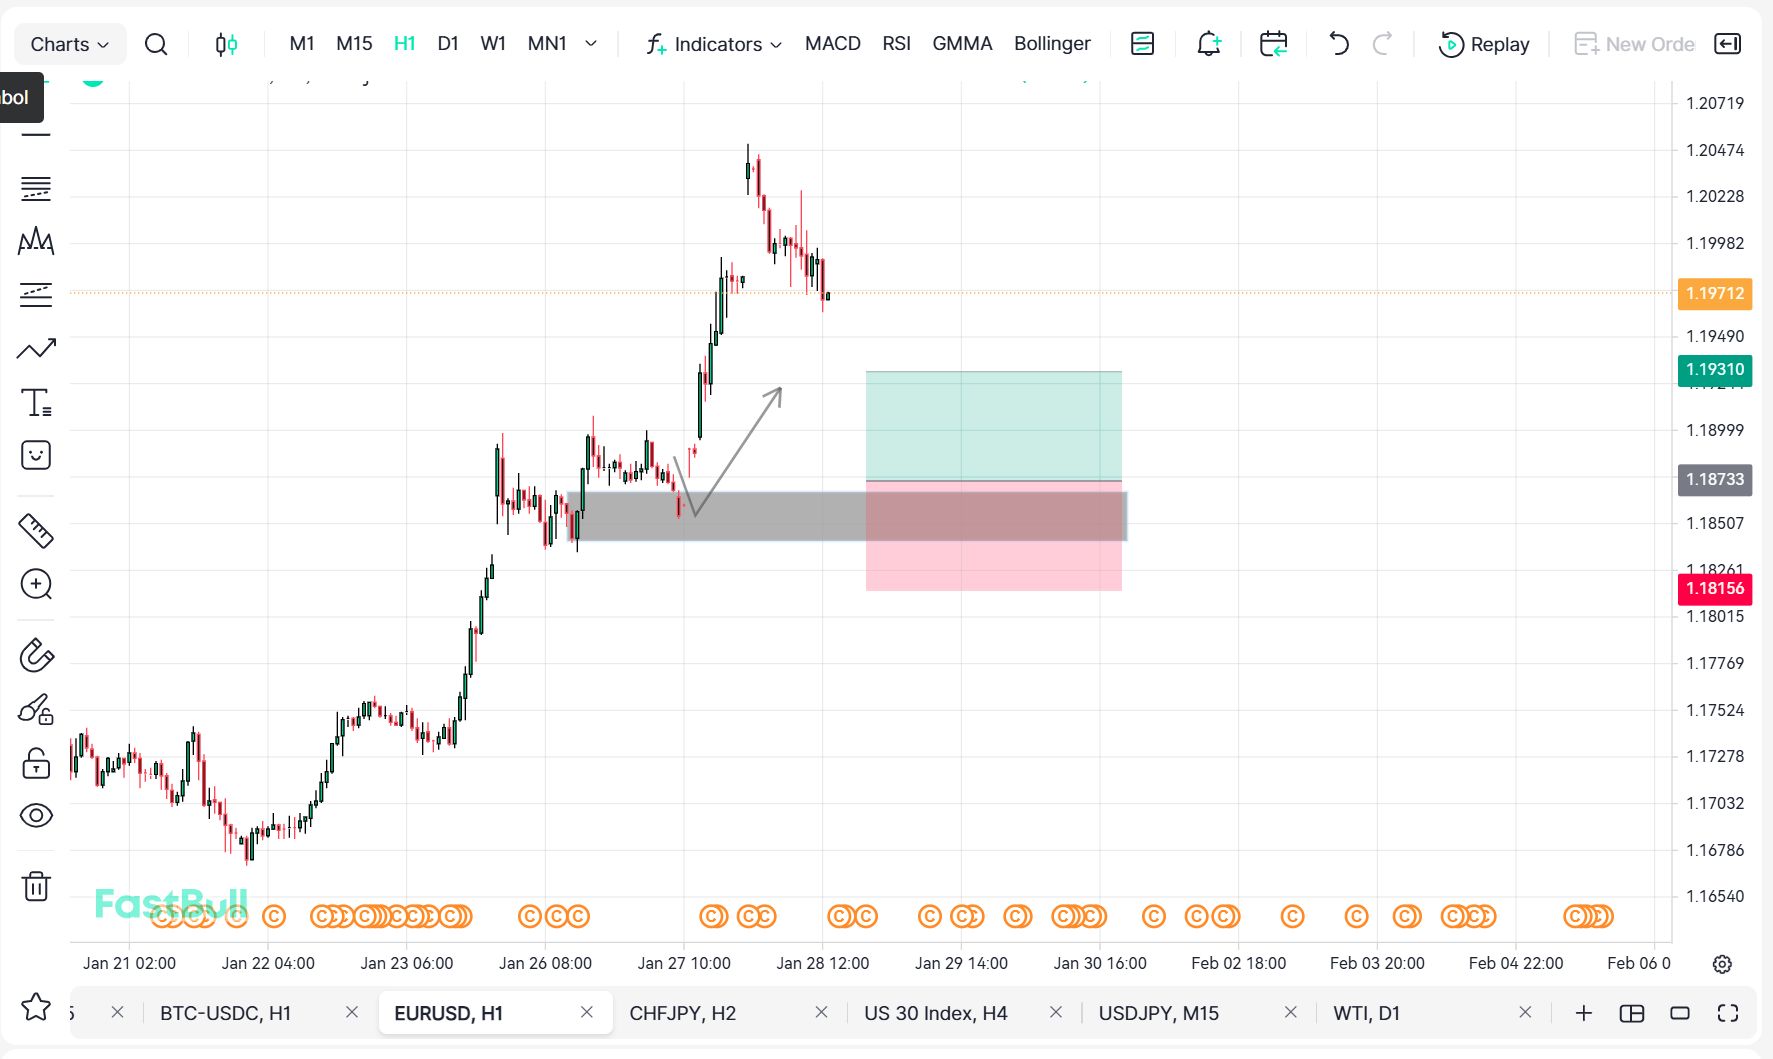
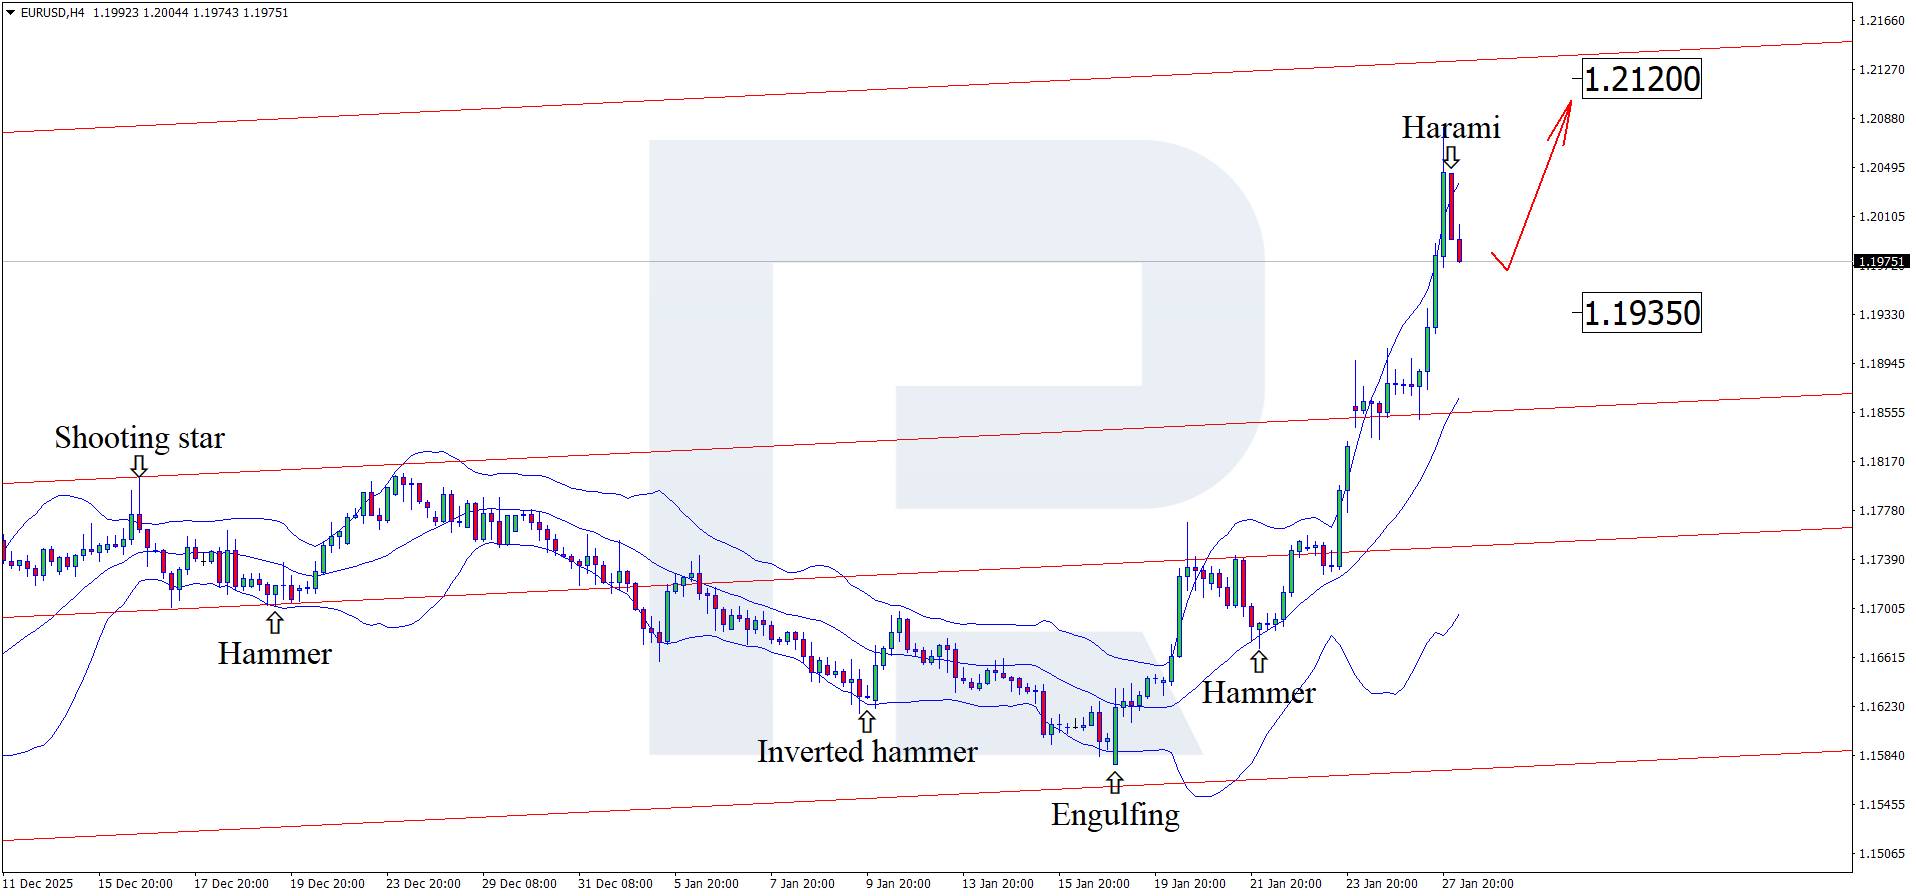
          Daily Pivots: (S1) 1.1902; (P) 1.1992; (R1) 1.2134;

          EUR/USD's rally is still in progress and breached 1.2 psychological level before retreating slightly. Intraday bias stays on the upside. Decisive break above 1.2 will carry larger bullish implications. Next near term target will be 38.2% projection of 1.0176 to 1.1917 from 1.1576 at 1.3434. On the downside, below 1.1906 minor support will turn intraday bias neutral first. But outlook will stay bullish as long as 1.1576 support holds, even in case of deep pullback.

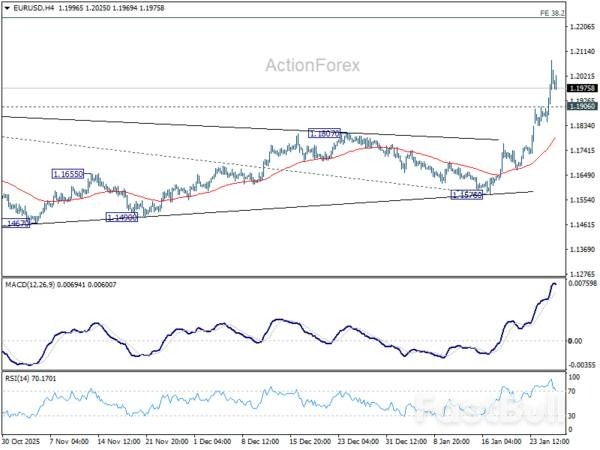
          In the bigger picture, as long as 55 W EMA (now at 1.1443) holds, up trend from 0.9534 (2022 low) is still in favor to continue. Decisive break of 1.2 key psychological level will add to the case of long term bullish trend reversal. Next medium term target will be 138.2% projection of 0.9534 to 1.1274 from 1.0176 at 1.2581. However, sustained trading below 55 W EMA will argue that rise from 0.9534 has completed as a three wave corrective bounce, and keep long term outlook bearish.

          Source: ACTIONFOREX

          To stay updated on all economic events of today, please check out our Economic calendar
          Risk Warnings and Disclaimers
          You understand and acknowledge that there is a high degree of risk involved in trading. Following any strategies or investment methods may lead to potential losses. The content on the site is provided by our contributors and analysts for information purposes only. You are solely responsible for determining whether any trading assets, securities, strategy, or any other product is suitable for investing based on your own investment objectives and financial situation.
          Add to Favorites
          Share

          AUD/USD Emerges As Risk-On Favorite, 0.70 Now The Focus

          Titan FX

          Forex

          Economic

          Key Highlights

          · AUD/USD rallied above the key resistance at 0.6800 and 0.6900.
          · A major bullish trend line is forming with support at 0.6900 on the 4-hour chart.
          · EUR/USD gained bullish momentum and climbed above 1.1900.
          · Gold prices remain elevated, and dips could be attractive to the bulls.

          AUD/USD Technical Analysis

          The Aussie Dollar started a major increase above 0.6800 against the US Dollar. AUD/USD cleared the 0.6880 hurdle to enter a bullish zone.

          Looking at the 4-hour chart, the pair settled above 0.6920, the 200 simple moving average (green, 4-hour), and the 100 simple moving average (red, 4-hour). The bulls even pumped the pair above 0.6950.

          The current price action suggests high chances of more upside. Besides, there is a major bullish trend line forming with support at 0.6900. Immediate resistance sits near 0.6985. The first key hurdle could be 0.7000.

          A close above 0.7000 could open the doors for more gains. In the stated case, the bulls could aim for a move toward 0.7120. If there is a pullback, AUD/USD might find bids near 0.6900 or the trend line.

          A close below the trend line might initiate an extended drop. The first major area for the bulls might be near 0.6840. The main support sits at 0.6800, below which the pair could accelerate lower. The next support could be 0.6740 and the 100 simple moving average (red, 4-hour).

          Looking at EUR/USD, the pair extended gains and traded above 1.1900. The next key hurdle sits near 1.2000.

          Upcoming Key Economic Events:

          · BoC Interest Rate Decision – Forecast 2.25%, versus 2.25% previous.

          Source: Titan FX

          To stay updated on all economic events of today, please check out our Economic calendar
          Risk Warnings and Disclaimers
          You understand and acknowledge that there is a high degree of risk involved in trading. Following any strategies or investment methods may lead to potential losses. The content on the site is provided by our contributors and analysts for information purposes only. You are solely responsible for determining whether any trading assets, securities, strategy, or any other product is suitable for investing based on your own investment objectives and financial situation.
          Add to Favorites
          Share

          Luxury Goes Local As China’s Second-Tier Cities Overtake Traditional Powerhouses

          Gerik

          Economic

          Second-Tier Cities Emerge As New Luxury Hubs

          China’s second-tier cities are rapidly becoming the primary growth engine for luxury brands, overtaking traditional first-tier markets such as Beijing and Shanghai in terms of consumer spending. Cities including Nanjing and Changsha, alongside more than two dozen others, are now recording luxury sales that exceed those of China’s long-established economic centers. This shift reflects a broader relocation of affluent and aspirational consumers toward cities that offer high living standards at significantly lower costs.
          According to industry observers, the rise of these cities in luxury rankings would have been difficult to imagine just a few years ago. Yet their growing dominance illustrates how China’s consumption map is being redrawn rather than simply expanding.

          Why Consumers Are Spending More Outside First-Tier Cities

          China accounts for roughly one quarter of global luxury spending, but demand has been uneven since the post-pandemic rebound faded. Slower economic growth and lingering effects from the property sector downturn have weighed on confidence, particularly in first-tier cities where living costs are highest. In contrast, middle-class consumers in second-tier cities enjoy more manageable expenses, allowing greater discretionary spending on premium goods.
          Research from MDRi shows luxury shoppers in second-tier cities spent an average of 253,800 yuan in 2024, a 22 percent increase from the previous year, while spending by first-tier consumers declined 4 percent to 250,200 yuan. This difference reflects a clear behavioral shift rather than a short-term anomaly, as consumers increasingly balance lifestyle quality with financial efficiency.

          Brands Follow The Money Beyond Beijing And Shanghai

          Luxury houses are adjusting their China strategies accordingly. Brands such as Burberry and LVMH are prioritizing expansion and experiential retail in second-tier cities where demand is proving more resilient.
          A striking example came in August, when Louis Vuitton launched its beauty line La Beauté Louis Vuitton in China not in a first-tier city, but at Deji Plaza in Nanjing. The decision highlighted how brands now view second-tier cities as launchpads rather than secondary markets. Earlier data showed that Deji Plaza surpassed Beijing SKP to become China’s top-performing luxury mall, recording more than 24.5 billion yuan in sales in 2024 compared with Beijing SKP’s 22.2 billion yuan, a lead analysts believe was maintained into 2025.

          Deji Plaza And The Experience-Led Model

          Located in Nanjing, a city of roughly 9.5 million people, Deji Plaza illustrates how luxury retail in second-tier cities has evolved. Beyond hosting every major luxury brand, the mall integrates cultural and experiential elements such as an art museum, a modern food hall, and highly stylized restrooms that have gone viral on social media. These features are not decorative add-ons but part of a deliberate strategy to increase dwell time, social media visibility, and consumer loyalty.
          Brands including Self-Portrait and MAC Cosmetics have even hosted pop-up shops within these unconventional spaces, reinforcing the idea that experience is now as critical as product assortment in attracting younger consumers.

          Gen Z And The New Luxury Consumer Base

          Gen Z shoppers are emerging as a powerful force in China’s luxury market, particularly in second-tier cities. These consumers are highly responsive to novelty, immersive environments, and localized offerings. Deji Plaza caters to this demographic by combining top-tier luxury labels with more accessible brands, creating a layered ecosystem that captures both aspiration and affordability.
          This approach aligns with broader demographic trends. Many second-tier cities have seen net inflows of middle-class residents relocating from first-tier cities in search of lower costs and better work-life balance. These migrants bring established consumption habits with them, accelerating the development of local luxury markets.

          A Structural Shift Rather Than A Cyclical Trend

          Industry analysts emphasize that the rise of second-tier cities is not merely a temporary redistribution of spending. According to CBRE and Savills, improved mall quality, stronger local job security, and rising consumer confidence have structurally enhanced the attractiveness of these markets. While first-tier cities remain important for flagship experiences, incremental growth is increasingly coming from well-curated malls in lower-tier locations.
          This pattern highlights a deeper transformation in Chinese consumer behavior, where luxury spending is becoming more localized and less dependent on a handful of global cities. As income and population dynamics continue to favor second-tier centers, analysts expect more of these cities to climb luxury rankings in the coming years.
          The shift toward second-tier cities underscores how luxury in China is no longer defined by geography alone but by value, experience, and lifestyle alignment. For global brands, success now depends on understanding where consumers choose to live and spend, not simply where prestige has historically been concentrated. As China’s luxury market evolves, the center of gravity is clearly moving closer to where everyday life is more affordable, and discretionary income can stretch further.

          Source: Reuters

          To stay updated on all economic events of today, please check out our Economic calendar
          Risk Warnings and Disclaimers
          You understand and acknowledge that there is a high degree of risk involved in trading. Following any strategies or investment methods may lead to potential losses. The content on the site is provided by our contributors and analysts for information purposes only. You are solely responsible for determining whether any trading assets, securities, strategy, or any other product is suitable for investing based on your own investment objectives and financial situation.
          Add to Favorites
          Share

          Weak USD And Fed Rate Pause Take Centre Stage

          Danske Bank

          Forex

          Economic

          Political

          In focus today

          The main event will be tonight's FOMC meeting. We expect no monetary policy changes, in line with broad consensus and market pricing. As the Fed will not be releasing updated economic projections, attention will centre on Powell's assessment of recent economic data, and the likelihood of further rate cuts this spring. We expect Powell to avoid any specific speculation regarding future Fed nominations and recent challenges to the central bank's independence.

          The Bank of Canada also meet today, and we expect the central bank to maintain its policy rate at 2.25%.

          Economic and market news

          What happened yesterday

          In the US, the consumer confidence index for January unexpectedly fell to 84.5 (cons: 90.9, prior: 94.2), diverging sharply from the University of Michigan's survey, which had painted a more optimistic picture. The decline was most pronounced in the 'present situation' assessment, with labour market indicators showing weakness. The widely followed 'jobs plentiful' index dropped to its lowest level since February 2021, a time when the unemployment rate stood at 6.2%. This appears more tied to real economic conditions than tariff concerns, as inflation expectations eased. These sentiment indicators have sent somewhat conflicting signals lately, but all else equal, this could fuel some further USD weakness.

          The EU and India have concluded a landmark trade agreement that will remove tariffs on over 90% of goods traded between the two economies. Under the deal, India will lower tariffs on European automobiles and agricultural products, while the EU will reciprocate by easing duties on India's labour-intensive exports, which have suffered significantly due to the 50% tariffs imposed by the US. Currently ranked as the EU's ninth-largest trading partner, India accounted for 2.4% of the bloc's total goods trade in 2024. The EU anticipates that the agreement will double its exports to India by 2032, fostering stronger economic ties.

          In Hungary, the central bank kept policy rate unchanged at 6.50%, in line with market expectations.

          Equities: Equities generally higher, with the same dynamics observed over the last three trading sessions: US tech and related utilities orchestrated a comeback, while small caps underperformed for a third session. Semis were particularly strong, likely speculation of hiked AI capex plans from the hyperscalers. Microsoft is important, reporting today after US closing.

          European and Nordic equities also somewhat higher, but below the highs taken prior to the tariff threats. The rapid dollar decline probably plays a role behind the sluggish rebound, as the FX headwind hits earnings. Be aware that earnings revisions will be negative for most Nordic companies after post results, solemnly due to FX, although demand assumption is held constant, or even lifted. Another reason is that there were no contrarian dip to buy in the first place. Despite last week's selloff we did not observe any genuine market stress and positioning were far from oversold. Investors are buying equities, but anchored in fundamental economic strength, which is a slower process higher than a dip buying opportunity.

          FI and FX: Broad USD remains under heavy pressure as the prospect of joint FX intervention between the US and Japan added further momentum to the recent USD sell-off. EUR/USD finds itself flirting with the 1.20 mark, whereas EUR/CHF broke below the 0.92 mark, as the CHF has benefitted from the increased uncertainty and as an alternative to the USD. Scandies continue to do well, just as anything with a reverse correlation to USD, and EUR/SEK and EUR/NOK both saw Monday's bounce completely reversed yesterday, with the latter once again breaking below 10.60.

          Source: Danske Bank

          To stay updated on all economic events of today, please check out our Economic calendar
          Risk Warnings and Disclaimers
          You understand and acknowledge that there is a high degree of risk involved in trading. Following any strategies or investment methods may lead to potential losses. The content on the site is provided by our contributors and analysts for information purposes only. You are solely responsible for determining whether any trading assets, securities, strategy, or any other product is suitable for investing based on your own investment objectives and financial situation.
          Add to Favorites
          Share

          The Only Real Comfort Is That US Inflation Has Not Surged As A Result Of Tariffs

          Swissquote

          Stocks

          Commodity

          Economic

          There were plenty of major stories and market moves yesterday, but the most significant — and most impactful — was undoubtedly the sharp sell-off in the US dollar. It pushed the US Dollar Index to a four-year low and continues to drive gold and silver to fresh record highs this morning.

          Trade and geopolitical uncertainty, tied to an increasingly unreliable American friend and ally, as well as growing concerns about what will happen to the Federal Reserve's (Fed) credibility once Jerome Powell leaves office (it will fly out of the window), continue to weigh on the US dollar. Add to that the latest US consumer survey, which showed a sharp drop in consumer confidence, a marked deterioration in how households view the current situation, a decline in the share of consumers expecting income growth, and a steady rise in those saying jobs are hard to get. You get a pretty murky picture for the greenback and the two-speed US economy.

          Still, this will hardly convince the Fed to cut rates today or in the coming months. Jerome Powell is likely to avoid political commentary at his post-decision speech today and keep the focus firmly on economic data to justify policy decisions.

          That said, we all know the US President is waiting just outside the room — and anything he might say about the Fed's decision, or about how much he dislikes Powell, would only risk making matters worse for the US dollar, much to the delight of gold and silver longs. But with or without buzzy headlines, the US dollar looks condemned to weaken.

          The only real comfort is that US inflation has not surged as a result of tariffs. That is partly because importers built up stockpiles to buy time, but also because only around 20% of announced tariff threats have actually been implemented since November 2024, according to Bloomberg. In other words, only a fifth of tariff threats have materialised so far — giving the so-called TACO trade ("Trump Always Chickens Out") some concrete data backing today.

          This may help explain why Korean equities barely reacted when President Trump threatened to impose 25% tariffs on Korea, citing the lack of formal codification of last year's trade deal. That agreement includes up to $350bn of Korean investment commitments in the US — a massive sum, especially with the won under pressure. South Korea has already signalled it may delay up to $20bn of planned US investment this year. Fury.

          Political tensions aside, the Kospi hit fresh highs today, with SK Hynix continuing its "Free Solo" climb after reports it has become the exclusive supplier of memory chips for Microsoft's new AI chip!

          Elsewhere, after a year of trade tensions, former US allies appear increasingly keen to diversify. Last week, Canada signed a trade arrangement with China, easing rules on several sensitive areas, including Chinese EV exports. This week, Europe finalised a trade deal with Mercosur and another with India after two+ decades of negotiations. Funny how a common adversary can accelerate diplomacy!

          Ursula von der Leyen dubbed the India agreement "the mother of all deals". It eliminates more than 95% of tariffs on both sides and covers cars, industrial goods, wine, pasta, chocolate and other European exports for India's 1.5bn consumers to enjoy without tariffs.

          The mood among European investors would have been even better had LVMH not reported weaker sales on the same day. Still, the Stoxx 600 closed close to record highs, led once again by defence stocks, as Europe continues to ramp up spending on security and technology amid an increasingly strained relationship with the US.

          Europe has strong players in defence. In tech, the challenge is far greater and will take years to address. That said, there are signs of progress: this week, the EU switched on parts of its home-grown secure satellite communications network, designed to reduce reliance on Starlink for sensitive uses. These efforts are likely to intensify as geopolitical risks grow, justifying investment in European defence and tech.

          Speaking of tech, ASML — Europe's largest technology company and the world's sole supplier of the most advanced chip-making machines — reported earnings this morning. Results showed a modest beat on revenue and profit, and a significant upside surprise on bookings. Order intake reached around €13.2bn, roughly double expectations, underlining strong forward demand, particularly for EUV systems.

          European futures are higher, while Nasdaq futures are leading gains among major indices, with ASML's results boosting sentiment ahead of a busy US earnings calendar. Meta, Microsoft and Tesla report after the bell. For Microsoft, focus will be on Azure growth, AI-related product revenues and data-centre spending plans. For Meta, attention will centre on costs and monetisation of AI initiatives. I personally remain little convinced with Meta's shift from social media to AI media, but hey… For Tesla, the spotlight is happily less on plunging car sales and more on dream… The pace of robotaxi expansion and the timeline for Optimus will matter more than actual numbers— though Elon Musk has already warned that production will be slow. Market reaction may once again hinge more on a single man's persuasion than on reality.

          Source: Swissquote Bank SA

          To stay updated on all economic events of today, please check out our Economic calendar
          Risk Warnings and Disclaimers
          You understand and acknowledge that there is a high degree of risk involved in trading. Following any strategies or investment methods may lead to potential losses. The content on the site is provided by our contributors and analysts for information purposes only. You are solely responsible for determining whether any trading assets, securities, strategy, or any other product is suitable for investing based on your own investment objectives and financial situation.
          Add to Favorites
          Share

          Fed Decision And Political Risks: EURUSD Prepares For A New Surge

          Samantha Luan

          Forex

          Economic

          Ahead of the Fed's interest rate decision, the EURUSD pair made a sharp move higher and is trading near 1.1995.

          EURUSD forecast: key takeaways

          · US Federal Reserve interest rate decision: previous value – 3.75%, projected at 3.75%
          · The pair is aiming for the 2021 highs
          · EURUSD forecast for 28 January 2026: 1.2120

          Fundamental analysis

          The EURUSD forecast takes into account that today the euro is forming a correction after a sharp rally and is trading near the 1.1985 level.

          Amid uncertainty in the global economy and elevated global risks, the market is currently focused on the US Federal Reserve's interest rate meeting.

          Today, the Fed is expected to keep the interest rate unchanged at 3.75%, as part of its strategy to fight inflation. While markets generally expect further tight monetary policy, analysts do not rule out an unlikely but possible 0.25% rate hike if US economic data continues to show growth. Such a decision would become a trigger for EURUSD movement, as even small rate changes can affect USD dynamics.

          At the same time, today's EURUSD forecast also considers an alternative scenario surrounding the interest rate decision, taking into account Donald Trump's desire to weaken the USD to boost competitiveness. The US president has recently been frequently interfering in the Fed's work and attempting to exert political influence on economic decision-making. In this case, the Fed may leave the interest rate unchanged or lower it.

          A rate cut would further weaken the USD and push the EURUSD rate towards the 2021 highs.

          Technical outlook

          On the H4 chart, the EURUSD pair formed a Harami reversal pattern near the upper Bollinger Band. At this stage, it may develop a corrective wave following this signal. Since quotes have moved outside the ascending channel, they may head towards the 1.1935 level. A rebound from this area would open the way for continued upward momentum.

          At the same time, today's EURUSD forecast also suggests an alternative scenario, in which the pair continues to rise towards 1.2120 without testing the support level.

          EURUSD overview

          · Asset: EURUSD
          · Timeframe: H4 (Intraday)
          · Trend: bullish
          · Key resistance levels: 1.2120 and 1.2200
          · Key support levels: 1.1830 and 1.1725

          EURUSD trading scenarios for today

          Main scenario (Buy Limit)

          A pullback towards the 1.1935 level will allow buyers to build new positions, and amid pressure on the US dollar and expectations surrounding the Fed meeting outcome, the market may continue to move towards the upper targets of the range.

          The risk-to-reward ratio exceeds 1:3. The upside potential is around 185 pips, with the risk limited to 50 pips.

          · Buy Limit: 1.1935
          · Take Profit: 1.2120
          · Stop Loss: 1.1885

          Alternative scenario (Sell Stop)

          A decline and consolidation below 1.1800 will signal profit-taking and waning bullish momentum after January's sharp rally. In this case, a corrective pullback towards lower support levels is likely.

          · Sell Stop: 1.1795
          · Take Profit: 1.1700
          · Stop Loss: 1.1830

          Risk factors

          Any unexpected hawkish signals from the Fed, strong US macroeconomic data, or easing political tensions could temporarily support the US dollar and trigger a correction in the EURUSD pair.

          Summary

          With the market awaiting the Fed's interest rate decision, the EURUSD pair is forming a correction. Technical analysis of EURUSD suggests a pullback towards the 1.1935 support area before further growth.

          EURUSD 2026-2027 forecast: key market trends and future predictions

          This article provides the EURUSD forecast for 2026 and 2027 and highlights the main factors determining the direction of the pair's movements. We will apply technical analysis, take into account the opinions of leading experts, large banks, and financial institutions, and study AI-based forecasts. This comprehensive insight into EURUSD predictions should help investors and traders make informed decisions.

          Gold (XAUUSD) forecast 2026 and beyond: expert insights, price predictions, and analysis

          Dive deep into the Gold (XAUUSD) price outlook for 2026 and beyond, combining technical analysis, expert forecasts, and key macroeconomic factors. It explains the drivers behind gold's recent surge, explores potential scenarios including a move toward 4,500 to 5,000 USD per ounce, and highlights why the metal remains a strong hedge during global uncertainty.

          Source: RoboForex

          To stay updated on all economic events of today, please check out our Economic calendar
          Risk Warnings and Disclaimers
          You understand and acknowledge that there is a high degree of risk involved in trading. Following any strategies or investment methods may lead to potential losses. The content on the site is provided by our contributors and analysts for information purposes only. You are solely responsible for determining whether any trading assets, securities, strategy, or any other product is suitable for investing based on your own investment objectives and financial situation.
          Add to Favorites
          Share

          India's Record Gold Imports Put Rupee Under Pressure

          Glendon

          Data Interpretation

          Commodity

          Economic

          Forex

          India's gold and silver imports soared to record levels in 2025, raising serious concerns among policymakers. Despite sky-high prices, the nation's demand for precious metals has proven resilient, leaving the government with few effective tools to manage the inflows.

          In 2025, the country's gold imports climbed 1.6% year-over-year to $58.9 billion. Silver imports saw an even more dramatic increase, jumping 44% to $9.2 billion, even as both metals traded at record highs.

          Soaring Imports Widen Trade Deficit and Weaken Rupee

          India ranks as the world's second-largest gold consumer and the biggest market for silver. The nation relies almost entirely on imports to meet its gold demand and sources over 80% of its silver from overseas.

          This heavy reliance has significant economic consequences. Last year, gold and silver imports consumed nearly a tenth of the country's total foreign exchange reserves. With prices projected to rise further in 2026, this import bill is expected to grow, widening the trade deficit and putting sustained pressure on the rupee, which fell to a record low this month.

          While silver has industrial applications in sectors like solar power and electronics, gold is primarily used for jewelry and investment. The government considers this demand non-essential and has historically tried to curb it by raising import duties to make purchases more expensive.

          Market Braces for Potential Import Duty Hike

          The combination of record prices and strong import volumes is fueling speculation about another government intervention. A rising import bill threatens to further expand the trade deficit and weaken the rupee, which has already lost ground against the dollar.

          Trade and industry officials believe these pressures could prompt the government to raise import duties on both gold and silver in the coming weeks. This would be a reversal of the 2024 policy, which cut duties on both metals from 15% to 6% in an effort to curb smuggling. The government previously hiked gold duties sharply in 2012 and 2013 to stabilize a rapidly depreciating rupee, setting a precedent for the current situation.

          Anticipating a potential tax increase, both gold and silver are already trading at a premium to global benchmarks in the domestic market.

          The Shift from Jewelry to Investment Fuels Demand

          Historically, jewelry sales accounted for over three-quarters of India's gold consumption. However, international gold prices have surged 98% since the beginning of 2025, which has cooled demand for jewelry.

          Despite this, overall demand has not fallen. Instead, there has been a significant shift toward investment. Indians are increasingly purchasing physical gold in the form of coins and bars. At the same time, exchange-traded funds (ETFs) backed by physical gold and silver have gained massive popularity.

          Figure 1: Investment demand's share of India's total gold consumption rose above 40% in 2025, driven by a consumer pivot from traditional jewelry to financial assets like ETFs.

          In 2025, inflows into gold ETFs jumped 283% from the previous year to a record 429.6 billion rupees ($4.69 billion). This structural shift pushed the investment share of total gold consumption above 40% in 2025, a trend expected to continue in 2026.

          Figure 2: Monthly inflows into Gold and Silver ETFs surged through 2025, with gold-backed funds attracting record capital as investors sought alternatives to weak equity market returns.

          Doubts Linger Over a Duty Hike's Effectiveness

          India has a long history of attempting to curb gold imports with higher duties, but these measures have had limited success. For example, when the government raised the import tax from 2% to 10% in August 2013, demand remained steady.

          Domestic gold prices have skyrocketed from around 8,000 rupees per 10 grams in early 2006 to approximately 162,000 rupees today. Even a 76.5% price jump in 2025 failed to deter buyers. Consequently, another duty hike of 4 to 6 percentage points is unlikely to significantly reduce demand.

          Instead, higher duties could inadvertently boost investor returns and encourage smuggling. With weak returns in the equity market, bullion remains an attractive asset, and inflows into gold ETFs are expected to stay strong. Furthermore, any sharp drop in gold prices could weaken investment demand but would likely trigger a rebound in jewelry sales from buyers awaiting a market correction.

          Silver Imports Add to Economic Strain

          Silver imports are also becoming a major concern. Silver prices have risen even faster than gold, inflating India's import bill. While industrial consumption was the primary driver of silver demand until last year, investment demand has recently become a major supporting factor.

          In 2025, silver ETFs attracted inflows of 234.7 billion rupees, a substantial increase from 85.69 billion rupees the previous year. The growing popularity of these investment vehicles suggests that silver imports for investment purposes will continue to rise if the current price rally persists.

          To stay updated on all economic events of today, please check out our Economic calendar
          Risk Warnings and Disclaimers
          You understand and acknowledge that there is a high degree of risk involved in trading. Following any strategies or investment methods may lead to potential losses. The content on the site is provided by our contributors and analysts for information purposes only. You are solely responsible for determining whether any trading assets, securities, strategy, or any other product is suitable for investing based on your own investment objectives and financial situation.
          Add to Favorites
          Share
          FastBull
          Copyright © 2026 FastBull Ltd

          728 RM B 7/F GEE LOK IND BLDG NO 34 HUNG TO RD KWUN TONG KLN HONG KONG

          TelegramInstagramTwitterfacebooklinkedin
          App Store Google Play Google Play
          Products
          Charts

          Chats

          Q&A with Experts
          Screeners
          Economic Calendar
          Data
          Tools
          Membership
          Features
          Function
          Markets
          Copy Trading
          Latest Signals
          Contests
          News
          Analysis
          24/7
          Columns
          Education
          Company
          Careers
          About Us
          Contact Us
          Advertising
          Help Center
          Feedback
          User Agreement
          Privacy Policy
          Personal Information Protection Statement
          Business

          White Label

          Data API

          Web Plug-ins

          Poster Maker

          Affiliate Program

          Risk Disclosure

          The risk of loss in trading financial instruments such as stocks, FX, commodities, futures, bonds, ETFs and crypto can be substantial. You may sustain a total loss of the funds that you deposit with your broker. Therefore, you should carefully consider whether such trading is suitable for you in light of your circumstances and financial resources.

          No decision to invest should be made without thoroughly conducting due diligence by yourself or consulting with your financial advisors. Our web content might not suit you since we don't know your financial conditions and investment needs. Our financial information might have latency or contain inaccuracy, so you should be fully responsible for any of your trading and investment decisions. The company will not be responsible for your capital loss.

          Without getting permission from the website, you are not allowed to copy the website's graphics, texts, or trademarks. Intellectual property rights in the content or data incorporated into this website belong to its providers and exchange merchants.

          Not Logged In

          Log in to access more features

          Connect Broker
          Become a signal provider
          Help Center
          Customer Service
          Dark Mode
          Price Up/Down Colors

          Log In

          Sign Up

          Position
          Layout
          Fullscreen
          Default to Chart
          The chart page opens by default when you visit fastbull.com