• Trade
  • Markets
  • Copy
  • Contests
  • 24/7
  • Calendar
  • Q&A
  • Chats
Screeners
SYMBOL
LAST
BID
ASK
HIGH
LOW
NET CHG.
%CHG.
SPREAD
SOURCE
SPX
S&P 500 Index
7511.34
7511.34
7511.34
7564.96
7508.68
-42.94
-0.57%
--
--
DJI
Dow Jones Industrial Average
51999.66
51999.66
51999.66
52190.29
51864.99
+328.64
+ 0.64%
--
--
IXIC
NASDAQ Composite Index
26376.33
26376.33
26376.33
26788.62
26369.39
-307.60
-1.15%
--
--
USDX
US Dollar Index
99.220
99.220
99.300
99.280
99.220
-0.070
-0.07%
--
--
EURUSD
Euro / US Dollar
1.16152
1.16152
1.16159
1.16163
1.16061
+0.00073
+ 0.06%
--
--
GBPUSD
Pound Sterling / US Dollar
1.34308
1.34308
1.34318
1.34319
1.34210
+0.00046
+ 0.03%
--
--
XAUUSD
Gold / US Dollar
4336.34
4336.34
4336.79
4341.47
4328.46
+5.06
+ 0.12%
--
--
WTI
Light Sweet Crude Oil
75.785
75.785
75.820
75.986
75.449
+0.009
+ 0.01%
--
--

Community Accounts

Signal Accounts
--
Profit Accounts
--
Loss Accounts
--
View More

Become a signal provider

Sell trading signals to earn additional income

View More

Guide to Copy Trading

Get started with ease and confidence

View More

Signal Accounts for Members

All Signal Accounts

Best Return
  • Best Return
  • Best P/L
  • Best MDD
Past 1W
  • Past 1W
  • Past 1M
  • Past 1Y

All Contests

  • All
  • Recommend
  • Stocks
  • Cryptocurrencies
  • Central Banks
  • Trump Updates
  • Featured News
Top News Only
Share

Singapore's Electronics Exports Rose 94.8% Year-on-Year In May

Share

The U.S. Military Says It Carried Out A Deadly Strike In The Eastern Pacific Against A Drug-trafficking Vessel Operated By A “terrorist Organization.”

Share

CITIC Securities: Japan's Apparent Inflation Rate Is Expected To Remain Moderate Throughout The Year. The Bank Of Japan Has No Urgency To Raise Interest Rates Further And May Keep The Policy Rate Unchanged At 1% After This Rate Hike

Share

Japan's Ministry Of Finance: Japan's Exports To The EU Rose 14.5% Year-on-Year In May

Share

Japan's Ministry Of Finance: Japan's Exports To The United States Rose 12.5% Year-on-Year In May

Share

Japan's Ministry Of Finance: Japan's Crude Oil Imports In May Fell 57.3% Year-on-Year; Liquefied Natural Gas Imports Decreased 15.1% Year-on-Year To 3.96 Million Tons

Share

Japan's Seasonally Adjusted Merchandise Trade Balance In May Was -¥904.01 Billion, Compared With An Expected Deficit Of ¥2,070 Billion And A Prior Surplus Of ¥2,364 Billion

Share

Japan's Core Machinery Orders In April Rose 15.6% Year-on-Year, Exceeding The Expected 9.3% And Following A Prior Reading Of 5.90%

Share

Japan's Unadjusted Merchandise Trade Balance In May Was -¥378.7 Billion, Compared With An Expectation Of -¥547.6 Billion And A Previously Reported Figure Of ¥301.9 Billion, Revised Down To ¥299.3 Billion

Share

Japan's Year-on-Year Merchandise Imports Rose By 12.5% In May, Versus An Expected Increase Of 12.8% And A Prior Reading Revised Upward From 9.70% To 9.80%

Share

Japan's Year-on-Year Merchandise Exports Rose By 17% In May, Exceeding The Forecast Of 16.5% And Up From The Previous Reading Of 14.80%

Share

G7: Will Strengthen Sanctions Against Russia's Oil And Gas Sector

Share

The G7 Reaffirmed That Iran Must Never Acquire Nuclear Weapons

Share

The Trump Administration Is Once Again Pushing To Transfer The Functions Of The Department Of Education

Share

Maritime Intelligence Firm Says Iran Has Exported Crude Oil For The First Time In Nearly Two Months

Share

Japan's June Reuters Tankan Non-manufacturing Business Conditions Diffusion Index Stood At 32, Up From The Previous Reading Of 29

Share

Russia Claims To Have Gained Control Of A Settlement, While Ukraine Says It Struck A Russian Oil Refinery

Share

New Zealand's Current Account Deficit Stood At -3.6% Of GDP On An Annualized Basis In The First Quarter, Compared With An Expected -3.70% And A Previous Reading Of -3.70%

Share

U.S. Treasury Options Traders Are Divided On The Federal Reserve's Interest-rate Trajectory, With Attention Focused On The Tone Of Chairman Powell's Press Conference

Share

Powell Declined To Release The Fed's Dot Plot Projections, Breaking A 14-year Tradition

TIME
ACT
FCST
PREV
IMPACT
Euro Zone Gross Wages YoY (Q1)

A:--

F: --

P: --

EURUSD
  • EURUSD
  • XAUUSD
  • XAGUSD
  • WTI
  • USDX
Euro Zone ZEW Current Conditions Index (Jun)

A:--

F: --

P: --

EURUSD
  • EURUSD
  • XAUUSD
  • XAGUSD
  • WTI
  • USDX
Germany ZEW Economic Sentiment Index (Jun)

A:--

F: --

P: --

EURUSD
  • EURUSD
  • XAUUSD
  • XAGUSD
  • WTI
  • USDX
Euro Zone Labor Cost YoY (Q1)

A:--

F: --

P: --

EURUSD
  • EURUSD
  • XAUUSD
  • XAGUSD
  • WTI
  • USDX
Euro Zone ZEW Economic Sentiment Index (Jun)

A:--

F: --

P: --

EURUSD
  • EURUSD
  • XAUUSD
  • XAGUSD
  • WTI
  • USDX
Germany ZEW Current Conditions Index (Jun)

A:--

F: --

P: --

EURUSD
  • EURUSD
  • XAUUSD
  • XAGUSD
  • WTI
  • USDX
U.K. 10-Year Note Auction Yield

A:--

F: --

P: --

GBPUSD
  • GBPUSD
  • XAUUSD
  • XAGUSD
  • WTI
  • USDX
Brazil Retail Sales MoM (Apr)

A:--

F: --

P: --

XAUUSD
  • XAUUSD
  • XAGUSD
  • WTI
  • USDX
U.S. Import Price Index YoY (May)

A:--

F: --

P: --

USDX
  • USDX
  • XAUUSD
  • XAGUSD
  • WTI
U.S. Building Permits MoM (SA) (May)

A:--

F: --

P: --

USDX
  • USDX
  • XAUUSD
  • XAGUSD
  • WTI
U.S. New Housing Starts Annualized MoM (SA) (May)

A:--

F: --

P: --
USDX
  • USDX
  • XAUUSD
  • XAGUSD
  • WTI
U.S. Export Price Index MoM (May)

A:--

F: --

P: --
USDX
  • USDX
  • XAUUSD
  • XAGUSD
  • WTI
U.S. Export Price Index YoY (May)

A:--

F: --

P: --

USDX
  • USDX
  • XAUUSD
  • XAGUSD
  • WTI
U.S. Import Price Index MoM (May)

A:--

F: --

P: --
USDX
  • USDX
  • XAUUSD
  • XAGUSD
  • WTI
U.S. Total Building Permits (SA) (May)

A:--

F: --

P: --

USDX
  • USDX
  • XAUUSD
  • XAGUSD
  • WTI
U.S. Annual New Housing Starts (SA) (May)

A:--

F: --

P: --
USDX
  • USDX
  • XAUUSD
  • XAGUSD
  • WTI
U.S. Weekly Redbook Index YoY

A:--

F: --

P: --

XAUUSD
  • XAUUSD
  • XAGUSD
  • WTI
  • USDX
ECB Chief Economist Lane Speaks
U.S. API Weekly Refined Oil Stocks

A:--

F: --

P: --

WTI
  • WTI
  • XAUUSD
  • XAGUSD
  • USDX
U.S. API Weekly Gasoline Stocks

A:--

F: --

P: --

WTI
  • WTI
  • XAUUSD
  • XAGUSD
  • USDX
U.S. API Weekly Cushing Crude Oil Stocks

A:--

F: --

P: --

WTI
  • WTI
  • XAUUSD
  • XAGUSD
  • USDX
U.S. API Weekly Crude Oil Stocks

A:--

F: --

P: --

WTI
  • WTI
  • XAUUSD
  • XAGUSD
  • USDX
Japan Reuters Tankan Manufacturers Index (Jun)

A:--

F: --

P: --

USDJPY
  • USDJPY
  • XAUUSD
  • XAGUSD
  • WTI
Japan Reuters Tankan Non-Manufacturers Index (Jun)

A:--

F: --

P: --

USDJPY
  • USDJPY
  • XAUUSD
  • XAGUSD
  • WTI
Japan Imports YoY (May)

A:--

F: --

P: --
USDJPY
  • USDJPY
  • XAUUSD
  • XAGUSD
  • WTI
  • USDX
Japan Exports YoY (May)

A:--

F: --

P: --

USDJPY
  • USDJPY
  • XAUUSD
  • XAGUSD
  • WTI
  • USDX
Japan Trade Balance (Not SA) (May)

A:--

F: --

P: --
USDJPY
  • USDJPY
  • XAUUSD
  • XAGUSD
  • WTI
  • USDX
Japan Goods Trade Balance (SA) (May)

A:--

F: --

P: --

USDJPY
  • USDJPY
  • XAUUSD
  • XAGUSD
  • WTI
  • USDX
Japan Core Machinery Orders YoY (Apr)

A:--

F: --

P: --

USDJPY
  • USDJPY
  • XAUUSD
  • XAGUSD
  • WTI
  • USDX
Japan Core Machinery Orders MoM (Apr)

A:--

F: --

P: --

USDJPY
  • USDJPY
  • XAUUSD
  • XAGUSD
  • WTI
  • USDX
Australia Westpac Leading Index MoM (May)

A:--

F: --

P: --

AUDUSD
  • AUDUSD
  • XAUUSD
  • XAGUSD
  • WTI
U.K. CPI MoM (May)

--

F: --

P: --

U.K. Core CPI YoY (May)

--

F: --

P: --

U.K. Output PPI MoM (Not SA) (May)

--

F: --

P: --

U.K. Retail Prices Index YoY (May)

--

F: --

P: --

U.K. Core Retail Prices Index YoY (May)

--

F: --

P: --

U.K. CPI YoY (May)

--

F: --

P: --

U.K. Retail Prices Index MoM (May)

--

F: --

P: --

U.K. Output PPI YoY (Not SA) (May)

--

F: --

P: --
U.K. Input PPI YoY (Not SA) (May)

--

F: --

P: --

U.K. Input PPI MoM (Not SA) (May)

--

F: --

P: --

U.K. Core CPI MoM (May)

--

F: --

P: --

South Africa Core CPI YoY (May)

--

F: --

P: --

South Africa CPI YoY (May)

--

F: --

P: --

IEA Oil Market Report
Euro Zone Core CPI Final MoM (May)

--

F: --

P: --

Euro Zone CPI YoY (Excl. Tobacco) (May)

--

F: --

P: --

South Africa Retail Sales YoY (Apr)

--

F: --

P: --

U.S. MBA Mortgage Application Activity Index WoW

--

F: --

P: --

U.S. Core Retail Sales (May)

--

F: --

P: --

U.S. Retail Sales (May)

--

F: --

P: --

U.S. Retail Sales YoY (May)

--

F: --

P: --

U.S. Retail Sales MoM (May)

--

F: --

P: --

U.S. Core Retail Sales MoM (May)

--

F: --

P: --

Canada New Housing Price Index MoM (May)

--

F: --

P: --

U.S. Commercial Inventory MoM (Apr)

--

F: --

P: --

U.S. Pending Home Sales Index YoY (May)

--

F: --

P: --

U.S. Pending Home Sales Index MoM (SA) (May)

--

F: --

P: --

U.S. Pending Home Sales Index (May)

--

F: --

P: --

U.S. EIA Weekly Crude Demand Projected by Production

--

F: --

P: --

U.S. EIA Weekly Cushing, Oklahoma Crude Oil Stocks Change

--

F: --

P: --

Q&A with Experts
    • All
    • Chatrooms
    • Groups
    • Friends
    Kung Fu flag
    Tom Moffitt
    @Kung Fu Yes I am new . Good to see you mate. I am looking gold to touch S1 which is around 4300 market loves to touch the round numbers. If that fails we can see 4280-4289
    @Tom MoffittIt's a great pleasure to have you here.
    Manav Kr flag
    tell me how was your trading experience since last few days.
    Kung Fu flag
    Manav Kr
    hii guys i'm new in market.
    @Manav KrNo worries. You're welcome here, friend. So, if I may ask, for how long have you been trading?
    Manav Kr flag
    I have learning last 2 years but i do not learn more.
    Kung Fu flag
    Manav Kr
    tell me how was your trading experience since last few days.
    @Manav KrIt's actually been great. I have been in this chatroom for about two years, but my trading experience spans two years, it spans five years.
    77 flag
    风神1号
    4341------4343 入场做空
    @风神1号 好的,sl?
    Kung Fu flag
    Manav Kr
    I have learning last 2 years but i do not learn more.
    @Manav Krhaving a two-year experience in trading. It's quite a feat. Don't you think?
    sl flag
    Kung Fu
    @slYes, I'm having a great day and a great start to the trading day. How are you, friend?
    @Kung Fubaik
    Manav Kr flag
    Kung Fu
    @Manav KrIt's actually been great. I have been in this chatroom for about two years, but my trading experience spans two years, it spans five years.
    @Kung Fu Oo wow that's good . Then you must have learned quite well in trading.
    风神1号 flag
    41 保本没有sl
    Kung Fu flag
    77
    @风神1号 好的,sl?
    @77you've got to watch those prices if you're interesting in shorting gold.
    77 flag
    okkk
    Kung Fu flag
    Manav Kr
    @Kung Fu Oo wow that's good . Then you must have learned quite well in trading.
    @Manav KrI have learned and I am still learning. There's no end in sight.
    4457489 flag
    como estan? quien tiene alguna operacion de BTC en la mira?
    Kung Fu flag
    sl
    @Kung Fubaik
    @slHappy day. Hope everything's going well today
    Kung Fu flag
    4457489
    como estan? quien tiene alguna operacion de BTC en la mira?
    @Visitor4457489not really however we can talk about it if you don't mind
    4776364 flag
    heelo
    Kung Fu flag
    4776364
    heelo
    @Visitor4776364What's up with you, friend?
    sl flag
    Kung Fu
    @slHappy day. Hope everything's going well today
    @Kung Fuapakah anda sudah mempunyai posisi berdagang
    Kung Fu flag
    sl
    @Kung Fuapakah anda sudah mempunyai posisi berdagang
    @slNo, I don't. I don't. The market just opened. That is how I'm going to read it, if you like.
    Type here...
    Add Symbol or Code

      No matching data

      All
      Recommend
      Stocks
      Cryptocurrencies
      Central Banks
      Trump Updates
      Featured News
      • All
      • Russia-Ukraine Conflict
      • Middle East Flashpoint
      • All
      • Russia-Ukraine Conflict
      • Middle East Flashpoint

      Search
      Products

      Charts Free Forever

      Chats Q&A with Experts
      Screeners Economic Calendar Data Tools
      Membership Features
      Data Warehouse Market Trends Institutional Data Policy Rates Macro

      Market Trends

      Market Sentiment Order Book Forex Correlations

      Top Indicators

      Charts Free Forever
      Markets

      News

      24/7 Analysis Education

      Latest Views

      Latest Update

      Signals

      Copy Rankings Latest Signals Become a signal provider AI Rating
      Contests
      Brokers

      Overview Brokers Assessment Rankings Regulators News Claims
      Broker listing Forex Brokers Comparison Tool Live Spread Comparison Scam
      Q&A Complaint Scam Alert Videos Tips to Detect Scam
      More

      Business
      Events
      Careers About Us Advertising Help Center

      White Label

      Broker API

      Data API

      Web Plug-ins

      Affiliate Program

      Awards Institution Evaluation IB Seminar Salon Event Exhibition
      Vietnam Thailand Singapore Dubai
      Fans Party Investment Sharing Session
      FastBull Summit BrokersView Expo
      Recent Searches
        Top Searches
          Markets
          Analysis
          User
          24/7
          Economic Calendar
          Education
          Data
          • Names
          • Latest
          • Prev

          View All

          No data

          Scan to Download

          Faster Charts, Chat Faster!

          Download
          English
          • English
          • Español
          • العربية
          • Bahasa Indonesia
          • Bahasa Melayu
          • Tiếng Việt
          • ภาษาไทย
          • Français
          • Italiano
          • Türkçe
          • Русский язык
          • 简中
          • 繁中
          Open Account
          Search
          Products
          Charts Free Forever
          Markets
          News
          Signals

          Copy Rankings Latest Signals Become a signal provider AI Rating
          Contests
          Brokers

          Overview Brokers Assessment Rankings Regulators News Claims
          Broker listing Forex Brokers Comparison Tool Live Spread Comparison Scam
          Q&A Complaint Scam Alert Videos Tips to Detect Scam
          More

          Business
          Events
          Careers About Us Advertising Help Center

          White Label

          Broker API

          Data API

          Web Plug-ins

          Affiliate Program

          Awards Institution Evaluation IB Seminar Salon Event Exhibition
          Vietnam Thailand Singapore Dubai
          Fans Party Investment Sharing Session
          FastBull Summit BrokersView Expo

          What Is A Doji Candle, And How Can You Use It In Trading?

          FXOpen

          Economic

          Forex

          Stocks

          Cryptocurrency

          Summary:

          A Doji candle is a technical analysis tool reflecting the uncertainties in the market. Although it provides strong signals, it should be used with other patterns or technical indicators.

          A Doji candle is a technical analysis tool reflecting the uncertainties in the market. Although it provides strong signals, it should be used with other patterns or technical indicators. Why do traders look for Dojis when trading stocks, commodities, and currencies?

          What Is a Doji Candle?

          A Doji is a pattern that consists of a single candle. It looks very different from other candlesticks. Therefore, traders of any level of experience can determine it on a price chart. The Doji has a tiny body comprising equal or almost equal open and close prices and long shadows. What does a Doji candlestick mean? A short body informs traders about the indecision of buyers and sellers as none of them can drive the market. Long shadows reflect a market uncertainty. The longer the shadows, the more significant the market uncertainties.

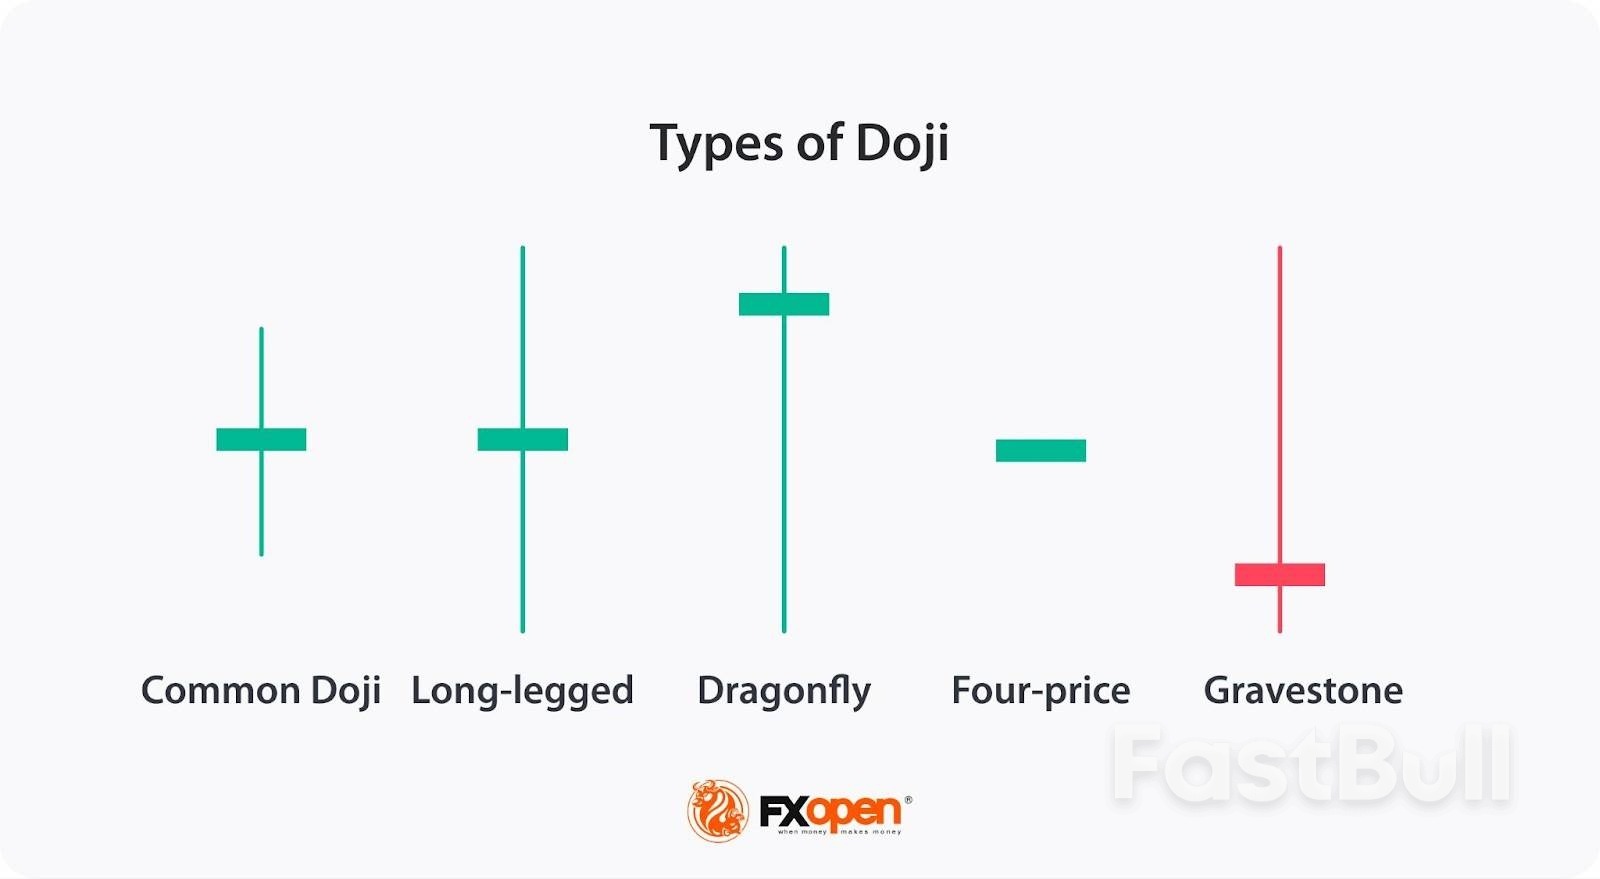
          How Can You Spot a Doji Candle?

          The most common types of Doji candles are standard, long-legged, Dragonfly, Gravestone, and four-price.

          ● The Standard Doji is characterised by a small or non-existent body and wicks of various lengths. When found at the end of a prevailing trend, it can indicate a possible trend reversal, signalling a shift in market sentiment. However, in a consolidating or sideways market, the Standard Doji may suggest continued uncertainty, implying that the market could remain range-bound without a clear direction.
          ● The Long-Legged Doji comprises a short body and very long wicks, reflecting significant market doubts. At the end of a trend, a Long-Legged Doji candlestick may suggest a trend reversal. Appearing in a consolidating market, this setup may mean a flat market will prevail.
          ● The Dragonfly Doji has a short body and a long lower shadow, while an upper shadow is either small or absent. It tells traders that sellers failed to pull the price down. Therefore, its reversal signal is stronger at the end of a downtrend.
          ● The Gravestone Doji also has a small body, but its upper wick is long, while the lower wick is short or absent. Typically a reversal Doji candlestick informs traders that buyers couldn’t push the price up. Therefore, if the Gravestone Doji candle occurs at the end of an uptrend, the probability of a reversal is higher.
          ● The Four-Price Doji isn’t a common formation. It consists of a horizontal line that indicates that open, close, high, and low prices are equal or almost equal. Usually, the pattern appears in illiquid markets.

          How to Distinguish Between a Spinning Top and a Doji

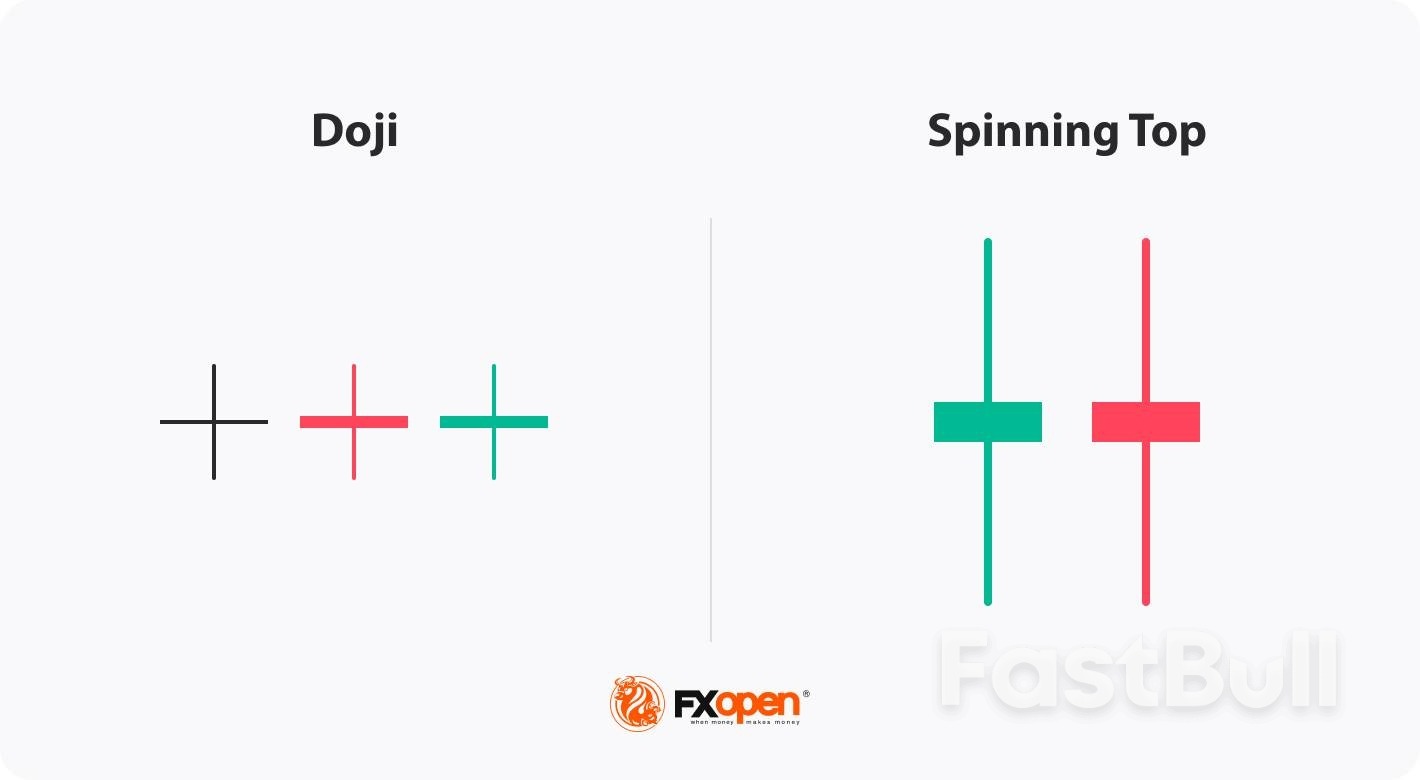
          Traders may confuse Dojis with Spinning Tops as they look very similar. The theory suggests that Doji’s open and close prices are equal or nearly equal. Therefore, a Doji has a tiny body, so the difference between open and close rates is barely noticeable. A Spinning Top has a small body but the difference between the open and close rates is visible.

          Confirmation Tools

          Traders may be caught in a trap if they rely solely on a Doji candle, meaning they need to combine Dojis with other technical tools to get reliable signals. These are some basic rules traders apply when reading a Doji candlestick pattern’s signals:

          Trend strength. The first thing traders consider is the trend. Doji candles can appear before the continuation and reversal of a trend. If the market rises for an extended period, a newly formed Doji may be a sign of bull exhaustion. Conversely, appearing in a prolonged downtrend, it may signal an upcoming trend reversal. If the candle is visible in a newly formed trend, the trend will likely continue.

          Additional indicators. If you find a Doji setup, it may be helpful to look for additional signals of other patterns or technical indicators. To confirm reversals, traders usually implement oscillators such as MACD, Stochastic, and RSI, which reflect overbought/oversold conditions, and indicators such as Average Directional Index that reflect the trend strength. Support and resistance levels can also be helpful when identifying trend reversals. The lack of a reversal confirmation may be a sign of a sideways movement or a trend continuation.

          Most Reliable Timeframes for Doji Candlestick Patterns

          Doji candles can be observed across various timeframes, but their reliability increases in higher timeframes, such as the 4-hour, daily, or weekly charts. In these periods, Doji patterns hold more significance due to the larger sample of market data they encompass, reducing the noise found in shorter timeframes like the 1-minute or 5-minute charts.

          Traders tend to use Dojis on these higher timeframes to capture key market reversals or trend continuations with more confidence. In contrast, Dojis on lower timeframes can be less dependable because they often form due to temporary price fluctuations and minor market indecision.

          Broad Market Context

          Understanding the broader market context is key when interpreting Doji candles. A Doji by itself provides limited insight, but when viewed within the larger market environment, its signals can become more meaningful.

          Market Sentiment

          The broader market sentiment can impact how Doji candles are interpreted. In a strong bull market, a bearish Doji candle may signal a temporary pause rather than a full reversal, especially if there is no significant change in overall sentiment. Similarly, in a bearish environment, a bullish Doji may suggest indecision but not necessarily a complete trend shift. Observing market news, events, or fundamental data can provide additional clues about the market’s direction.

          Economic Indicators

          Major economic reports, interest rate decisions, and geopolitical developments can influence the formation of Doji candles. For instance, during the release of critical economic data, Doji patterns may appear as traders hesitate to commit to a direction until the news is fully digested. Traders often avoid making decisions based on Dojis during such high-volatility periods, preferring to wait for the market to settle before drawing conclusions.

          Trend Phase

          A Doji’s reliability also depends on the phase of the trend. In a well-established trend, Dojis can serve as a signal of market exhaustion, suggesting a possible reversal or slowdown. However, during periods of consolidation or ranging markets, Dojis might simply indicate ongoing indecision, reflecting sideways price action without any imminent breakout.

          How Traders Use Doji Candles

          Dojis can be found in different market conditions and their signals will vary significantly.

          End of a Trend

          A Doji can appear in up- and downtrends.

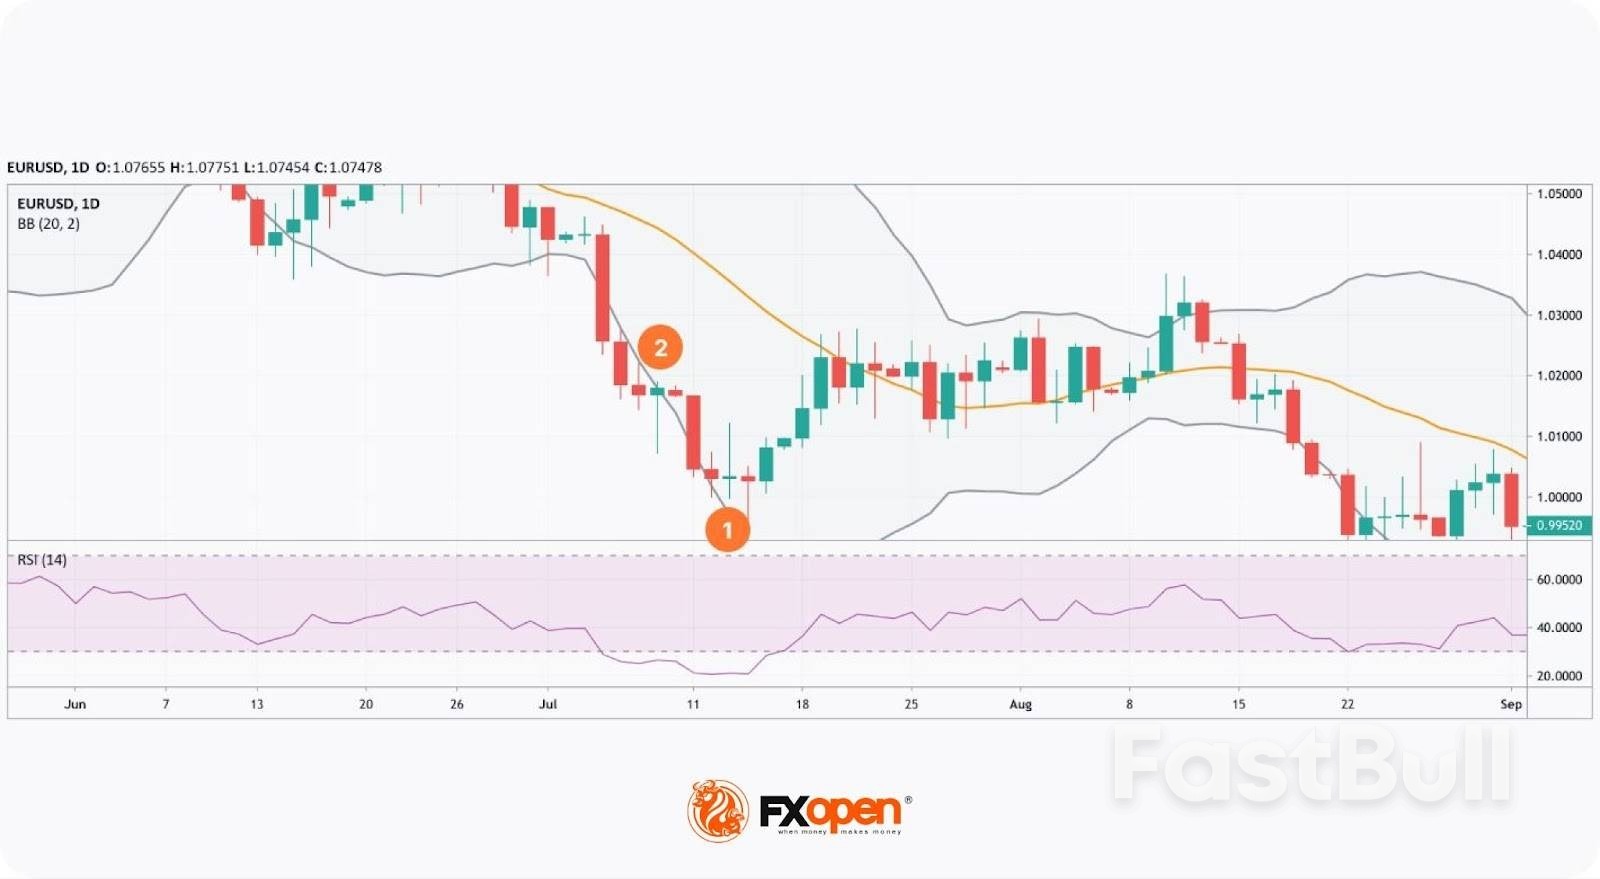
          On the chart above, the EUR/USD pair formed a spinning top and two forex Doji candlesticks, a Gravestone and a Dragonfly at the end of a downtrend (1). At that time, the RSI indicator was in the oversold area, and the pair was near the lower band of the Bollinger Bands indicator. After, the market turned around.

          However, if you have noticed, there was another Dragonfly Doji several candles ahead (2). Then, the RSI indicator was also in the oversold area, and the price was near the lower band of the Bollinger Bands indicator. You could wait for the RSI to leave the oversold zone to avoid a losing buy trade.

          Sideways Market

          The previous example can be used to explain another standard theory that a more significant number of Dojis results in a more reliable signal. However, while the last example confirms the theory, another refutes it.

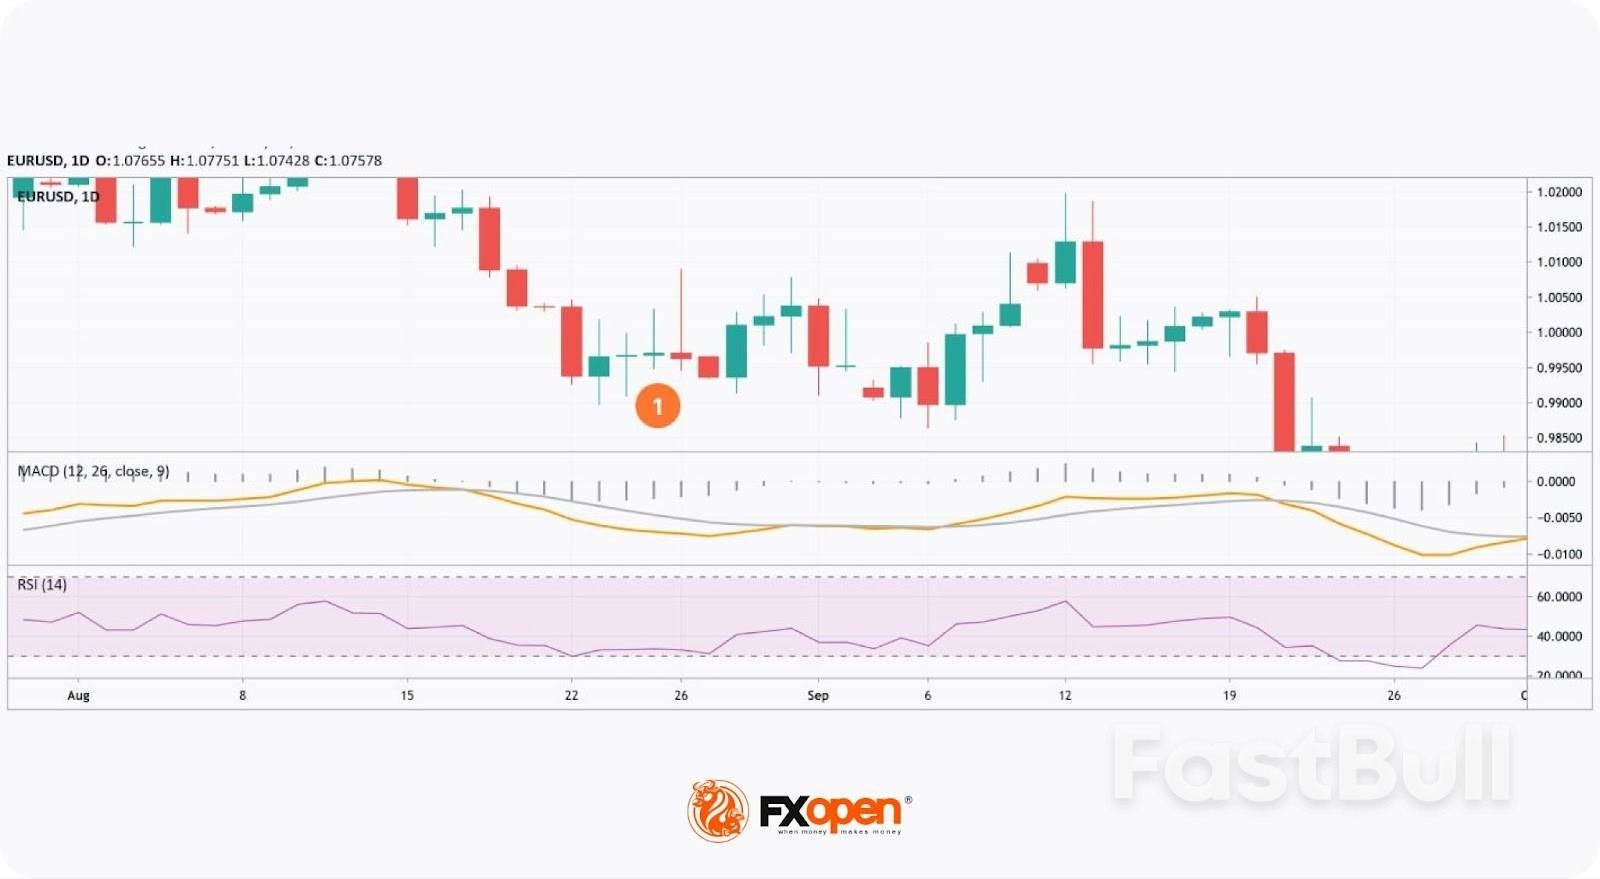
          On the chart above, there are three Dojis — long-legged and two Gravestones (1), formed after a downtrend. However, their appearance didn’t lead to a trend reversal — it was a medium-term consolidation ending with a continuation of a downtrend. The consolidation was confirmed by the lack of signals from common trend reversal indicators — the MACD and the RSI.

          Common Mistakes

          While Doji candle patterns can be useful in trading, there are several common mistakes traders make when interpreting them. Here are some pitfalls to avoid:

          ● Over-reliance on Doji candles alone: There isn’t enough information to gather from a single Doji candle, meaning it’s difficult to make accurate trading decisions using them in isolation. Traders who rely solely on Dojis without considering other technical indicators or market conditions may enter trades prematurely or miss important signals.
          ● Ignoring the broader trend: Dojis appearing in the middle of a strong trend don’t always signal reversals. Traders often mistake the formation as a sign of change, when it could simply be a temporary pause before the trend resumes.
          ● Misinterpreting timeframes: Lower timeframes, such as 1-minute or 5-minute charts, can produce Dojis frequently, which can be misleading. They’re often a result of minor market noise, rather than significant indecision or trend shifts.
          ● Failing to wait for a confirmation: Entering a trade right after a Doji forms can lead to losses, especially if there is no confirmation from other indicators, such as volume, RSI, or moving averages. Waiting for confirmation may potentially prevent false signals.
          ● Overtrading Doji patterns: Traders may try to act on every pattern they see, leading to overtrading. Not every Doji is worth acting on, especially in consolidating markets.

          Final Thoughts

          A Doji isn't a common instrument to determine market direction. Still, it may be used as a barometer of the market sentiment that may lead to particular price movements. The theory suggests that traders do comprehensive analysis and combine Dojis with other technical tools before they enter or exit the market.

          FAQ

          What Does a Doji Candle Indicate?

          A Doji candle signals market indecision, as the opening and closing prices are nearly identical. It often represents a balance between buyers and sellers, leading to a potential reversal or continuation depending on the broader market context and trend.

          Is a Doji Candle Bullish or Bearish?

          A Doji candle is neither inherently bullish nor bearish. Its interpretation depends on its position within a trend. In an uptrend, it may suggest a bearish reversal, while in a downtrend, it could signal a bullish reversal. In either scenario, it may also signal a period of market indecision.

          What Does a Doji Mean in a Downtrend?

          In a downtrend, a Doji often signals that the sellers are losing strength, hinting at a potential bullish reversal. However, confirmation through other technical indicators is often sought before acting on this signal.

          Source: FXOpen

          To stay updated on all economic events of today, please check out our Economic calendar
          Risk Warnings and Disclaimers
          You understand and acknowledge that there is a high degree of risk involved in trading. Following any strategies or investment methods may lead to potential losses. The content on the site is provided by our contributors and analysts for information purposes only. You are solely responsible for determining whether any trading assets, securities, strategy, or any other product is suitable for investing based on your own investment objectives and financial situation.
          Add to Favorites
          Share
          FastBull
          Copyright © 2026 FastBull Ltd

          728 RM B 7/F GEE LOK IND BLDG NO 34 HUNG TO RD KWUN TONG KLN HONG KONG

          TelegramInstagramTwitterfacebooklinkedin
          App Store Google Play Android Windows
          Products
          Charts

          Chats

          Q&A with Experts
          Screeners
          Economic Calendar
          Data
          Tools
          Membership
          Features
          Function
          Markets
          Copy Trading
          Latest Signals
          Contests
          24/7
          Analysis
          Education
          Company
          Careers
          About Us
          Contact Us
          Advertising
          Download FastBull
          Help Center
          Feedback
          User Agreement
          Privacy Policy
          Personal Information Protection Statement
          Business

          White Label

          Broker API

          Data API

          Web Plug-ins

          Poster Maker

          Affiliate Program

          Risk Disclosure

          The risk of loss in trading financial instruments such as stocks, FX, commodities, futures, bonds, ETFs and crypto can be substantial. You may sustain a total loss of the funds that you deposit with your broker. Therefore, you should carefully consider whether such trading is suitable for you in light of your circumstances and financial resources.

          No decision to invest should be made without thoroughly conducting due diligence by yourself or consulting with your financial advisors. Our web content might not suit you since we don't know your financial conditions and investment needs. Our financial information might have latency or contain inaccuracy, so you should be fully responsible for any of your trading and investment decisions. The company will not be responsible for your capital loss.

          Without getting permission from the website, you are not allowed to copy the website's graphics, texts, or trademarks. Intellectual property rights in the content or data incorporated into this website belong to its providers and exchange merchants.

          Not Logged In

          Log in to access more features

          Connect Broker
          Become a signal provider
          Help Center
          Customer Service
          Dark Mode
          Price Up/Down Colors

          Log In

          Sign Up

          Position
          Layout
          Fullscreen
          Default to Chart
          The chart page opens by default when you visit fastbull.com