Markets
News
Analysis
User
24/7
Economic Calendar
Education
Data
- Names
- Latest
- Prev


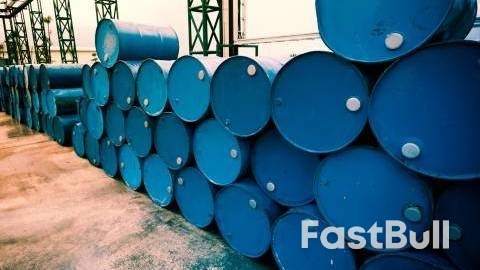
Oil prices moved higher yesterday, settling just shy of 0.5% higher, despite a bearish weekly Energy Information Administration (EIA) inventory report. Also, a monthly International Energy Agency (IEA) release again highlighted expectations for a sizable oil surplus in 2026.
Oil prices moved higher yesterday, settling just shy of 0.5% higher, despite a bearish weekly Energy Information Administration (EIA) inventory report. Also, a monthly International Energy Agency (IEA) release again highlighted expectations for a sizable oil surplus in 2026.
The EIA's report showed that US crude oil inventories increased by 6.4m barrels over the last week, larger than expected and more than the 1.3m barrel increase the API reported the previous day. This leaves crude stocks at their highest level since June. Seasonally, they are at their lowest level since 2014. The increase was largely driven by weaker exports, which declined by 1.55m b/d week on week. For refined products, gasoline and distillate stocks fell by 945k barrels and 637k barrels, respectively. These inventory declines come despite refiners increasing utilisation rates by 3.4 percentage points, week on week, to 89.4%. Run rates are expected to increase as refinery maintenance concludes, while healthy refinery margins are likely to also support higher refinery run rates.
The IEA's monthly report continues to indicate a well-supplied market. The agency estimates that global oil supply will grow by 3.1m b/d and 2.5m b/d in 2025 and 2026, respectively. Meanwhile, demand growth is forecast to be more modest, with the IEA expecting it to increase by just 790k per day (b/d) in 2025 and a further 770k b/d in 2026. In terms of oil inventories, the IEA estimates that global observed stocks surged by 77.7m barrels in September, with a large increase in floating storage. Meanwhile, preliminary data shows that global stocks increased further in October, driven once again by floating storage.
While the ICE gasoil crack has fallen from its recent highs over the past couple of days, it remains at elevated levels, above $30/bbl. As we head deeper into the Northern hemisphere winter, refinery maintenance season, a number of unplanned refinery outages, Russian sanction uncertainty and low stocks have kept the middle distillate market well-supported. The latest inventory data from Enterprise Singapore shows that onshore middle distillate stocks in the nation fell by 119k barrels over the last week. In the Amsterdam-Rotterdam-Antwerp (ARA) region, gasoil stocks increased by 87kt WoW to 2.29mt, according to Insights Global.
728 RM B 7/F GEE LOK IND BLDG NO 34 HUNG TO RD KWUN TONG KLN HONG KONG


The risk of loss in trading financial instruments such as stocks, FX, commodities, futures, bonds, ETFs and crypto can be substantial. You may sustain a total loss of the funds that you deposit with your broker. Therefore, you should carefully consider whether such trading is suitable for you in light of your circumstances and financial resources.
No decision to invest should be made without thoroughly conducting due diligence by yourself or consulting with your financial advisors. Our web content might not suit you since we don't know your financial conditions and investment needs. Our financial information might have latency or contain inaccuracy, so you should be fully responsible for any of your trading and investment decisions. The company will not be responsible for your capital loss.
Without getting permission from the website, you are not allowed to copy the website's graphics, texts, or trademarks. Intellectual property rights in the content or data incorporated into this website belong to its providers and exchange merchants.
Not Logged In
Log in to access more features

FastBull Membership
Not yet
Purchase


Log In
Sign Up