• Trade
  • Markets
  • Copy
  • Contests
  • News
  • 24/7
  • Calendar
  • Q&A
  • Chats
Trending
Screeners
SYMBOL
LAST
BID
ASK
HIGH
LOW
NET CHG.
%CHG.
SPREAD
SPX
S&P 500 Index
6813.60
6813.60
6813.60
6861.30
6801.50
-13.81
-0.20%
--
DJI
Dow Jones Industrial Average
48395.62
48395.62
48395.62
48679.14
48317.93
-62.42
-0.13%
--
IXIC
NASDAQ Composite Index
23067.32
23067.32
23067.32
23345.56
23012.00
-127.84
-0.55%
--
USDX
US Dollar Index
97.800
97.880
97.800
98.070
97.740
-0.150
-0.15%
--
EURUSD
Euro / US Dollar
1.17596
1.17604
1.17596
1.17686
1.17262
+0.00202
+ 0.17%
--
GBPUSD
Pound Sterling / US Dollar
1.33935
1.33944
1.33935
1.34014
1.33546
+0.00228
+ 0.17%
--
XAUUSD
Gold / US Dollar
4321.89
4322.23
4321.89
4350.16
4294.68
+22.50
+ 0.52%
--
WTI
Light Sweet Crude Oil
56.638
56.668
56.638
57.601
56.625
-0.595
-1.04%
--

Community Accounts

Signal Accounts
--
Profit Accounts
--
Loss Accounts
--
View More

Become a signal provider

Sell trading signals to earn additional income

View More

Guide to Copy Trading

Get started with ease and confidence

View More

Signal Accounts for Members

All Signal Accounts

Best Return
  • Best Return
  • Best P/L
  • Best MDD
Past 1W
  • Past 1W
  • Past 1M
  • Past 1Y

All Contests

  • All
  • Trump Updates
  • Recommend
  • Stocks
  • Cryptocurrencies
  • Central Banks
  • Featured News
Top News Only
Share

EU's Kallas: China Is Increasingly Weaponizing Economic Ties For Political Gains

Share

Fbi Director: A Fifth Individual Believed To Be Planning A Separate Attack Arrested By Fbi New Orleans

Share

New York Fed President Williams: The 2% Inflation Target Must Be Achieved Without Impacting The Job Market

Share

New York Fed President Williams: Monetary Policy Very Focused On Balancing Job, Inflation Risks

Share

New York Fed President Williams Expects USA Unemployment To Be 4.5% By End Of 2025

Share

New York Fed President Williams: Labor Market Risks Have Risen As Risks To Inflation Have Eased

Share

New York Fed President Williams Expects Inflation To Move To 2.5% In 2026, 2% In 2027

Share

New York Fed President Williams Sees Tariffs As A One-Off Price Adjustment, Not Spilling Over Into Broader Inflation

Share

New York Fed President Williams: Labor Market Cooling Has Been Gradual Process

Share

New York Fed President Williams Expects Active Usage Of Standing Repo Facility To Manage Liquidity

Share

New York Fed President Williams: Critical For USA Central Bank To Get Inflation Back To 2%

Share

New York Fed President Williams Expects 2026 GDP Growth To Hit 2.25%, Well Above 2025 Rate

Share

New York Fed President Williams Projects Jobless Rate Will Come Back Down Over Next Few Years

Share

New York Fed President Williams: Fed Policy Has Moved Toward Neutral From Modestly Restrictive

Share

Federal Reserve Governor Milan: I Would Be Happy To Vote For The Re-election Of Regional Fed Presidents

Share

Miran: What Is Most Surprising Is How Nice And Collegial The Fed Has Been

Share

Miran: The Least Attractive Part Of Being At The Fed Is Having Only 1 Of 12 Votes On A Committee

Share

White House To Host Press Call On Russia-Ukraine Peace Talks

Share

Miran: Was Delighted To Vote In Favor Of Reappointing Current Reserve Bank Presidents, Think They Are Doing A Good Job

Share

Miran: The Reserve Banks Play A Valuable Role In Providing Local Perspectives And Contacts

TIME
ACT
FCST
PREV
Japan Tankan Small Manufacturing Outlook Index (Q4)

A:--

F: --

P: --

Japan Tankan Large Non-Manufacturing Outlook Index (Q4)

A:--

F: --

P: --

Japan Tankan Large Manufacturing Outlook Index (Q4)

A:--

F: --

P: --

Japan Tankan Small Manufacturing Diffusion Index (Q4)

A:--

F: --

P: --

Japan Tankan Large-Enterprise Capital Expenditure YoY (Q4)

A:--

F: --

P: --

U.K. Rightmove House Price Index YoY (Dec)

A:--

F: --

P: --

China, Mainland Industrial Output YoY (YTD) (Nov)

A:--

F: --

P: --

China, Mainland Urban Area Unemployment Rate (Nov)

A:--

F: --

P: --

Saudi Arabia CPI YoY (Nov)

A:--

F: --

P: --

Euro Zone Industrial Output YoY (Oct)

A:--

F: --

P: --

Euro Zone Industrial Output MoM (Oct)

A:--

F: --

P: --

Canada Existing Home Sales MoM (Nov)

A:--

F: --

P: --

Canada National Economic Confidence Index

A:--

F: --

P: --

Canada New Housing Starts (Nov)

A:--

F: --

P: --
U.S. NY Fed Manufacturing Employment Index (Dec)

A:--

F: --

P: --

U.S. NY Fed Manufacturing Index (Dec)

A:--

F: --

P: --

Canada Core CPI YoY (Nov)

A:--

F: --

P: --

Canada Manufacturing Unfilled Orders MoM (Oct)

A:--

F: --

P: --

U.S. NY Fed Manufacturing Prices Received Index (Dec)

A:--

F: --

P: --

U.S. NY Fed Manufacturing New Orders Index (Dec)

A:--

F: --

P: --

Canada Manufacturing New Orders MoM (Oct)

A:--

F: --

P: --

Canada Core CPI MoM (Nov)

A:--

F: --

P: --

Canada Trimmed CPI YoY (SA) (Nov)

A:--

F: --

P: --

Canada Manufacturing Inventory MoM (Oct)

A:--

F: --

P: --

Canada CPI YoY (Nov)

A:--

F: --

P: --

Canada CPI MoM (Nov)

A:--

F: --

P: --

Canada CPI YoY (SA) (Nov)

A:--

F: --

P: --

Canada Core CPI MoM (SA) (Nov)

A:--

F: --

P: --

Canada CPI MoM (SA) (Nov)

A:--

F: --

P: --

Federal Reserve Board Governor Milan delivered a speech
U.S. NAHB Housing Market Index (Dec)

A:--

F: --

P: --

Australia Composite PMI Prelim (Dec)

--

F: --

P: --

Australia Services PMI Prelim (Dec)

--

F: --

P: --

Australia Manufacturing PMI Prelim (Dec)

--

F: --

P: --

Japan Manufacturing PMI Prelim (SA) (Dec)

--

F: --

P: --

U.K. 3-Month ILO Employment Change (Oct)

--

F: --

P: --

U.K. Unemployment Claimant Count (Nov)

--

F: --

P: --

U.K. Unemployment Rate (Nov)

--

F: --

P: --

U.K. 3-Month ILO Unemployment Rate (Oct)

--

F: --

P: --

U.K. Average Weekly Earnings (3-Month Average, Including Bonuses) YoY (Oct)

--

F: --

P: --

U.K. Average Weekly Earnings (3-Month Average, Excluding Bonuses) YoY (Oct)

--

F: --

P: --

France Services PMI Prelim (Dec)

--

F: --

P: --

France Composite PMI Prelim (SA) (Dec)

--

F: --

P: --

France Manufacturing PMI Prelim (Dec)

--

F: --

P: --

Germany Services PMI Prelim (SA) (Dec)

--

F: --

P: --

Germany Manufacturing PMI Prelim (SA) (Dec)

--

F: --

P: --

Germany Composite PMI Prelim (SA) (Dec)

--

F: --

P: --

Euro Zone Composite PMI Prelim (SA) (Dec)

--

F: --

P: --

Euro Zone Services PMI Prelim (SA) (Dec)

--

F: --

P: --

Euro Zone Manufacturing PMI Prelim (SA) (Dec)

--

F: --

P: --

U.K. Services PMI Prelim (Dec)

--

F: --

P: --

U.K. Manufacturing PMI Prelim (Dec)

--

F: --

P: --

U.K. Composite PMI Prelim (Dec)

--

F: --

P: --

Euro Zone ZEW Economic Sentiment Index (Dec)

--

F: --

P: --

Germany ZEW Current Conditions Index (Dec)

--

F: --

P: --

Germany ZEW Economic Sentiment Index (Dec)

--

F: --

P: --

Euro Zone Trade Balance (Not SA) (Oct)

--

F: --

P: --

Euro Zone ZEW Current Conditions Index (Dec)

--

F: --

P: --

Euro Zone Trade Balance (SA) (Oct)

--

F: --

P: --

U.S. Retail Sales MoM (Excl. Gas Stations & Vehicle Dealers) (SA) (Oct)

--

F: --

P: --

U.S. Retail Sales MoM (Excl. Automobile) (SA) (Oct)

--

F: --

P: --

Q&A with Experts
    • All
    • Chatrooms
    • Groups
    • Friends
    Connecting
    .
    .
    .
    Type here...
    Add Symbol or Code

      No matching data

      All
      Trump Updates
      Recommend
      Stocks
      Cryptocurrencies
      Central Banks
      Featured News
      • All
      • Russia-Ukraine Conflict
      • Middle East Flashpoint
      • All
      • Russia-Ukraine Conflict
      • Middle East Flashpoint

      Search
      Products

      Charts Free Forever

      Chats Q&A with Experts
      Screeners Economic Calendar Data Tools
      Membership Features
      Data Warehouse Market Trends Institutional Data Policy Rates Macro

      Market Trends

      Market Sentiment Order Book Forex Correlations

      Top Indicators

      Charts Free Forever
      Markets

      News

      News Analysis 24/7 Columns Education
      From Institutions From Analysts
      Topics Columnists

      Latest Views

      Latest Views

      Trending Topics

      Top Columnists

      Latest Update

      Signals

      Copy Rankings Latest Signals Become a signal provider AI Rating
      Contests
      Brokers

      Overview Brokers Assessment Rankings Regulators News Claims
      Broker listing Forex Brokers Comparison Tool Live Spread Comparison Scam
      Q&A Complaint Scam Alert Videos Tips to Detect Scam
      More

      Business
      Events
      Careers About Us Advertising Help Center

      White Label

      Data API

      Web Plug-ins

      Affiliate Program

      Awards Institution Evaluation IB Seminar Salon Event Exhibition
      Vietnam Thailand Singapore Dubai
      Fans Party Investment Sharing Session
      FastBull Summit BrokersView Expo
      Recent Searches
        Top Searches
          Markets
          News
          Analysis
          User
          24/7
          Economic Calendar
          Education
          Data
          • Names
          • Latest
          • Prev

          View All

          No data

          Scan to Download

          Faster Charts, Chat Faster!

          Download App
          English
          • English
          • Español
          • العربية
          • Bahasa Indonesia
          • Bahasa Melayu
          • Tiếng Việt
          • ภาษาไทย
          • Français
          • Italiano
          • Türkçe
          • Русский язык
          • 简中
          • 繁中
          Open Account
          Search
          Products
          Charts Free Forever
          Markets
          News
          Signals

          Copy Rankings Latest Signals Become a signal provider AI Rating
          Contests
          Brokers

          Overview Brokers Assessment Rankings Regulators News Claims
          Broker listing Forex Brokers Comparison Tool Live Spread Comparison Scam
          Q&A Complaint Scam Alert Videos Tips to Detect Scam
          More

          Business
          Events
          Careers About Us Advertising Help Center

          White Label

          Data API

          Web Plug-ins

          Affiliate Program

          Awards Institution Evaluation IB Seminar Salon Event Exhibition
          Vietnam Thailand Singapore Dubai
          Fans Party Investment Sharing Session
          FastBull Summit BrokersView Expo

          Nasdaq 100 Chart Analysis After The Fed Decision

          FXOpen

          Stocks

          Summary:

          The Nasdaq 100 index showed sharp volatility yesterday following the interest rate announcement. The market action can be interpreted as follows:→ First, the FOMC decision

          The Nasdaq 100 index (US Tech 100 mini on FXOpen) showed sharp volatility yesterday following the interest rate announcement. The market action can be interpreted as follows:

          → First, the FOMC decision was released: as expected, the Federal Funds Rate was cut from 4.00% to 3.75% (a bullish catalyst), which pushed the index up towards point A.

          → However, half an hour later Jerome Powell's press conference began, and his tone was noticeably hawkish (a bearish catalyst). The Fed Chair signalled that the rate-cutting cycle has been paused because inflation remains elevated and additional labour-market data is needed. As a result, the index fell sharply from point A to the low at point B.

          Meanwhile, Donald Trump criticised the Fed's decision, arguing that rates should be cut far more aggressively. This adds to uncertainty, especially given expectations that Powell will leave his post in May 2026.

          Bearish pressure on the tech index intensified further after Oracle's earnings release — see yesterday's post for details. The results disappointed investors, fuelling renewed talk of an AI bubble, and ORCL shares plunged around 11% in after-hours trading.

          Technical Analysis of the Nasdaq 100 Chart

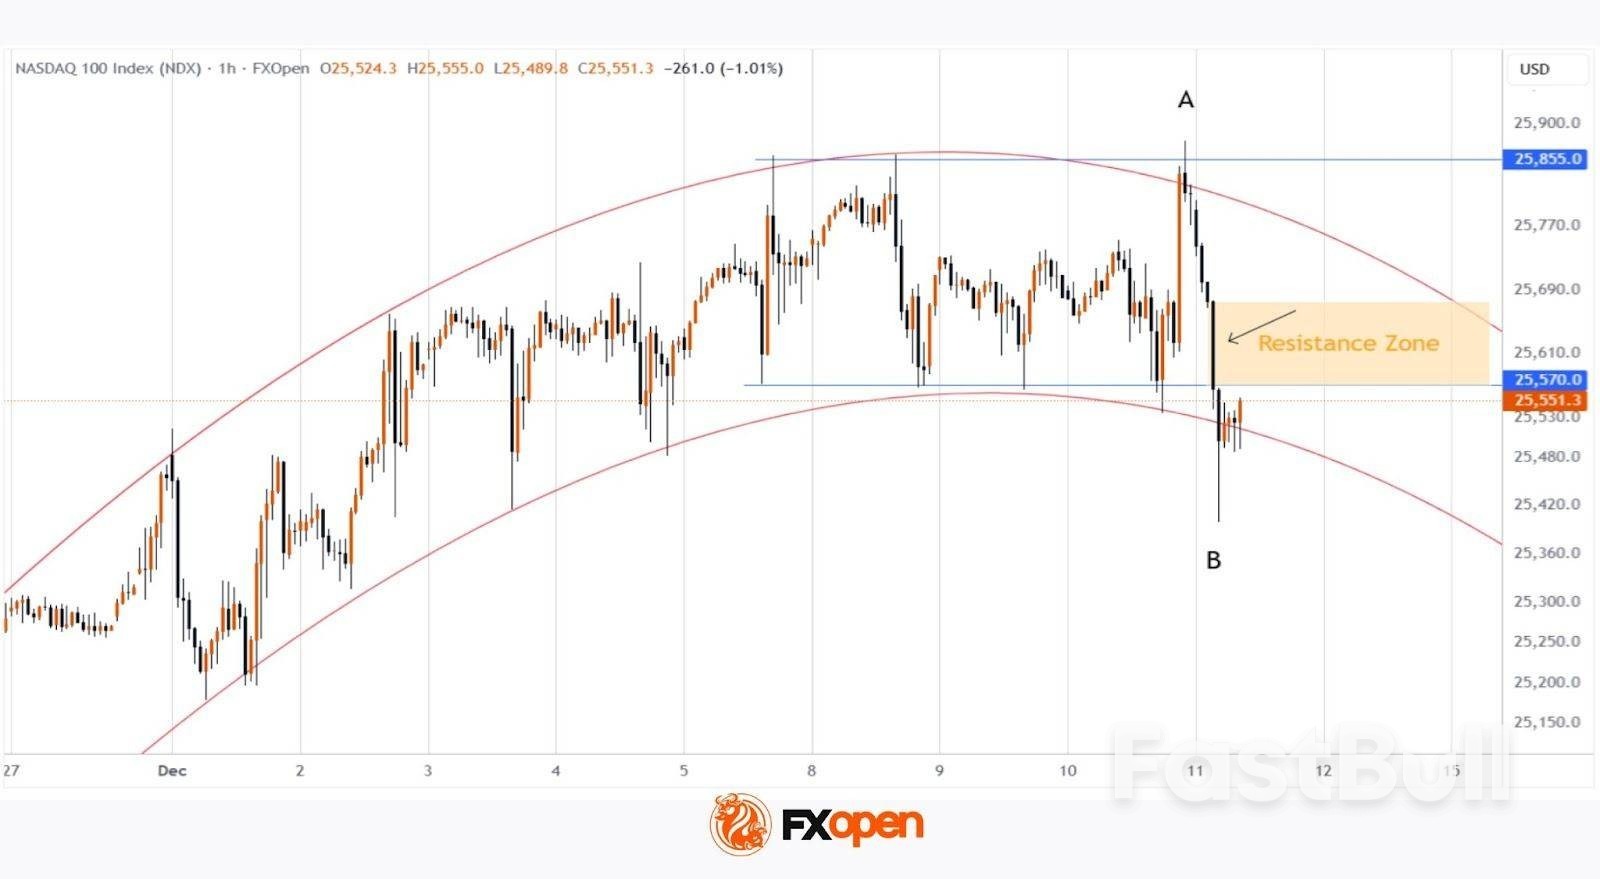
          Looking at recent price action in the Nasdaq 100 (US Tech 100 mini on FXOpen), the index appears to be forming a bearish Rounding Top pattern:

          → The peak at point A resembles a bull trap, as the price only slightly exceeded the December highs before reversing — in SMC terms, a sign of a bearish liquidity grab.

          → The price then broke support from several recent sessions around 25,570 after forming a large bearish candle (marked by the arrow). This indicates strong selling pressure (a market imbalance) and the area may now act as resistance.

          It is possible that bulls will attempt to recover some of yesterday's losses today. However, if any rebound stalls near this resistance zone, the Nasdaq 100 (US Tech 100 mini on FXOpen) may continue to drift lower along a rounding downward trajectory.

          Source: FXOpen

          Risk Warnings and Disclaimers
          You understand and acknowledge that there is a high degree of risk involved in trading. Following any strategies or investment methods may lead to potential losses. The content on the site is provided by our contributors and analysts for information purposes only. You are solely responsible for determining whether any trading assets, securities, strategy, or any other product is suitable for investing based on your own investment objectives and financial situation.
          Add to Favorites
          Share

          Trump’s $12 Billion Farm Aid Faces Skepticism as Tariff Fallout Deepens

          Gerik

          Economic

          Federal Aid Returns, But Farmer Confidence Wanes

          President Donald Trump’s renewed effort to support U.S. farmers through $12 billion in direct payments has done little to restore confidence among rural producers grappling with the long-term consequences of the ongoing trade war. While the assistance echoes the administration’s first-term bailouts, many farmers now view the payouts as inadequate and unsustainable.
          Gene Stehly, who farms corn, wheat, and soybeans, openly voiced frustration, noting that federal support cannot offset the substantial losses caused by slumping export markets and rising operational costs. The current situation, he observed, doesn’t resemble the “better outcome” initially promised by the administration. Like many others, he fears the support is too little, too late.
          Charlie Radman, a fourth-generation farmer in Minnesota, called the payments a temporary “bridge,” not a strategy. What farmers are demanding, he emphasized, is predictability

          Trade War Fallout Disrupts Agricultural Exports

          The root of the discontent lies in a deeply altered global trade landscape. Trump’s tariffs reignited tensions with China, once the largest buyer of American soybeans. Following retaliatory measures, China slashed its agricultural imports from the U.S., shifting toward Brazil and other suppliers. As a result, soybean and sorghum growers who typically export over half their harvest faced a dramatic contraction in demand.
          Though Trump and President Xi Jinping announced a deal in October aiming to restore agricultural trade, the actual numbers suggest a shortfall. Only about 25% of the 12 million metric tons of promised soybean purchases have materialized, casting doubt on China’s commitment to the agreement. Without confirmation from Beijing, skepticism is growing among U.S. farmers who remember unfulfilled pledges from previous negotiations.
          For Missouri farmer Bryant Kagay, the issue isn’t just economic it’s a question of trust. He bluntly stated his lack of faith in China’s “motives and integrity.” Even if the full volume of soybeans is eventually purchased, it merely restores exports to pre-Trump levels not growth, but recovery.

          Farmers Demand Market Expansion, Not Bailouts

          Many in the agricultural community are shifting focus away from China entirely. Glen Groth, a farmer in Minnesota, advocated for the development of new markets beyond Asia, while others called for bolstering domestic uses such as biofuels, animal feed, and aviation fuel. Iowa’s Dan Keitzer put it clearly: “We need more demand for our product,” adding that government checks are no substitute for a healthy market.
          This sentiment reflects a broader cause-and-effect pattern: years of technological advances have increased yields, yet market access has not kept pace. Without new buyers, oversupply will continue to depress prices, rendering aid payments a recurring necessity rather than a one-time solution.

          Policy Limits and Structural Challenges

          The structure of the newly announced aid package raises additional concerns. Payments are capped at $155,000 per farmer or entity, and only available to those with adjusted gross income below $900,000. During Trump’s first term, loopholes enabled large agribusinesses to sidestep these limits, drawing criticism from smaller operations.
          Moreover, the current $12 billion allocation is substantially lower than previous efforts: $22 billion in 2019 and $46 billion in 2020, which included COVID-related relief. As farmers prepare for next year’s crop cycle, many are already meeting with lenders, placing orders, and bracing for continued uncertainty. Financial commitments now far exceed what this round of aid can cover, reducing its impact to a mere accounting buffer.

          Trump Targets Ag Industry Monopolies, But With Unclear Outcomes

          Recognizing the growing frustration, Trump issued an executive order directing the DOJ and FTC to investigate anti-competitive practices across the food supply chain from fertilizer and seed suppliers to meatpacking firms and grocers. The goal, the administration claims, is to rein in price distortions that increase input costs while squeezing farmer margins.
          Tregg Cronin, a farmer from South Dakota, welcomed the acknowledgment that producers are “caught in the middle” of the trade and supply chain battles. Still, he acknowledged that any aid he receives will likely be consumed immediately by those same inflated expenses, leaving little for reinvestment or savings.

          Aid Offers Short-Term Relief, Not Long-Term Strategy

          Trump’s farm bailout is a political and economic gesture meant to placate a critical voting bloc. Yet, the gap between compensation and confidence is widening. While direct payments provide temporary support, they cannot replace predictable market access, competitive pricing, and structural reforms.
          Farmers across the Midwest are calling not just for financial relief but for lasting solutions from diversified trade to domestic demand stimulation and tighter control of agribusiness monopolies. Until those materialize, aid checks may keep operations afloat, but they do little to address the deeper challenges threatening the long-term viability of American agriculture.

          Source: AP

          To stay updated on all economic events of today, please check out our Economic calendar
          Risk Warnings and Disclaimers
          You understand and acknowledge that there is a high degree of risk involved in trading. Following any strategies or investment methods may lead to potential losses. The content on the site is provided by our contributors and analysts for information purposes only. You are solely responsible for determining whether any trading assets, securities, strategy, or any other product is suitable for investing based on your own investment objectives and financial situation.
          Add to Favorites
          Share

          Part Of Powell’s Analysis Allows Market To Consider A Less Hawkish Interpretation

          Justin

          Political

          Central Bank

          Markets

          The Fed cut its policy rate for the third consecutive meeting by 25 bps yesterday to 3.5%-3.75%. The Fed still has to balance a weakening labour market against somewhat elevated inflation. There was again no consensus within the FOMC on how to address these opposing factors, as one member (Stephen Miran) voted for a 50 bps cut, but two others (Schmid and Goolsbee) wanted to keep the policy rate unchanged. The dots even showed a total of 6 out of 19 members in favour of the status quo. The median Federal Funds Rate projection for 2026 and 2027 remained unchanged at respectively 3.25%-3.5% and 3%-3.25%. Fed chair Powell indicated that the policy rate now is "within the range of plausible neutral estimates", allowing the Fed to assess incoming data, with a January rate cut seen as rather unlikely.

          However, part of Powell's analysis allowed the market to consider a less hawkish interpretation. PCE inflation forecasts for this (2.9% from 3%) and next (2.4% from 2.6%) faced downward revisions. Powell's working hypothesis is still that most of the current elevated inflation was temporary due to higher goods prices driven by tariffs. Services inflation has been cooling. In addition, the Fed chair pointed at ongoing downside risks to the labour market, especially as current estimates on employment growth probably present an over-estimation. Markets responded to the "dovish" opening created by the labour market remarks.

          The US curve bull steepened, with yields declining between 7.7 bps (2-y) and -2.1 bps (30-y), assuming that the Fed focus remains slightly more tilted to maximum employment part of its dual mandate. An additional announcement to start buying T-bills (and other short-term Treasury securities) from next week on at a $40bn pace to maintain a situation of ample reserves added to the bull steepening move. By nearing neutral interest rate levels, the bar for additional rate cuts in early 2026 has been raised. Nevertheless, in case of weak (labour) market data next week and/or January, the debate on an additional precautionary rate cut might rapidly resurface.

          On other markets, equities rebounded yesterday with the Fed upwardly revising its growth forecasts, especially for next year (2.3% from 1.8% in September) and the Fed chair elaborating on ongoing high productivity gains supported. The combination of losing interest rate support and a risk rebound weighed on the dollar. DXY eased further from the 99.2 area early in the session to close at 98.79. EUR/USD closed just below the 1.17 big figure (1.1695).

          Today's eco calendar is thin, apart from weekly jobless claims. The Swiss national bank is expected to keep its policy rate unchanged at 0%. Even as Powell indicated that the Fed is now in a position to wait, we assume that both US yields and the dollar remain more sensitive to weaker than expected (labour market) data.

          News & Views

          The Bank of Canada as expected kept the policy rate unchanged at 2.5%. Economic growth at a 2.6% annualized clip in Q2 was surprisingly strong, it said, but that was the result of a steep drop in imports. The BoC anticipates a weak Q4 number with the import normalizing hanging in the balance with a grow in domestic demand. Growth is forecast to pick up in 2026, although uncertainty remains high.

          The labour market is a similar "on the one hand, but on the other" narrative. after solid employment gains over the last three months. Inflation, 2.2% in October, should remain close to the 2% target with the BoC willing to look through some choppiness in the coming months. Underlying gauges hover around 2.5%. The central bank concludes that "the current policy rate at about the right level to keep inflation close to 2% while helping the economy through this period of structural adjustment." Canadian swap yields fell up to 5 bps at the front. USD/CAD ended lower below 1.38 but that was mainly a US dollar move.

          Brazil's central bank left the policy rate at 15% and kept their view of an economy cooling while inflation, though still above the 3% target, is improving. They lowered CPI forecasts to hit 3.2% in 2027Q2 (from 3.3%), which is their relevant policy horizon for now. Risks remain symmetrical.

          The 15% level is considered "appropriate" to bring inflation to target, considered a slight dovish change compared to November's "will be enough". The Brazilian real's strengthening over much of 2025 probably helps explain the downwardly adjusted CPI forecasts. But its recent weakening to a two month low of USD/BRL 5.47 warrants ongoing caution, meaning the 15% level may be the reference for the time being..

          Source: KBC Bank

          Risk Warnings and Disclaimers
          You understand and acknowledge that there is a high degree of risk involved in trading. Following any strategies or investment methods may lead to potential losses. The content on the site is provided by our contributors and analysts for information purposes only. You are solely responsible for determining whether any trading assets, securities, strategy, or any other product is suitable for investing based on your own investment objectives and financial situation.
          Add to Favorites
          Share

          How the Fed's Third Rate Cut of 2025 Impacts Your Money: From Savings to Mortgages

          Gerik

          Economic

          Deposit Accounts Face Lower Returns Amid Falling Rates

          For depositors, the Fed’s third interest rate cut of the year will further erode already modest earnings on bank deposits. Traditional checking accounts, which average a meager 0.07% annual interest, may see that rate sink even lower. Savings accounts, averaging 0.40%, are only slightly more rewarding. These low yields are directly correlated with the federal funds rate, and further cuts mean lower returns for savers.
          However, high-yield savings accounts which still hover around 4% provide a more competitive return. These accounts may see slower rate declines, depending on the provider, but will likely trend downward over time, making rate shopping increasingly essential. Money market accounts follow a similar pattern: national averages remain at 0.58%, but high-yield versions still offer returns near 4%, especially for balances above $10,000.
          In this environment, deposit accounts become less attractive for long-term cash storage, reinforcing the need for proactive financial decisions.

          CDs: Slipping Rates Ahead for Time-Deposits

          Certificates of deposit (CDs) had shown slight upward movement recently, but that momentum may now stall or reverse. A 12-month CD currently yields around 1.64%, though better deals exist for those willing to search online or commit to longer terms. CD rates are sensitive to Fed policy and typically lag behind cuts, meaning today’s rate could be the best available for a while.
          As lower rates are priced in, locking into fixed-rate CDs now could benefit risk-averse savers looking to preserve yield before further declines.

          Mortgages: Fed Cut Won’t Trigger a Return to 3% Rates

          Despite popular hopes, mortgage rates are unlikely to revisit pandemic-era lows anytime soon. Although the Fed influences borrowing costs, mortgage rates are more directly tied to the 10-year U.S. Treasury yield, which has remained above 4% in December. As a result, mortgage rates have only modestly declined now about half a percentage point below last year’s levels and are expected to stay near 6% through 2026, according to analysts at Fannie Mae and the Mortgage Bankers Association.
          This reflects a partial causality: while the Fed’s moves shape the interest rate environment, the bond market’s long-term expectations exert more control over mortgage pricing.

          Personal Loans Become Marginally Cheaper

          In contrast to mortgages, personal loan rates have shown a clearer response to the Fed’s cuts. Average personal loan interest rates have dipped to nearly 11%, down from peaks near 12%. Some borrowers now find rates advertised as low as 8%, especially with good credit profiles. Another rate cut could nudge these levels even lower, creating slightly more favorable conditions for debt consolidation or major purchases.
          This market exhibits a stronger correlation with the Fed’s policy decisions, as lenders recalibrate offerings in response to changes in short-term funding costs.

          Credit Card Rates Remain Stubbornly High

          Surprisingly, credit card interest rates have been immune to the Fed’s easing. Average APRs have surged from around 15% in 2021 to more than 21% in 2025, defying expectations of a downward shift. Unlike personal loans, credit card rates are driven more by issuer pricing power and consumer credit profiles than by the prime rate alone.
          Despite the declining federal funds rate, cardholders haven’t seen relief pointing to a weak causal link between Fed policy and revolving credit costs. For those carrying balances, the best recourse remains a direct appeal to the card issuer for a rate reduction, particularly if payment history and credit scores have improved.

          Investments and Markets React to Fed Guidance, Not Just Action

          Equity markets typically react to Fed decisions, but investor sentiment depends more on the central bank’s outlook than on the immediate cut itself. While the Fed reduced rates, Chair Jerome Powell and the FOMC signaled that only one cut is likely in 2026, down from earlier expectations of two.
          Stock market responses tend to align more with projections, bond yields, and corporate earnings than with the Fed’s mechanical rate changes. For investors, this means navigating an environment of cautious optimism. Those favoring stability may turn to high-quality, dividend-paying stocks or fixed-income instruments that benefit from a steady or declining rate backdrop.
          The Federal Reserve’s latest rate cut continues to shape financial markets and consumer behavior in uneven ways. While borrowers may benefit modestly particularly through personal loans and selective investment strategies savers will see diminishing returns on deposits, and credit card users will face persistently high costs. The real lever of financial outcomes lies not only in current Fed actions but in how markets interpret future policy direction. In this climate, informed choices whether switching to higher-yield accounts or negotiating better borrowing terms are more important than ever.

          Source: Yahoo Finance

          To stay updated on all economic events of today, please check out our Economic calendar
          Risk Warnings and Disclaimers
          You understand and acknowledge that there is a high degree of risk involved in trading. Following any strategies or investment methods may lead to potential losses. The content on the site is provided by our contributors and analysts for information purposes only. You are solely responsible for determining whether any trading assets, securities, strategy, or any other product is suitable for investing based on your own investment objectives and financial situation.
          Add to Favorites
          Share

          Market Quick Take - 11 December 2025

          SAXO

          Forex

          Commodity

          Stocks

          Cryptocurrency

          Market drivers and catalysts

          · Equities: Equities face a reality check as Oracle-led AI jitters drag S&P futures lower, offsetting yesterday's Fed-driven relief rally
          · Volatility: Implied volatility stays subdued, with VIX in the mid-teens even as index options show renewed demand for downside hedges.
          · Digital Assets: Bitcoin slips below 90k and options flow stays bearish in single names, while ETF activity turns more balanced into year-end.
          · Currencies: The USD weakened on the back of the FOMC guidance and lower US treasury yields
          · Commodities: Precious metals ease after FOMC-driven spike; crude steadies ahead of IEA/OPEC reports; EU gas sinks to 20-month low on mild weather
          · Fixed Income: US treasuries rallied on the FOMC decision and guidance.
          · Macro events: US weekly jobless claims, trade balance and 30-year bond auction

          Macro headlines

          · The US Federal Reserve cut the Fed Funds rate by 25 bps to 3.5%–3.75% at its meeting on Wednesday, in a 9-3 vote, with two hawkish dissenters (Goolsbee and Schmid, who favoured no cut) and one dovish dissenter (Stephen Miran, who favoured a larger 50 bp cut). Members were split over whether inflation or the job market should be their bigger worry. In the end, the decision was made to protect against a sharper-than-anticipated slowdown in hiring. The Fed kept its rate projections steady, forecasting a 25bps cut in 2026, while revising GDP growth forecasts higher and slightly lowering PCE inflation estimates. Unemployment forecasts stayed at 4.5% for 2025 and 4.4% for 2026.
          · Fed Chair Powell suggested the possibility of additional cuts beyond the single one planned for next year. This led traders to increase the odds of two or more cuts in 2026 to about 68%. The statement indicated a potential pause to evaluate data, making the pace of cuts conditional on incoming data. Policymakers also raised growth expectations and slightly lowered inflation forecasts for 2025 and 2026.
          · The Bank of Canada kept the target rate at 2.25% in December 2025, seeing it as appropriate. GDP grew 2.6% in Q3, unemployment dropped to 6.5%, and CPI inflation slowed to 2.2%. Policymakers noted global uncertainty impacting GDP. They find the current rate suitable for maintaining 2% inflation but are prepared to adjust if needed.
          · The Swiss Government announced that 15% US tariffs on Swiss goods will be applied retroactively starting from November 14th.
          · Australia saw an unexpected loss of 21,300 jobs in November, the largest monthly decline since February while the jobless rate held steady at 4.3%. Signs of a cooling labour market could force the RBA to hold rather than raise interest rates in the new year.

          Equities

          · USA: After yesterday's Fed-driven bounce, S&P 500 futures now point to a drop of almost 1% as investors reassess the cut. The Dow Jones rose 1.1%, the S&P 500 gained 0.7% and the Nasdaq reversed early weakness to close 0.4% higher after the Federal Reserve cut rates by 25 basis points and signalled one more cut next year. The tone of Chair Powell's press conference reassured markets that further hikes are very unlikely, and traders now see decent odds of two or more cuts in 2026. Industrials led the move, while Amazon climbed 1.7% on plans to invest 35 billion dollars in India and JPMorgan added 3.2%. In contrast, Microsoft fell 2.8% after outlining a 17.5 billion dollar India investment, and Oracle slumped more than 11% after hours as softer cloud revenue and heavy AI data-centre spending raised questions about debt-funded expansion. The latter helped change the mood in the market towards a more defensive stance with the S&P 500 trading down 0.9% ahead of the European session.
          · Europe: European equities slipped on Wednesday as investors stayed cautious ahead of the Fed decision, with the STOXX 50 down 0.2% and the STOXX 600 roughly flat. Risk appetite was limited, but there were sharp stock-specific moves. Aegon dropped close to 10% after confirming plans to shift its headquarters to the United States and rebrand as Transamerica, while Vinci and Rheinmetall also weighed on indices. On the positive side, Siemens Energy gained over 4% after upbeat guidance from US peer GE Vernova highlighted power grid demand, and Ocado jumped in double digits. Strength in HSBC, Novo Nordisk and Roche helped cushion the broader market as investors now look to upcoming European Central Bank and Bank of England meetings.
          · Asia: Asian markets were mixed, as investors reacted to the Fed backdrop and another weak inflation print from China. The Hang Seng fell about 0.5%, marking a third straight decline and a two-week low, pressured by earlier Wall Street nerves and ongoing worries about Chinese growth. Softer producer and consumer prices highlighted weak demand, although fresh fiscal support signals from the Politburo limited the downside. Mainland Chinese indices were under strain from property and industrial names, while selected financials and technology stocks offered some support in Hong Kong. Across the region, attention now shifts to how local central banks respond to the Fed's move and whether incoming Chinese data can stabilise sentiment.

          Volatility

          · SPX closed at 6,886.68 on Wednesday, up 0.67%, with futures modestly softer this morning. Short-dated options now price an intraday move of roughly ±36 points (±0.52%) based on the 0DTE strangle around the 6,890 strike, keeping the expected range tight. The VIX fell to about 15.8, with very short-term measures (VIX1D, VIX9D) dropping even more, signalling fading event anxiety after the Fed but still-elevated interest in hedging around data.
          · Index options flow stayed defensive. New SPX positions skewed to out-of-the-money puts that only pay off in a deeper pullback, while VIX options saw notable call buying into 2026, a classic bet on future volatility spikes rather than immediate stress. Mini-SPX (XSP) flows showed similar downside positioning in smaller size. Today's SNB rate decision, US jobless claims and a 30-year Treasury auction, plus earnings from Broadcom, Costco and Lululemon, are the next catalysts traders will watch for any break from this low-volatility, "hedged but calm" regime.

          Digital Assets

          · Bitcoin trades just above 90,000 USD, down 2–3% after briefly slipping below that level overnight, signalling ongoing decoupling from equities even after the Fed's rate cut. Ether holds near 3,200 USD, with broader majors also softer. Spot ETF activity remains mixed: ETHA continues to attract steady inflows, while IBIT trades heavy volume but without clear directional flow, especially after Standard Chartered cut its 2025 BTC target to 100k.
          · Options positioning stays defensive. Roughly USD 279m in fresh premium went into downside puts across crypto equities, led by deep ITM structures in MSTR and notable protection in COIN, CLSK and CIFR. By contrast, ETF options in IBIT and ETHA remain more balanced between hedges and selective upside, suggesting investors favour single names for aggressive bearish expression while keeping ETFs flexible into year-end.

          Fixed Income

          · US treasuries rallied on the FOMC decision, which was marginally more dovish than expected as the Fed cut despite improving growth forecasts and revising inflation forecasts lower for next year. The 2-year benchmark treasury yield trades at 3.53%, nine basis points lower this morning from yesterday's high, while the benchmark 10-year yield likewise fell back, trading 4.20%, eight basis points lower from yesterday's high.
          · Japanese government bonds rallied, taking the lead from the US treasury market reaction to the FOMC meeting. The 10-year JGB benchmark yield dropped back to 1.925%, down almost five basis points from the Wednesday highs.
          · German 10-year Bunds rallied after the yield posted a new multi-month high yesterday just shy of 2.90%, closing the day near 2.85%.

          Commodities

          · Precious metals received a lift from the expected FOMC rate cut, which helped soften the dollar and Treasury yields. Silver briefly touched a new record near USD 63 before, like the broader metals complex, running into profit taking as risk sentiment weakened across equities. Gold meanwhile remains confined to a roughly USD 90 band around USD 4,200, a range that has held for two weeks as investors take stock after an exceptional year of gains. A rising trendline from August near USD 4,180 continues to offer support, though a break below may introduce short-term downside risk.
          · Crude trades near the lower end of its established range despite the US seizure of a sanctioned tanker off Venezuela, a move that could curb Venezuelan flows. Ahead of key monthly updates from the IEA and OPEC today, Trafigura—one of the world's largest commodity traders—this week said it expects a wave of new supply to hit the market just as global demand shows signs of softening.
          · European gas prices dropped to a 20-month low of EUR 26.6/MWh (USD 9.13/MMBtu) —a year-over-year decline of 42%—as persistent mild weather continues to suppress heating demand and traders watch for any progress toward a Russia-Ukraine peace deal. The latest long-range seasonal forecasts point to above-normal temperatures through the start of next year.

          Currencies

          · The dollar sold off on the relatively dovish read from the FOMC meeting as US treasury yields dropped sharply all along the curve. EURUSD managed to clear 1.1700 briefly on Thursday for the first time since mid-October before easing back, while USDJPY sold off as far as 155.49 before finding support, trading near 156.00 in late Tokyo hours Thursday.
          · The Australian dollar suddenly lost its footing on surprisingly employment data overnight, with weak full time payrolls and the unemployment rate only managing a steady reading at 4.3% du to a drop in the participation rate. After AUDUSD pulled higher on the post-FOMC USD weakness, hitting a high of 0.6679, it dropped back to 0.6635.

          Source: SAXO

          Risk Warnings and Disclaimers
          You understand and acknowledge that there is a high degree of risk involved in trading. Following any strategies or investment methods may lead to potential losses. The content on the site is provided by our contributors and analysts for information purposes only. You are solely responsible for determining whether any trading assets, securities, strategy, or any other product is suitable for investing based on your own investment objectives and financial situation.
          Add to Favorites
          Share

          A Not-So-Hawkish Fed Cut – We Maintain Our Call

          Danske Bank

          Stocks

          Forex

          Economic

          Central Bank

          In focus today

          In Norway, the Regional Survey is due for release. We expect it to confirm that growth continues to rise at a moderate pace, with capacity utilization largely unchanged and indicate that the level of activity is somewhat below normal. Specifically, we expect that respondents in the survey will expect 0.3-0.4% growth next quarter, that capacity utilization will be unchanged at 35% and that the number of companies experiencing labour shortages will fall from 25% to 24%.

          In Sweden, the final figures for November inflation are being published. The preliminary figures surprised to the downside, with CPI at 0.3% y/y, CPIF 2.3% y/y, and CPIF ex. energy 2.4% y/y. As preliminary estimates are generally reliable, significant revisions are unlikely. It will be interesting to analyse the details to understand the factors behind the surprise. Specifically, whether the low outcome is linked to seasonal variations or other underlying causes.

          In central bank space, attention turns to the Swiss National Bank, where we forecast the rate to remain unchanged at 0.00%. The Central Bank of Turkey is also set to release its rate decision.

          Economic and market news

          What happened yesterday

          In the US, the Federal Reserve cut its policy rate target by 25bp to 3.50-3.75% last night, as widely anticipated. Miran voted for a larger 50bp cut, while Schmid and Goolsbee dissented in favour of a hold, also in line with our expectations. We (and the markets) had expected Powell to push back against market pricing further rate cuts for 2026. However, his avoidance of strong forward guidance led to a decline in UST yields and broad USD weakening during the press conference. We maintain our Fed call and expect two final rate cuts in March and June. The Fed also announced reserve management purchases of T-bills starting 12 December at USD 40bn per month, indicating more front-loaded easing to liquidity policies than we anticipated.

          Ahead of the meeting, the US Q3 Employment Cost Index signalled slightly slower-than-expected wage growth at 0.8% q/q (prior: 1.0%). This pace is close to ideal for the Fed – supporting consumption without driving inflation – and is positive for overall risk sentiment.

          In Sweden, October economic activity data showed a slight decline, with lower production in the business sector as well as declining household consumption. The GDP indicator fell by 0.3% m/m, though its volatility warrants cautious interpretation. Overall, the data aligned with our expectations of slower growth for Q4, reflecting lagged effects of the summer slowdown, and does not alter the positive outlook heading into 2026.

          In Norway, November core inflation declined to 3.0% y/y (cons: 3.1%, prior: 3.0%), driven by domestic and imported goods ex. food. Annual growth in household appliances and electronics dropped close to September levels, indicating that volatility was likely influenced by Black week adjustments. The print is marginally lower than Norges Bank's estimate from the September MPR at 3.1%, reinforcing the disinflationary trend. While this is unlikely to affect Norges Bank's rate path next week, it provides scope for signalling a more aggressive cutting cycle, dependent on the Regional Network survey today.

          In Canada, the Bank of Canada kept the rate unchanged at 2.25% as widely expected.

          In Denmark, November inflation held steady at 2.1% y/y. Food prices declined 0.9% from October, which could potentially have a positive impact on consumer sentiment.

          Equities: Equity investors cheered the not-so-hawkish Fed cut yesterday. S&P 500 jumped 1% at the press conference, eventually closing 0.7% higher and small cap Russell 2000 1.3% higher. The rate decision triggered a clear cyclical preference in markets: Value cyclicals like materials, industrials, and consumer discretionary were all ~2% higher. This is interesting. Previously this year we have seen cyclical growth stocks – mag 7, basically – rallying at dovish surprises. This time, it was more of a "run it hot" reaction in markets, where expectations of stronger macro fuelled the move higher rather than lower yields. This fits our narrative very well.

          One sector worth highlighting is health care, performing very strong in the risk-on session yesterday. This is a bit odd in a historical context, but health care has been behaving like a cyclical sector in recent trading. This has certainly been a tremendous rally, but we take profits today and neutralize our health care sector call. Reason for this is that the positive health care call has been a valuation call, and this argument has rapidly changed. The relative discount has gone from 20% to 10% vs global markets the last three months, which we think is a fair discount at this part of the cycle. For instance, health care now trades close to the multiple of consumer staples, after a 20% discount at the bottom.

          FI and FX: Yesterday's Fed rate cut was a rather balanced one, but given that markets expected a hawkish cut, market reactions were slightly to the soft side. Rates rallied somewhat and the USD weakened a tad with EUR/USD trading at 1.169. Only tiny and transitory, negative reactions in EUR/SEK and EUR/NOK following the FOMC decision. Ahead of the Fed rate decision European rates rose once again, resulting in the fifth consecutive day of higher rates. Potential rate cuts for the ECB have by now been eliminated for 2026. This morning, EUR/SEK is back at 10.84 and EUR/NOK trades at 11.83.

          Source: Danske Bank

          To stay updated on all economic events of today, please check out our Economic calendar
          Risk Warnings and Disclaimers
          You understand and acknowledge that there is a high degree of risk involved in trading. Following any strategies or investment methods may lead to potential losses. The content on the site is provided by our contributors and analysts for information purposes only. You are solely responsible for determining whether any trading assets, securities, strategy, or any other product is suitable for investing based on your own investment objectives and financial situation.
          Add to Favorites
          Share

          China’s Export Engine Powers Through Trump Tariffs, But Cracks Show at Home

          Gerik

          Economic

          China’s Export Strategy Defies U.S. Tariffs

          Following President Trump’s re-election and his campaign promise to impose harsh tariffs on Chinese imports, many expected a sharp decline in China's trade performance. Yet, the result was strikingly the opposite. By the end of November 2025, China had recorded a historic $1 trillion trade surplus a first for any country signaling its ability to pivot rapidly under pressure.
          Rather than confront tariffs directly, Chinese exporters intensified a strategy honed during Trump's first term: reducing dependence on the U.S. and expanding into alternative markets. Customs data show that while exports to the U.S. plunged 18.3% year-on-year, shipments to Europe rose 8.9%, to Southeast Asia by 14.6%, and to Africa by a remarkable 27.2%. The overall export growth of 5.7% for the first 11 months of the year underscores the success of this diversification effort.
          This redirection reveals a clear causal pattern: Trump’s tariffs accelerated China's strategic disengagement from U.S. markets and strengthened its ties with regions more receptive to low-cost goods. At the same time, it challenged assumptions that China’s economy was overly dependent on U.S. consumers.

          Record Surplus Masks Underlying Domestic Fragility

          Beneath the surface of trade success lies a more complex reality. China’s overreliance on exports stems from structural domestic weaknesses. Consumer spending remains subdued amid deflationary pressures, ongoing property market distress, and high youth unemployment.
          Imports a key measure of domestic demand rose just 0.2% year-over-year, reflecting sluggish consumption. Despite Beijing’s public stance that it will meet its 5% growth target, confidence in the broader economy remains low. Much of China’s production strength is now directed abroad because weak internal demand leaves limited room for domestic absorption.
          This dynamic demonstrates a correlated but troubling trend: export strength is increasingly a symptom of weak domestic fundamentals, not a sign of economic balance. The sharp overcapacity in sectors like electric vehicles and e-commerce has sparked brutal price wars, triggering deflationary spirals that the government has struggled to control.

          Manufacturing Dominance Drives Export Pivot

          China’s resilience in trade stems from decades of industrial investment. Under the “Made in China 2025” strategy, billions have been poured into high-tech sectors and traditional manufacturing. Over the past five years, exports have surged by nearly 45%, aided by pandemic-driven demand and the depth of China’s supply chains.
          This advantage has left global rivals behind, especially developing economies that have become increasingly reliant on Chinese components and finished goods. As noted by Wang Jun of the General Administration of Customs, China’s export engine thrives on both advanced capabilities and market perseverance.
          However, such advantages have come with side effects. Years of investment have created capacity far exceeding domestic needs, pushing firms to seek external demand as a survival strategy. The competitiveness of China’s manufacturing base, while unmatched in volume and price, also contributes to global friction.
          Global Backlash and Transshipment Risks
          China’s trade pivot, while effective, is not without consequences. Economists suspect a portion of export growth may be due to transshipments goods processed or rerouted through third countries before reaching their final U.S. destination. This practice, difficult to measure precisely, complicates tariff enforcement and has prompted the U.S. to impose levies on re-exported goods from intermediary nations like Vietnam.
          As China floods new markets with competitively priced goods, accusations of dumping have intensified. The European Union has already imposed tariffs on Chinese electric vehicles and other industrial exports. French President Emmanuel Macron recently described the imbalance in trade with China as “unbearable,” signaling rising protectionist sentiment.
          This global response reveals a feedback loop: China’s push to maintain export momentum increasingly fuels trade friction, which may, in turn, limit its access to critical growth markets in the near future.

          Policy Outlook Remains Cautious Ahead of CEWC

          With the Central Economic Work Conference (CEWC) approaching, all eyes are on Beijing’s next policy moves. President Xi Jinping’s latest remarks reaffirmed a focus on manufacturing strength, technological self-reliance, and economic security. However, economists note a lack of urgency in addressing immediate growth pressures such as consumption shortfalls and real estate malaise.
          Goldman Sachs economist Lisheng Wang described the policy outlook as “somewhat disappointing,” noting the absence of broad stimulus plans or direct support for household consumption. The lack of emphasis on domestic rebalancing suggests that export reliance will continue to be China’s primary growth lever into 2026.

          Export Growth Offers Breathing Room, Not a Cure

          China’s ability to pivot its exports amid heightened U.S. trade pressure demonstrates remarkable industrial resilience and geopolitical adaptability. Yet this strength masks internal economic frailties that remain unresolved. The causal link between weak domestic conditions and aggressive export strategies is increasingly evident, creating a dual challenge: sustaining external trade while addressing internal stagnation.
          If trade tensions escalate further or global demand weakens, China’s export gains may face headwinds. Without a shift toward stronger domestic consumption and structural reform, the current trade surplus may offer only temporary relief rather than long-term stability.

          Source: Reuters

          To stay updated on all economic events of today, please check out our Economic calendar
          Risk Warnings and Disclaimers
          You understand and acknowledge that there is a high degree of risk involved in trading. Following any strategies or investment methods may lead to potential losses. The content on the site is provided by our contributors and analysts for information purposes only. You are solely responsible for determining whether any trading assets, securities, strategy, or any other product is suitable for investing based on your own investment objectives and financial situation.
          Add to Favorites
          Share
          FastBull
          Copyright © 2025 FastBull Ltd

          728 RM B 7/F GEE LOK IND BLDG NO 34 HUNG TO RD KWUN TONG KLN HONG KONG

          TelegramInstagramTwitterfacebooklinkedin
          App Store Google Play Google Play
          Products
          Charts

          Chats

          Q&A with Experts
          Screeners
          Economic Calendar
          Data
          Tools
          Membership
          Features
          Function
          Markets
          Copy Trading
          Latest Signals
          Contests
          News
          Analysis
          24/7
          Columns
          Education
          Company
          Careers
          About Us
          Contact Us
          Advertising
          Help Center
          Feedback
          User Agreement
          Privacy Policy
          Business

          White Label

          Data API

          Web Plug-ins

          Poster Maker

          Affiliate Program

          Risk Disclosure

          The risk of loss in trading financial instruments such as stocks, FX, commodities, futures, bonds, ETFs and crypto can be substantial. You may sustain a total loss of the funds that you deposit with your broker. Therefore, you should carefully consider whether such trading is suitable for you in light of your circumstances and financial resources.

          No decision to invest should be made without thoroughly conducting due diligence by yourself or consulting with your financial advisors. Our web content might not suit you since we don't know your financial conditions and investment needs. Our financial information might have latency or contain inaccuracy, so you should be fully responsible for any of your trading and investment decisions. The company will not be responsible for your capital loss.

          Without getting permission from the website, you are not allowed to copy the website's graphics, texts, or trademarks. Intellectual property rights in the content or data incorporated into this website belong to its providers and exchange merchants.

          Not Logged In

          Log in to access more features

          FastBull Membership

          Not yet

          Purchase

          Become a signal provider
          Help Center
          Customer Service
          Dark Mode
          Price Up/Down Colors

          Log In

          Sign Up

          Position
          Layout
          Fullscreen
          Default to Chart
          The chart page opens by default when you visit fastbull.com