

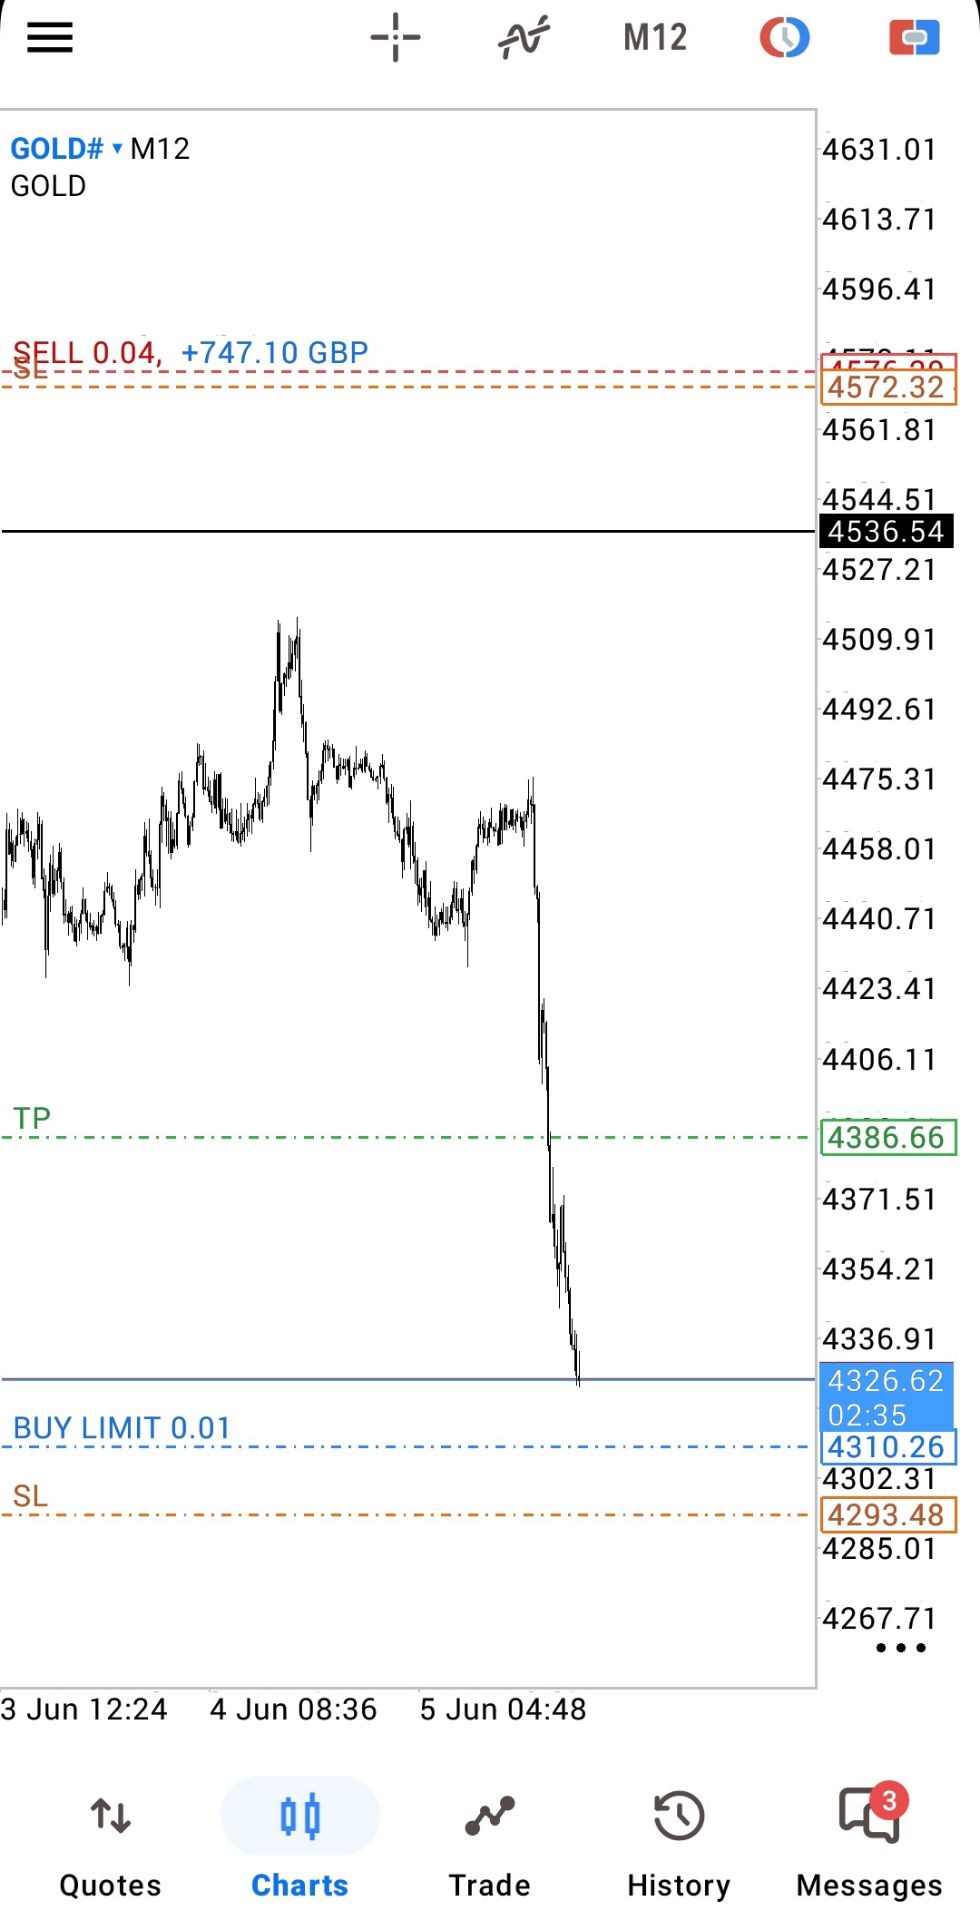
- XAUUSD
- XAGUSD
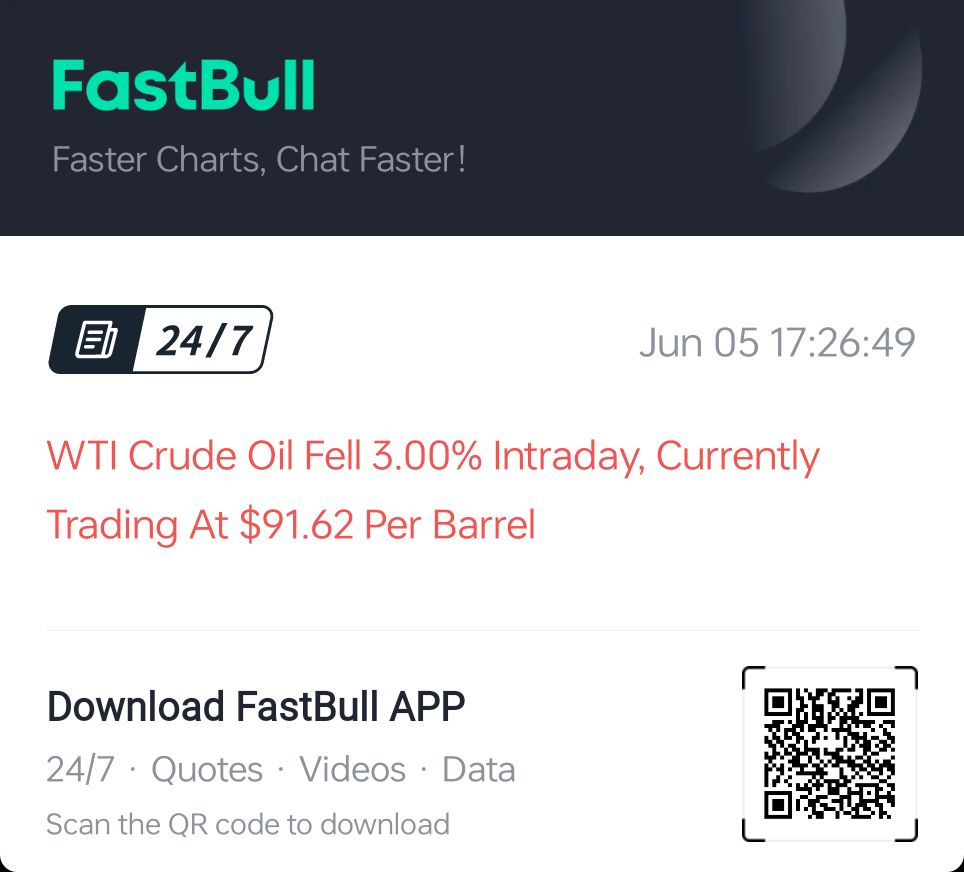
- WTI
- USDX


 8.6
8.6


 6.5
6.5


Return 109.45% --
Members Free


The U.S. State Department Has Approved The Sale Of MH-60R Multi-mission Helicopters And Related Equipment To New Zealand, With The Deal Estimated At $1.5 Billion
U.S. Department Of State: Approved The Sale Of MK 54 Torpedoes To New Zealand, With An Estimated Transaction Value Of USD 69 Million
The Yield On The 2-year U.S. Treasury Note Continued Its Upward Trend, Rising 13 Basis Points To 4.17%
According To The Wall Street Journal: US President Trump Said, "I Have Asked Intelligence Director Pulte To Fire Employees Of The Department And The Office Of The Director Of National Intelligence Should Be 'significantly Downsized' Or Even Abolished."
Putin: The Precondition For A Meeting With Zelenskyy Is That A Solution To The Conflict Must Be Found
Reserve Bank Of India: The Government Of India Has Reappointed Swaminathan Janakiraman As Deputy Governor Of The Reserve Bank Of India For A Term Of Two Years, Effective June 26
According To CNN, A Potential Agreement Between The United States And Iran Depends On Whether The United States Agrees To Release $24 Billion In Frozen Iranian Assets
[Serenity: US Stock Market Deep Pullback Attributed To Rising Rate Hike Expectations] June 6th, "Stock God" Serenity Posted A Comment On Today's U.S. Stock Market Plunge, Attributing It To The Increased Probability Of Fed Interest Rate Hike. Serenity Advised Investors To Ignore Rate Decision Trading, Stick To Company-specific Forecasts (such As AAOI), And Reiterated A Bullish View On Long-term AI Development
Russian President Putin: The Decline In Oil Supply Is Disrupting The Market, And We Will Balance The Market Within OPEC+
More>>
India Reverse Repo RateA:--
F: --
P: --
 Japan Leading Indicators Prelim (Apr)
A:--
F: --
P: --
 U.K. Halifax House Price Index YoY (SA) (May)
A:--
F: --
P: --
U.K. Halifax House Price Index MoM (SA) (May)A:--
F: --
P: --
 France Industrial Output MoM (SA) (Apr)
A:--
F: --
France Trade Balance (SA) (Apr)A:--
F: --
P: --
 Turkey PPI YoY (May)
A:--
F: --
P: --
Turkey CPI YoY (May)A:--
F: --
P: --
 Euro Zone Employment YoY (SA) (Q1)
A:--
F: --
P: --
 Italy Retail Sales MoM (SA) (Apr)
A:--
F: --
P: --
India Quarterly GDP YoY (Q4)A:--
F: --
P: --
India GDP YoYA:--
F: --
P: --
 Mexico Consumer Confidence Index (May)
A:--
F: --
P: --
 Canada Employment (SA) (May)
A:--
F: --
P: --
Canada Full-time Employment (SA) (May)A:--
F: --
P: --
Canada Part-Time Employment (SA) (May)A:--
F: --
P: --
Canada Unemployment Rate (SA) (May)A:--
F: --
P: --
 U.S. Government Employment (May)
A:--
F: --
P: --
Canada Labor Force Participation Rate (SA) (May)A:--
F: --
P: --
U.S. Unemployment Rate (SA) (May)A:--
F: --
P: --
U.S. Nonfarm Payrolls (SA) (May)A:--
F: --
U.S. Average Hourly Wage YoY (May)A:--
F: --
P: --
U.S. Average Hourly Wage MoM (SA) (May)A:--
F: --
P: --
U.S. U6 Unemployment Rate (SA) (May)A:--
F: --
P: --
U.S. Manufacturing Employment (SA) (May)A:--
F: --
U.S. Labor Force Participation Rate (SA) (May)A:--
F: --
P: --
U.S. Average Weekly Working Hours (SA) (May)A:--
F: --
P: --
U.S. Private Nonfarm Payrolls (SA) (May)A:--
F: --
Canada Ivey PMI (SA) (May)A:--
F: --
P: --
Canada Ivey PMI (Not SA) (May)A:--
F: --
P: --
U.S. Weekly Total Oil Rig Count--
F: --
P: --
U.S. Weekly Total Rig Count--
F: --
P: --
BOE Gov Bailey Speaks U.S. Consumer Credit (SA) (Apr)--
F: --
P: --
 China, Mainland Foreign Exchange Reserves (May)
--
F: --
P: --
Richmond Federal Reserve President Barkin delivered a speech. Japan Trade Balance (Apr)--
F: --
P: --
Japan Nominal GDP Revised QoQ (Q1)--
F: --
P: --
Euro Zone Sentix Investor Confidence Index (Jun)--
F: --
P: --
Canada National Economic Confidence Index--
F: --
P: --
U.S. Conference Board Employment Trends Index (SA) (May)--
F: --
P: --
China, Mainland Imports (CNH) (May)--
F: --
P: --
China, Mainland Exports (May)--
F: --
P: --
China, Mainland Exports YoY (USD) (May)--
F: --
P: --
China, Mainland Imports YoY (CNH) (May)--
F: --
P: --
China, Mainland Imports YoY (USD) (May)--
F: --
P: --
China, Mainland Trade Balance (CNH) (May)--
F: --
P: --
U.K. BRC Overall Retail Sales YoY (May)--
F: --
P: --
U.K. BRC Like-For-Like Retail Sales YoY (May)--
F: --
P: --
China, Mainland Trade Balance (USD) (May)--
F: --
P: --
 Germany Industrial Output MoM (SA) (Apr)
--
F: --
P: --
Germany Exports MoM (SA) (Apr)--
F: --
P: --
 South Africa GDP YoY (Q1)
--
F: --
P: --
U.S. NFIB Small Business Optimism Index (SA) (May)--
F: --
P: --
Mexico CPI YoY (May)--
F: --
P: --
U.S. Trade Balance (Apr)--
F: --
P: --
Canada Trade Balance (SA) (Apr)--
F: --
P: --
Canada Imports (SA) (Apr)--
F: --
P: --
Canada Exports (SA) (Apr)--
F: --
P: --
U.S. Exports (Apr)--
F: --
P: --
U.S. Weekly Redbook Index YoY--
F: --
P: --
More>>


 RayKozak manjunath mohil Lebohang RZ4MXNV1EJ reivilo Marzena PRMZ9KZ046 Damian vahid
More>>

 #2
#2 


 #2
#2 

 #1
#1  #10
#10 
 #4
#4  #1
#1  Monitoring
Buy Stop
Buy Limit
Sell Limit
Sell Stop
Profit
Loss

No data

728 RM B 7/F GEE LOK IND BLDG NO 34 HUNG TO RD KWUN TONG KLN HONG KONG


The risk of loss in trading financial instruments such as stocks, FX, commodities, futures, bonds, ETFs and crypto can be substantial. You may sustain a total loss of the funds that you deposit with your broker. Therefore, you should carefully consider whether such trading is suitable for you in light of your circumstances and financial resources.
No decision to invest should be made without thoroughly conducting due diligence by yourself or consulting with your financial advisors. Our web content might not suit you since we don't know your financial conditions and investment needs. Our financial information might have latency or contain inaccuracy, so you should be fully responsible for any of your trading and investment decisions. The company will not be responsible for your capital loss.
Without getting permission from the website, you are not allowed to copy the website's graphics, texts, or trademarks. Intellectual property rights in the content or data incorporated into this website belong to its providers and exchange merchants.
Not Logged In
Log in to access more features


Log In
Sign Up