Markets
News
Analysis
User
24/7
Economic Calendar
Education
Data
- Names
- Latest
- Prev


Signal Accounts for Members
All Signal Accounts
All Contests


U.S. S&P/CS 10-City Home Price Index YoY (Oct)A:--
F: --
P: --
U.S. S&P/CS 10-City Home Price Index MoM (Not SA) (Oct)A:--
F: --
P: --
U.S. S&P/CS 20-City Home Price Index (Not SA) (Oct)A:--
F: --
P: --
U.S. S&P/CS 20-City Home Price Index MoM (Not SA) (Oct)A:--
F: --
P: --
U.S. FHFA House Price Index YoY (Oct)A:--
F: --
U.S. Chicago PMI (Dec)A:--
F: --
P: --
Brazil CAGED Net Payroll Jobs (Nov)A:--
F: --
P: --
U.S. Weekly Total Oil Rig CountA:--
F: --
P: --
U.S. Weekly Total Rig CountA:--
F: --
P: --
FOMC Meeting Minutes
U.S. API Weekly Refined Oil StocksA:--
F: --
P: --
U.S. API Weekly Crude Oil StocksA:--
F: --
P: --
U.S. API Weekly Cushing Crude Oil StocksA:--
F: --
P: --
U.S. API Weekly Gasoline StocksA:--
F: --
P: --
South Korea CPI YoY (Dec)A:--
F: --
P: --
China, Mainland NBS Manufacturing PMI (Dec)A:--
F: --
P: --
China, Mainland Composite PMI (Dec)A:--
F: --
P: --
China, Mainland NBS Non-manufacturing PMI (Dec)A:--
F: --
P: --
China, Mainland Caixin Manufacturing PMI (SA) (Dec)A:--
F: --
P: --
Turkey Trade Balance (Nov)A:--
F: --
P: --
South Africa Trade Balance (Nov)A:--
F: --
P: --
U.S. Initial Jobless Claims 4-Week Avg. (SA)A:--
F: --
U.S. Weekly Continued Jobless Claims (SA)A:--
F: --
U.S. Weekly Initial Jobless Claims (SA)A:--
F: --
U.S. EIA Weekly Cushing, Oklahoma Crude Oil Stocks ChangeA:--
F: --
P: --
U.S. EIA Weekly Crude Demand Projected by ProductionA:--
F: --
P: --
U.S. EIA Weekly Gasoline Stocks ChangeA:--
F: --
P: --
U.S. EIA Weekly Crude Stocks ChangeA:--
F: --
P: --
U.S. EIA Weekly Heating Oil Stock ChangesA:--
F: --
P: --
U.S. EIA Weekly Crude Oil Imports ChangesA:--
F: --
P: --
U.S. EIA Weekly Natural Gas Stocks ChangeA:--
F: --
P: --
South Korea Trade Balance Prelim (Dec)--
F: --
P: --
South Korea IHS Markit Manufacturing PMI (SA) (Dec)--
F: --
P: --
Indonesia IHS Markit Manufacturing PMI (Dec)--
F: --
P: --
India HSBC Manufacturing PMI Final (Dec)--
F: --
P: --
Russia IHS Markit Manufacturing PMI (Dec)--
F: --
P: --
U.K. Nationwide House Price Index MoM (Dec)--
F: --
P: --
U.K. Nationwide House Price Index YoY (Dec)--
F: --
P: --
Turkey Manufacturing PMI (Dec)--
F: --
P: --
Italy Manufacturing PMI (SA) (Dec)--
F: --
P: --
Euro Zone Manufacturing PMI Final (Dec)--
F: --
P: --
Euro Zone M3 Money Supply (SA) (Nov)--
F: --
P: --
Euro Zone 3-Month M3 Money Supply YoY (Nov)--
F: --
P: --
Euro Zone Private Sector Credit YoY (Nov)--
F: --
P: --
Euro Zone M3 Money Supply YoY (Nov)--
F: --
P: --
U.K. Manufacturing PMI Final (Dec)--
F: --
P: --
India Deposit Gowth YoY--
F: --
P: --
Brazil IHS Markit Manufacturing PMI (Dec)--
F: --
P: --
U.S. MBA Mortgage Application Activity Index WoW--
F: --
P: --
Canada Manufacturing PMI (SA) (Dec)--
F: --
P: --
U.S. IHS Markit Manufacturing PMI Final (Dec)--
F: --
P: --
Mexico Manufacturing PMI (Dec)--
F: --
P: --
U.S. Weekly Treasuries Held by Foreign Central Banks--
F: --
P: --
Philadelphia Fed President Henry Paulson delivers a speech
Japan Manufacturing PMI Final (Dec)--
F: --
P: --
China, Mainland Caixin Composite PMI (Dec)--
F: --
P: --
China, Mainland Caixin Services PMI (Dec)--
F: --
P: --
Indonesia Trade Balance (Nov)--
F: --
P: --
Indonesia Core Inflation YoY (Dec)--
F: --
P: --
Indonesia Inflation Rate YoY (Dec)--
F: --
P: --
Saudi Arabia IHS Markit Composite PMI (Dec)--
F: --
P: --


Freddy94_
ID: 1815108


No matching data
Latest Views
Latest Views
Trending Topics
Top Columnists
Latest Update
White Label
Data API
Web Plug-ins
Affiliate Program
View All

No data
Despite incremental dovish shifts in the makeup of the FOMC voters, early 2026 is still likely to bring a pause to the Fed's easing cycle.
"New Year, New You" the saying goes, but for traders, the more salient phrase may be more along the lines of "New Fed, New Markets."
The FOMC will enter 2026 with a fresh slate of regional bank presidents and a leadership transition on the horizon, developments that could shift the markets current expectations for interest rate cuts at the world's most important central bank.
As the chart below shows, traders are currently pricing in a wide range between one and four 25bps interest rate cuts by the Fed in 2026, presenting clear trading opportunities for traders who are able to successfully handicap the outcome:
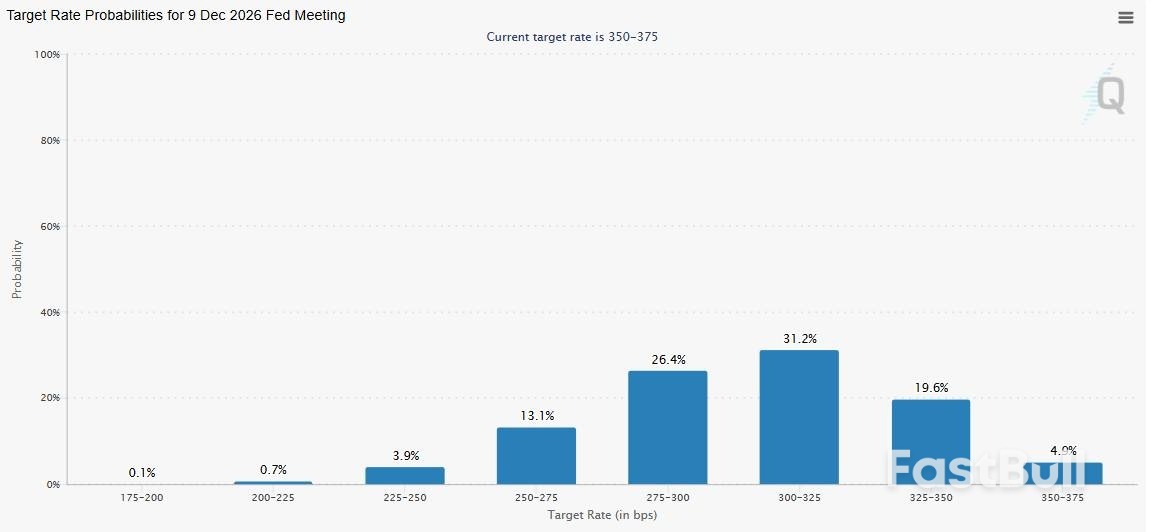
When it comes to the usual rotating voters, four Reserve Bank presidents will rotate off the FOMC in the new year: Susan Collins (Boston), Austan Goolsbee (Chicago), Alberto Musalem (St. Louis), and Jeff Schmid (Kansas City).
Their replacements are Anna Paulson (Philadelphia), Beth Hammack (Cleveland), Lorie Logan (Dallas), and Neel Kashkari (Minneapolis).
On balance, the outgoing voters lean hawkish (less inclined to cut interest rates overall. Recent quotes from the outgoing presidents follow:
Meanwhile, the new voters are more balanced, with two leaning hawkish and two more dovish:
Overall, the regular voter rotation could shift the Fed to a slightly more dovish or centrist outlook heading into the new year, though the move is likely to be marginal and economic data will still take precedence over broad ideological leans.
As you've no doubt heard, the bigger shift could be at the top: Chairman Powell's second four-year term ends in May, leaving an opening at the top for President Trump to nominate a(n almost certainly more dovish) successor early next year.
Names floated include Kevin Hassett, Kevin Warsh, and Chris Waller. Hassett and Warsh are widely viewed as favoring a more aggressive easing stance, citing growth risks and political priorities. Waller, meanwhile, has leaned hawkish historically but could pivot under a Trump mandate for faster cuts.
Beyond the appointment of a new Chairman in January, readers should also be aware that Trump-appointed Governor Stephen Miran exits January 31, 2026. In his so-far short tenure at the Fed, Miran has repeatedly dissented in favor of large 50bps rate cuts, making him the most dovish voice on the Board. In all likelihood, his replacement will reinforce a pro-easing tilt. Combined with a new Chair, this could shift the seven-member Board toward a majority favoring quicker normalization, even if regional presidents urge caution.
Despite these dovish shifts, early 2026 is still likely to bring a pause to the central bank's easing cycle, with the potential for interest rate cuts to accelerate through the middle of the year on the back of a new, more dovish Chairman, especially if employment data continues to deteriorate.


That old line — you either own paper or you own hard assets — made sense in a world where inflation cycles were shorter, balance sheets were smaller, and capital still respected gravity. I heard it constantly when I started in this business back in 1982. You picked a side. Paper meant you thought growth was coming. Hard assets meant you thought trouble was coming.
What's changed is not the rule, but the environment it operates in.
As we head into the final stretch of 2025, both stocks and precious metals are trading near record highs. The S&P sits around 6,900. Gold is testing $4,600. Silver touched $84. But if you look at where the real conviction is right now — not the hope, the actual targets — the metal guys are a lot more certain than the equity guys.
Richmond Lee, CFA and Senior Market Analyst at PU Prime commented:
As markets move toward the final stretch of 2025, a striking divergence is emerging between financial assets and hard assets. Both U.S. equities and precious metals are trading near record highs, yet the degree of conviction behind future expectations differs materially. While equity forecasts remain conditional and tightly range-bound, projections for gold and silver continue to move higher with growing confidence.
In precious metals, the narrative has become increasingly structural. Major institutions such as JPMorgan and Bank of America have lifted gold targets toward the 5,000 to 6,000 dollar range over the next two years, citing sustained central bank diversification, currency debasement, and long-term demand resilience. These forecasts are not framed as short-term trades, but as part of a longer regime shift in global reserve management. Gold now represents a larger share of central bank reserves than U.S. Treasuries for the first time in decades, reinforcing the idea of a structural reallocation rather than a cyclical move.
Silver's case appears even more asymmetric. Prices have already exceeded many bank forecasts, forcing analysts to revise models upward as the market enters price discovery. Persistent supply deficits, combined with rising industrial demand from solar, electric vehicles, and data centers, leave little room for complacency. Unlike gold, silver's dual role as a monetary and industrial metal amplifies upside during periods of strong demand.
Equities, by contrast, face a narrower margin for error. Wall Street targets for the S&P 500 cluster between 7,100 and 8,000, implying mid to low double-digit upside that depends on strong earnings growth, stable inflation, and supportive monetary policy. Valuations remain elevated, meaning disappointment rather than crisis could be enough to pressure returns.
Looking into 2026, the contrast is clear. Equities require near-perfect execution, while metals simply require existing structural trends to persist. In the current macro regime, capital appears increasingly aligned with the latter.
JPMorgan's Natasha Kaneva isn't hedging. $5,000 gold by year-end 2026, heading toward $5,400 in 2027.
"While this rally in gold has not, and will not, be linear, we believe the trends driving this rebasing higher in gold prices are not exhausted," Kaneva said. "The long-term trend of official reserve and investor diversification into gold has further to run."
Ed Yardeni — whose calls have been right often enough that people listen — sits at $6,000 gold by the end of 2026, with $10,000 by the end of the decade. Bank of America is at $5,000.
That's a directional consensus: $5,000 to $6,000. Even from today's levels, that's 10% to 30% upside. And the forecasts keep getting revised higher as the rally continues.

Silver? Wall Street Can't Keep Up.
Silver is making a mockery of the forecasts. Most of the major bank targets for year-end 2026 have already been blown through.
The problem isn't that analysts got it wrong. It's that they're scrambling to catch up with a market that's in price discovery mode. Citi's more aggressive models point toward $110 in the second half of 2026. Technical analysts are talking about $100-plus if the gold-to-silver ratio compression continues.
Steven Orrell at OCM Gold Fund explained what's happening: "Historically, silver tends to lag gold early in a bull run and then experiences sharp catch-up rallies, which is what we're seeing now."
That's the pattern playing out in real time. Silver doesn't follow gold — it amplifies gold. And when Wall Street's year-end targets are already behind the spot price, you're not in a normal bull market anymore. You're in a structural repricing.

The equity guys? They're hoping.
Deutsche Bank has the highest target on the Street: 8,000 on the S&P 500. That's roughly 15% upside from current levels.
Goldman Sachs sits at 7,600, forecasting $305 in earnings per share — 12% growth.
JPMorgan's baseline is 7,500, with upside to 8,000 if the Fed cuts more aggressively. But listen to how Dubravko Lakos-Nujas frames it: "Despite AI bubble and valuation concerns, we see current elevated multiples correctly anticipating above-trend earnings growth, an AI capex boom, rising shareholder payouts and easier fiscal policy."
Despite bubble concerns. That's not conviction. That's hope that valuations don't matter because earnings will bail everyone out.
Bank of America is more honest. 7,100 target. $310 in earnings. But here's what matters:
"Multiple expansion and earnings growth both pushed the S&P 500 up 15% this year. In 2026, earnings will do the lift with about 10pt PE contraction."
Translation: don't expect the market to get more expensive. Expect it to get cheaper, and hope earnings growth offsets the valuation decline.
The range across Wall Street: 7,100 to 8,000. That's 5% to 15% upside, and every forecast comes with conditions attached.

Goldman's number "assumes strong profit growth, stable inflation, and rate cuts starting in mid-2026."
Ned Davis Research sits at just 7,000 — barely 3% higher than today. Ed Clissold told CNBC he worries investors are on a "sugar high" and that changing Fed leadership in May could create volatility.
One analyst put it bluntly: "At current valuation levels, stocks don't need a crisis to fall; they only need disappointment."
This Isn't a Cycle. It's a Regime.
I've been in this business for 43 years. I know what conviction looks like.
When JPMorgan talks about a "long-term trend of official reserve diversification" that has "further to run," they're not talking about a six-month trade. They're talking about something structural.
Ben McMillan at IDX Advisors called it what it is: "After Covid is when we started seeing central banks really step up buying gold to an unprecedented level, and it hasn't really waned. That was kind of a structural shift, not a shift along the demand curve for gold; that's a regime change."
A regime change.
For the first time since 1996, gold now accounts for a larger share of central bank reserves than U.S. Treasuries. That's not a trend line. That's a tectonic shift in how sovereign wealth views risk.
Gold ETFs posted a record $26 billion inflow in Q3 2025 alone. Silver has been in a structural supply deficit for five consecutive years. Solar, EVs, AI data centers — they all need silver, and there's no substitute that performs as well.
Meanwhile, the S&P 500 is trading at a forward P/E around 22 to 23 times earnings — well above the historical average of 15.3x. The bull case for stocks requires everything to go right: strong GDP, stable inflation, margin expansion, no policy mistakes, AI spending that actually translates to profits.
The bull case for metals requires one thing: that central banks keep doing what they've been doing.
Stocks could deliver 7%, 10%, maybe 12% if everything breaks right. But they could just as easily go sideways or down 10% if anything disappoints — and at these valuations, the margin for error is thin.
Gold and silver? The structural drivers — currency dilution, central bank buying, supply deficits — aren't going away. The downside is limited. The upside is wide open.
The stock guys are penciling in single-digit to low-teens returns if the stars align.
The metal guys are already revising targets higher because the foundation shifted underneath the market.
After watching every major turn since Volcker broke inflation's back, I've learned one thing: when equity forecasts come with asterisks and metal forecasts keep getting raised mid-cycle, the metals win.
Stocks need perfect execution. Metals just need the system to keep being the system.
I know which bet I'd take.


Daily Light Crude Oil FuturesWhite Label
Data API
Web Plug-ins
Poster Maker
Affiliate Program
The risk of loss in trading financial instruments such as stocks, FX, commodities, futures, bonds, ETFs and crypto can be substantial. You may sustain a total loss of the funds that you deposit with your broker. Therefore, you should carefully consider whether such trading is suitable for you in light of your circumstances and financial resources.
No decision to invest should be made without thoroughly conducting due diligence by yourself or consulting with your financial advisors. Our web content might not suit you since we don't know your financial conditions and investment needs. Our financial information might have latency or contain inaccuracy, so you should be fully responsible for any of your trading and investment decisions. The company will not be responsible for your capital loss.
Without getting permission from the website, you are not allowed to copy the website's graphics, texts, or trademarks. Intellectual property rights in the content or data incorporated into this website belong to its providers and exchange merchants.
Not Logged In
Log in to access more features

FastBull Membership
Not yet
Purchase
Log In
Sign Up