• Trade
  • Markets
  • Copy
  • Contests
  • News
  • 24/7
  • Calendar
  • Q&A
  • Chats
Trending
Screeners
SYMBOL
LAST
BID
ASK
HIGH
LOW
NET CHG.
%CHG.
SPREAD
SPX
S&P 500 Index
6827.42
6827.42
6827.42
6899.86
6801.80
-73.58
-1.07%
--
DJI
Dow Jones Industrial Average
48458.04
48458.04
48458.04
48886.86
48334.10
-245.98
-0.51%
--
IXIC
NASDAQ Composite Index
23195.16
23195.16
23195.16
23554.89
23094.51
-398.69
-1.69%
--
USDX
US Dollar Index
97.980
98.060
97.980
98.070
97.920
+0.030
+ 0.03%
--
EURUSD
Euro / US Dollar
1.17305
1.17313
1.17305
1.17447
1.17283
-0.00089
-0.08%
--
GBPUSD
Pound Sterling / US Dollar
1.33580
1.33589
1.33580
1.33740
1.33546
-0.00127
-0.09%
--
XAUUSD
Gold / US Dollar
4339.95
4340.36
4339.95
4345.46
4294.68
+40.56
+ 0.94%
--
WTI
Light Sweet Crude Oil
57.480
57.517
57.480
57.601
57.194
+0.247
+ 0.43%
--

Community Accounts

Signal Accounts
--
Profit Accounts
--
Loss Accounts
--
View More

Become a signal provider

Sell trading signals to earn additional income

View More

Guide to Copy Trading

Get started with ease and confidence

View More

Signal Accounts for Members

All Signal Accounts

Best Return
  • Best Return
  • Best P/L
  • Best MDD
Past 1W
  • Past 1W
  • Past 1M
  • Past 1Y

All Contests

  • All
  • Trump Updates
  • Recommend
  • Stocks
  • Cryptocurrencies
  • Central Banks
  • Featured News
Top News Only
Share

India's November Soyoil Imports At 370661 Tonnes Versus 454619 Tonnes In October

Share

India's November Sunflower Oil Imports At 142953 Tonnes Versus 260548 Tonnes In October

Share

India's November Palm Oil Imports At 632341 Tonnes Versus 602381 Tonnes In October

Share

India's November Vegetable Oil Imports At 1183,832 Tonnes Versus 1332,173 Million Tonnes In October

Share

Reuters Poll - Bank Indonesia To Keep 7-Day Reverse Repo Rate Unchanged At 4.75% On December 17, Say 18 Of 31 Economists

Share

Statistics Finland - Finland Nov CPI -0.1% Year-On-Year

Share

Saudi Nov CPI 0.1% Month-On-Month

Share

Saudi Nov CPI 1.9% Year-On-Year

Share

South Korea Petrochemical Exports To Fall 6.1% In 2026 - Kcci

Share

U.S. Stock Futures Rose Slightly, With S&P 500 Futures And Dow Jones Futures Up 0.3% And NASDAQ 100 Futures Up Nearly 0.3%

Share

Spot Gold Rose $9 To $4,338.5 Per Ounce In The Short Term; New York Gold Futures Rose 1.00% On The Day, Currently Trading At $4,371.60 Per Ounce

Share

Dollar/Yen Extends Fall, Down 0.47% To 155.10

Share

Bank Of Japan: Two Branches Expect Higher Pay Rises In Fiscal Year 2026, While Two Other Branches Expect Wage Growth To Slow

Share

Bloomberg News: Bank Of Japan To Start Selling ETF Holdings As Early As January

Share

Malaysia Says Special ASEAN Foreign Ministers Meeting Scheduled For Dec 16 Delayed To Dec 22 At Thailand's Request

Share

Bank Of Japan: Wages Of Part-Time Employees Are Being Raised Reflecting Relatively High Minimum Wage Growth In Fiscal 2025

Share

Bank Of Japan: Firms' Wage Growth Outlook Due To Need For Retaining Staff Amid Persistent, Severe Labour Shortages

Share

Bank Of Japan - While Large And Medium-Sized Firms Were Likely To Be Able To Raise As Much Wages In FY 2026 As They Did In FY 2025, It Would Be Difficult For Small Firms To Raise As Much Wages In FY 2026 As In FY 2025

Share

Bank Of Japan: Most Companies Seem To Believe That Wage Increases In Fiscal Year 2026 Should Be The Same As Or Similar To Those In Fiscal Year 2025

Share

Bank Of Japan: Number Of Firms Expecting A Clear Improvement In Their Profits Is Not Large

TIME
ACT
FCST
PREV
U.K. Trade Balance Non-EU (SA) (Oct)

A:--

F: --

P: --

France HICP Final MoM (Nov)

A:--

F: --

P: --

China, Mainland Outstanding Loans Growth YoY (Nov)

A:--

F: --

P: --

China, Mainland M2 Money Supply YoY (Nov)

A:--

F: --

P: --

China, Mainland M0 Money Supply YoY (Nov)

A:--

F: --

P: --

China, Mainland M1 Money Supply YoY (Nov)

A:--

F: --

P: --

India CPI YoY (Nov)

A:--

F: --

P: --

India Deposit Gowth YoY

A:--

F: --

P: --

Brazil Services Growth YoY (Oct)

A:--

F: --

P: --

Mexico Industrial Output YoY (Oct)

A:--

F: --

P: --

Russia Trade Balance (Oct)

A:--

F: --

P: --

Philadelphia Fed President Henry Paulson delivers a speech
Canada Building Permits MoM (SA) (Oct)

A:--

F: --

P: --

Canada Wholesale Sales YoY (Oct)

A:--

F: --

P: --

Canada Wholesale Inventory MoM (Oct)

A:--

F: --

P: --

Canada Wholesale Inventory YoY (Oct)

A:--

F: --

P: --

Canada Wholesale Sales MoM (SA) (Oct)

A:--

F: --

P: --

Germany Current Account (Not SA) (Oct)

A:--

F: --

P: --

U.S. Weekly Total Rig Count

A:--

F: --

P: --

U.S. Weekly Total Oil Rig Count

A:--

F: --

P: --

Japan Tankan Small Manufacturing Outlook Index (Q4)

A:--

F: --

P: --

Japan Tankan Large Non-Manufacturing Diffusion Index (Q4)

A:--

F: --

P: --

Japan Tankan Large Non-Manufacturing Outlook Index (Q4)

A:--

F: --

P: --

Japan Tankan Large Manufacturing Outlook Index (Q4)

A:--

F: --

P: --

Japan Tankan Small Manufacturing Diffusion Index (Q4)

A:--

F: --

P: --

Japan Tankan Large Manufacturing Diffusion Index (Q4)

A:--

F: --

P: --

Japan Tankan Large-Enterprise Capital Expenditure YoY (Q4)

A:--

F: --

P: --

U.K. Rightmove House Price Index YoY (Dec)

A:--

F: --

P: --

China, Mainland Industrial Output YoY (YTD) (Nov)

A:--

F: --

P: --

China, Mainland Urban Area Unemployment Rate (Nov)

A:--

F: --

P: --

Saudi Arabia CPI YoY (Nov)

A:--

F: --

P: --

Euro Zone Industrial Output YoY (Oct)

--

F: --

P: --

Euro Zone Industrial Output MoM (Oct)

--

F: --

P: --

Canada Existing Home Sales MoM (Nov)

--

F: --

P: --

Euro Zone Total Reserve Assets (Nov)

--

F: --

P: --

U.K. Inflation Rate Expectations

--

F: --

P: --

Canada National Economic Confidence Index

--

F: --

P: --

Canada New Housing Starts (Nov)

--

F: --

P: --

U.S. NY Fed Manufacturing Employment Index (Dec)

--

F: --

P: --

U.S. NY Fed Manufacturing Index (Dec)

--

F: --

P: --

Canada Core CPI YoY (Nov)

--

F: --

P: --

Canada Manufacturing Unfilled Orders MoM (Oct)

--

F: --

P: --

U.S. NY Fed Manufacturing Prices Received Index (Dec)

--

F: --

P: --

U.S. NY Fed Manufacturing New Orders Index (Dec)

--

F: --

P: --

Canada Manufacturing New Orders MoM (Oct)

--

F: --

P: --

Canada Core CPI MoM (Nov)

--

F: --

P: --

Canada Trimmed CPI YoY (SA) (Nov)

--

F: --

P: --

Canada Manufacturing Inventory MoM (Oct)

--

F: --

P: --

Canada CPI YoY (Nov)

--

F: --

P: --

Canada CPI MoM (Nov)

--

F: --

P: --

Canada CPI YoY (SA) (Nov)

--

F: --

P: --

Canada Core CPI MoM (SA) (Nov)

--

F: --

P: --

Canada CPI MoM (SA) (Nov)

--

F: --

P: --

Federal Reserve Board Governor Milan delivered a speech
U.S. NAHB Housing Market Index (Dec)

--

F: --

P: --

Australia Composite PMI Prelim (Dec)

--

F: --

P: --

Australia Services PMI Prelim (Dec)

--

F: --

P: --

Australia Manufacturing PMI Prelim (Dec)

--

F: --

P: --

Japan Manufacturing PMI Prelim (SA) (Dec)

--

F: --

P: --

U.K. Unemployment Claimant Count (Nov)

--

F: --

P: --

U.K. Unemployment Rate (Nov)

--

F: --

P: --

Q&A with Experts
    • All
    • Chatrooms
    • Groups
    • Friends
    Connecting
    .
    .
    .
    Type here...
    Add Symbol or Code

      No matching data

      All
      Trump Updates
      Recommend
      Stocks
      Cryptocurrencies
      Central Banks
      Featured News
      • All
      • Russia-Ukraine Conflict
      • Middle East Flashpoint
      • All
      • Russia-Ukraine Conflict
      • Middle East Flashpoint
      Search
      Products

      Charts Free Forever

      Chats Q&A with Experts
      Screeners Economic Calendar Data Tools
      Membership Features
      Data Warehouse Market Trends Institutional Data Policy Rates Macro

      Market Trends

      Market Sentiment Order Book Forex Correlations

      Top Indicators

      Charts Free Forever
      Markets

      News

      News Analysis 24/7 Columns Education
      From Institutions From Analysts
      Topics Columnists

      Latest Views

      Latest Views

      Trending Topics

      Top Columnists

      Latest Update

      Signals

      Copy Rankings Latest Signals Become a signal provider AI Rating
      Contests
      Brokers

      Overview Brokers Assessment Rankings Regulators News Claims
      Broker listing Forex Brokers Comparison Tool Live Spread Comparison Scam
      Q&A Complaint Scam Alert Videos Tips to Detect Scam
      More

      Business
      Events
      Careers About Us Advertising Help Center

      White Label

      Data API

      Web Plug-ins

      Affiliate Program

      Awards Institution Evaluation IB Seminar Salon Event Exhibition
      Vietnam Thailand Singapore Dubai
      Fans Party Investment Sharing Session
      FastBull Summit BrokersView Expo
      Recent Searches
        Top Searches
          Markets
          News
          Analysis
          User
          24/7
          Economic Calendar
          Education
          Data
          • Names
          • Latest
          • Prev

          View All

          No data

          Scan to Download

          Faster Charts, Chat Faster!

          Download App
          English
          • English
          • Español
          • العربية
          • Bahasa Indonesia
          • Bahasa Melayu
          • Tiếng Việt
          • ภาษาไทย
          • Français
          • Italiano
          • Türkçe
          • Русский язык
          • 简中
          • 繁中
          Open Account
          Search
          Products
          Charts Free Forever
          Markets
          News
          Signals

          Copy Rankings Latest Signals Become a signal provider AI Rating
          Contests
          Brokers

          Overview Brokers Assessment Rankings Regulators News Claims
          Broker listing Forex Brokers Comparison Tool Live Spread Comparison Scam
          Q&A Complaint Scam Alert Videos Tips to Detect Scam
          More

          Business
          Events
          Careers About Us Advertising Help Center

          White Label

          Data API

          Web Plug-ins

          Affiliate Program

          Awards Institution Evaluation IB Seminar Salon Event Exhibition
          Vietnam Thailand Singapore Dubai
          Fans Party Investment Sharing Session
          FastBull Summit BrokersView Expo

          US Inflation Warms Up In June As Tariffs Boost Some Goods Prices

          Owen Li

          Central Bank

          Summary:

          U.S. inflation increased in June as tariffs boosted prices for imported goods like household furniture and recreation products, supporting views that price pressures would pick up in the second half of the year and delay the Federal Reserve from resuming cutting interest rates until at least October.

          U.S. inflation increased in June as tariffs boosted prices for imported goods like household furniture and recreation products, supporting views that price pressures would pick up in the second half of the year and delay the Federal Reserve from resuming cutting interest rates until at least October.

          The report from the Commerce Department on Thursday showed goods prices last month posting their biggest gain since January, with also solid rises in the costs of clothing and footwear. The U.S. central bank on Wednesday left its benchmark interest rate in the 4.25%-4.50% range and Fed Chair Jerome Powell's comments after the decision undercut confidence the central bank would resume policy easing in September as had been widely anticipated by financial markets and some economists.

          "The Fed is unlikely to welcome the inflation dynamics currently taking hold," said Olu Sonola, head of U.S. economic research, Fitch Ratings. "Rather than converging toward target, inflation is now clearly diverging from it. This trajectory is likely to complicate current expectations for a rate cut in September or October."

          The personal consumption expenditures (PCE) price index rose 0.3% last month after an upwardly revised 0.2% gain in May, the Commerce Department's Bureau of Economic Analysis said. Economists polled by Reuters had forecast the PCE price index climbing 0.3% following a previously reported 0.1% rise in May.

          Prices for furnishings and durable household equipment jumped 1.3%, the biggest gain since March 2022, after increasing 0.6% in May. Recreational goods and vehicles prices shot up 0.9%, the most since February 2024, after being unchanged in May. Prices for clothing and footwear rose 0.4%.

          Outside the tariff-sensitive goods, prices for gasoline and other energy products rebounded 0.9% after falling for four consecutive months. Services prices rose 0.2% for a fourth straight month, restrained by cheaper airline fares and steady prices for dining out and hotel stays.

          In the 12 months through June, the PCE price index advanced 2.6% after increasing 2.4% in May.

          The data was included in the advance gross domestic product report for the second quarter published on Wednesday, which showed inflation cooling, though remaining above the Fed's 2% target. Economists said businesses were still selling inventory accumulated before President Donald Trump's sweeping import duties came into effect.

          They expected a broad increase in goods prices in the second half. Procter & Gamble (PG.N), opens new tab said this week it would raise prices on some products in the U.S. to offset tariff costs.

          The Fed tracks the PCE price measures for monetary policy.

          Excluding the volatile food and energy components, the PCE price index increased 0.3% last month after rising 0.2% in May. In addition to higher goods prices, the so-called core PCE inflation was lifted by rising costs for healthcare as well as financial services and insurance.

          In the 12 months through June, core inflation advanced 2.8% after rising by the same margin in May.

          Stocks on Wall Street were mixed. The dollar was steady against a basket of currencies. U.S. Treasury yields fell.

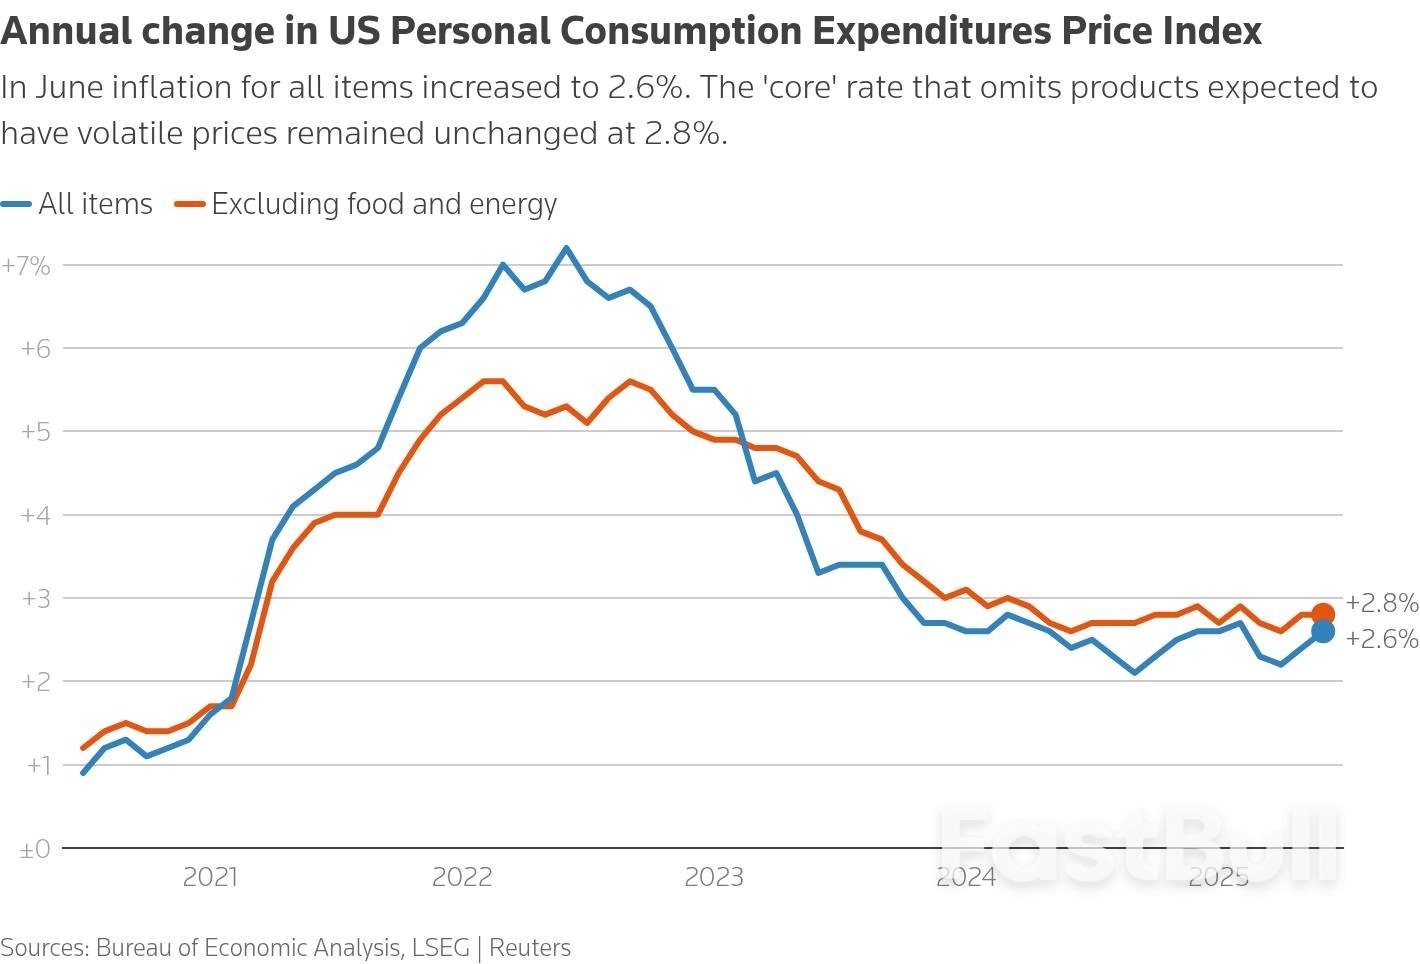
          A line chart titled "Annual change in US Personal Consumption Expenditures Price Index" that compares two key inflation metrics over the past five years.

          CONSUMER SPENDING STEADY

          The BEA also reported that consumer spending, which accounts for more than two-thirds of economic activity, rose 0.3% in June after being unchanged in May. The data was also included in the advance GDP report, which showed consumer spending growing at a 1.4% annualized rate last quarter after almost stalling in the first quarter.

          In the second quarter, economic growth rebounded at a 3.0% rate, boosted by a sharp reduction in the trade deficit because of fewer imports relative to the record surge in the January-March quarter. The economy contracted at a 0.5% pace in the first three months of the year.

          Spending is being supported by a stable labor market, with other data from the Labor Department showing initial claims for state unemployment benefits rose 1,000 to a seasonally adjusted 218,000 for the week ended July 26.

          But a reluctance by employers to increase headcount amid uncertainty over where tariff levels will eventually settle is making it harder for those who lose their jobs to find new opportunities, which could hamper future spending.

          The number of people receiving benefits after an initial week of aid, a proxy for hiring, was unchanged at a lofty seasonally adjusted 1.946 million during the week ending July 19, the claims report showed.

          The government's closely watched employment report on Friday is expected to show the unemployment rate rising to 4.2% in July from 4.1% in June, according to a Reuters survey of economists.

          Economists expect pressure from tariffs and a slowing labor market will put a brake on consumer spending in the third quarter. Slow growth is likely already in the works as inflation-adjusted consumer spending edged up 0.1% in June after declining 0.2% in May.

          Precautionary saving could also curb spending. The saving rate was unchanged at 4.5% in June.

          Though a third report from the Labor Department showed wage growth picking up in the second quarter, inflation-adjusted annual gains moderated to 0.9% from 1.1% in the 12 months through March.

          The BEA report showed inflation cutting into income for households after accounting for taxes, which was flat in June.

          Signs of financial strain are also emerging among higher-income households, who have largely been driving spending. Lower- and middle-income families have been disproportionately affected by tariff-related price increases, higher borrowing costs and slowing economic activity.

          "While consumer spending has thus held up — supported by solid income gains — it now faces mounting headwinds from a cooling labor market and renewed inflationary pressures," said Gregory Daco, chief economist at EY-Parthenon.

          Source: Reuters

          Risk Warnings and Disclaimers
          You understand and acknowledge that there is a high degree of risk involved in trading. Following any strategies or investment methods may lead to potential losses. The content on the site is provided by our contributors and analysts for information purposes only. You are solely responsible for determining whether any trading assets, securities, strategy, or any other product is suitable for investing based on your own investment objectives and financial situation.
          Add to Favorites
          Share

          Trump’s 50% copper tariff includes a major exemption. That won’t halt price rises

          Adam

          Commodity

          A major exemption to President Donald Trump’s 50% copper tariff has shocked traders and sent U.S. market prices plummeting.
          The final order on copper tariffs, which the Trump administration says will boost the domestic copper production industry, applies to semi-finished products such as pipes, rods, sheets and wires. It also impacts copper-intensive items like cables and electrical components. But crucially, it does not include the raw input material copper cathode, copper ores, concentrates or scraps, as had been widely expected.
          However, analysts say that may not be enough to avoid prices for a range of consumer goods containing the metal, from cookware to air conditioning units to plumbing parts, being pushed higher as a result of the tariffs.
          U.S. copper prices on the Chicago Mercantile Exchange (CME) shot to a record high earlier this month, also hitting an all-time premium over the global benchmark London Metal Exchange (LME), following the initial July announcement of a 50% tariff. While importers had already sent refined copper flooding stateside at record levels through the first half of the year in anticipation of new duties, the scale of a blanket 50% rate jolted markets and put severe upward pressure on U.S. prices.
          The eventual reveal on Wednesday of a tariff targeting only semi-finished products has provided yet another massive shock. In the minutes after the news, COMEX copper (metals futures contracts on the CME) fell 19% in the biggest intraday fall on record, according to bank ING.
          The gap between COMEX above LME prices has been around 30% since the initial July 8 announcement, implying continued uncertainty that the overall tariff rate would end up at 50%.
          However, traders were instead considering possible exemptions for countries such as major exporter Chile, or for delays to full implementation of tariffs, Albert Mackenzie, copper analyst at Benchmark Mineral Intelligence, told CNBC.
          The actual situation is almost a 180-degree pivot from what was expected and what was being priced in to the CME, which was tariffs on refined copper, Mackenzie continued.
          The deviation sent the CME price premium plummeting from around $2,637 at the start of Wednesday to just $90 on Thursday morning in Europe, Mackenzie said — a scale of a drop that would look like a mistake were it not for the tariff context, he added.
          Downward U.S. price pressure
          While traders were taking advantage of a price arbitrage, part of the reason for the huge redirection of copper supply into the U.S. has been that it would take decades for the country to be able to sufficiently increase domestic production of the metal to meet demand. The U.S. currently imports around half its copper, with major exporters including Chile, Canada, Peru and Mexico.
          Analysts at Deutsche Bank stressed the “huge shock to the market” this week, noting Thursday that shares of Arizona-based miner Freeport-McMoRan— the copper company most exposed to tariffs on refined copper driving up U.S. prices — closed over 9% lower the previous day.
          “Fundamentally, this does not change the copper supply-demand balance (and arguably improves it due to less demand destruction risk), but is likely to put COMEX under heavy pressure,” they wrote.
          Downward price pressure is likely to follow through onto the LME on a less dramatic scale, they said, in the wake of the massive build-up in refined inventories in the U.S. so far this year. The overhang “could see high shipments from the U.S. back into the global market,” they said, where supply has become tight.
          Duncan Wanblad, CEO of mining giant Anglo American– which has major copper operations around the world – told CNBC’s “Squawk Box Europe” on Thursday that while there was currently a “material dislocation” in the placement of inventories, the demand fundamentals for copper “look great.”
          “Through a medium- to long- term lens, the fundamentals of copper are really underpinned by the fact that demand is looking to be very strong still in terms of the world’s need for an energy transition, for the likes of battery-electric vehicles, for the likes of new energy supply, data centers, AI,” he said. Supply on that longer-term outlook remains constrained, he added, amid difficulties obtaining permits and getting product into market.
          Consumer goods impact
          One policy revealed Wednesday is that the copper tariffs will not stack on top of Trump’s new duties on automobile imports, meaning only the latter rate would apply to an impacted product.
          However, Benchmark Mineral Intelligence’s Mackenzie pointed out that a lower U.S. market price premium does not mean no feed-through into prices for consumer products.
          “If you’re a manufacturer of fridges or air conditioning units, or even houses, you don’t buy copper cathode. You buy wiring and other semi-finished copper products, which are the things being tariffed. So it’s reasonable to assume the price increase will be reflected in some end goods,” Mackenzie said.
          Russ Bukowski, president of manufacturing software company Mastercam, agreed.
          “Although there are currently high inventories of copper in the country, the 50% increase on copper tariffs is going to hurt manufacturers in the long run and lead to higher production costs,” Bukowski told CNBC.
          “To stay afloat, manufacturers may have to pass these costs to consumers, which will likely drive-up prices on various goods.”
          Michael Reid, senior U.S. economist at RBC Capital Markets, said the impact on consumer prices would be “nuanced.”
          “The largest sectors that use copper as inputs include motor vehicles, plumbing fixtures and valve fittings, communications wire (i.e., cable and internet providers), and various electrical components. To that end, the manner by which those products are made matters – which is to say, if a car is imported, its copper content won’t be tariffed,” Reid said by email.
          “Where we would expect to see it impact consumer prices the most would be in the housing/construction sector where copper inputs play a big role for electric wiring and plumbing.”
          “But in the context of the overall cost of a house, the impact is not as harsh as the 50% may sound – assuming the typical cost of plumbing and electric components is $10k then an aggressive full passthrough to the end consumer would mean costs rise to $15k. In the overall cost of a home, that $5k increase would be around 10%,” he added.

          Source: cnbc

          Risk Warnings and Disclaimers
          You understand and acknowledge that there is a high degree of risk involved in trading. Following any strategies or investment methods may lead to potential losses. The content on the site is provided by our contributors and analysts for information purposes only. You are solely responsible for determining whether any trading assets, securities, strategy, or any other product is suitable for investing based on your own investment objectives and financial situation.
          Add to Favorites
          Share

          Price hikes may soon bite as firms sell off pre-tariff inventory, says global business group

          Adam

          Economic

          Tariff-related price hikes may start to bite at the end of the third quarter as companies may by then have sold off U.S. stockpiles built up ahead of the new duties, according to the International Chamber of Commerce.
          Businesses making everything from cars to drugs and cheese and wine have expedited deliveries to the United States this year to get ahead of U.S. President Donald Trump's tariffs.
          They have about four months of inventory, about one month more than average, Andrew Wilson, International Chamber of Commerce deputy secretary general, estimated on Thursday, helping some delay hiking prices.
          "You could expect it to bite at the end of Q3," he told Reuters once they have sold off that inventory. Wilson previously forecast tariff-related price hikes would show up in U.S. inflation in the fourth quarter or early next year.
          Data on Thursday showed U.S. inflation increased in June as tariffs started raising the cost of some goods, supporting economists' expectations that price pressures would pick up in the second half.
          Some of the world's biggest companies have warned for months that they would be squeezed by duties.
          They have now started to outline how they plan to pass on the costs and change their businesses to try to cushion the blow of rising costs, uncertainty over U.S. trade policy, and waning consumer confidence.
          Companies are testing how much they can pass tariffs onto U.S. customers.
          But global retailers including sandal maker Birkenstock and jeweller Pandora have also looked at raising prices across multiple markets to avoid hurting U.S. sales.
          "There's a logic taking hold that (price hikes) won't be just borne by the U.S. consumer," he said.

          Source: Reuters

          To stay updated on all economic events of today, please check out our Economic calendar
          Risk Warnings and Disclaimers
          You understand and acknowledge that there is a high degree of risk involved in trading. Following any strategies or investment methods may lead to potential losses. The content on the site is provided by our contributors and analysts for information purposes only. You are solely responsible for determining whether any trading assets, securities, strategy, or any other product is suitable for investing based on your own investment objectives and financial situation.
          Add to Favorites
          Share

          NZD/USD tests the edge of its range as USD buying pressure builds

          Adam

          Forex

          APAC currencies have struggled over the past month, with NZD among the laggards amid a strong US Dollar comeback.
          The FOMC kept rates unchanged at its latest meeting yesterday, and FX Markets are now preparing for the upcoming RBNZ decision, slated for August 14.
          NZDUSD has been relatively rangebound within a 2-handle zone since May, following a sharp April down-move sparked by volatility around Trump's infamous Liberation Day.
          Before attacking the multi-timeframe technical analysis of NZDUSD, here is a small reminder that this morning, the reports for the Core PCE—which came slightly above expectations (2.8% y/y vs 2.7% estimate)—and an as-expected Canadian GDP (-0.1% m/m) also got released, both of which helped anchor further USD flows.
          For the Kiwi, tonight’s NZ Consumer Confidence and Building Permits data will provide insight into local momentum heading into August's policy window.

          NZDUSD Multi-timeframe technical analysis

          NZDUSD Daily Chart

          NZD/USD tests the edge of its range as USD buying pressure builds_1NZDUSD Daily Chart, July 31, 2025

          Bears have taken control of the Kiwi throughout July sending the pair down around 3.50% from its 2025 Highs as the month concludes – NZDUSD has also recently broken out of a Monthly upwards Channel (light blue)The Daily picture is not showing many signs of reversals after forming a strong bearish inverted hammer.The pair is now entering the Main 0.59 Support Zone, surely prompting reactions as Month-end flows commence – Daily RSI is flattening just above the oversold level.Looking closer will allow us to spot if more balanced price action is into play here.
          NZDUSD 4H Chart

          NZD/USD tests the edge of its range as USD buying pressure builds_2NZDUSD 4H Chart, July 31, 2025

          The downwards correction had taken a small break in the beginning of last week but got met with another sharp response which marked some lower highs (0.60580) right below the Monthly Channel.One element that would give back some balance for NZD buyers would be the reactions at the highs of the July Hourly steep downwards channel that also got broken, within the 0.59 Support Zone.Failure to rebound from here would maintain seller strength – Looking at the Dollar Index would be very beneficial also to spot reactions as the Index arrives at the 100.00 level.
          NZDUSD 1H Chart

          NZD/USD tests the edge of its range as USD buying pressure builds_3NZDUSD 1H Chart, July 31, 2025

          Looking even closer, we spot reactions to the Support Zone that is currently being tested at a break-retest of the Hourly downwards channel, last line of defense for the Monthly range.Buyers are stepping in, attempting to form a hourly double bottom at the 0.5890 level.Momentum is coming back slightly from oversold levels, therefore reactions here are key.A 4H Candle closing below the daily lows would cancel the double bottom formation, but in the meantime, the action looks more balance in shorter timeframes

          Source: marketpulse

          Risk Warnings and Disclaimers
          You understand and acknowledge that there is a high degree of risk involved in trading. Following any strategies or investment methods may lead to potential losses. The content on the site is provided by our contributors and analysts for information purposes only. You are solely responsible for determining whether any trading assets, securities, strategy, or any other product is suitable for investing based on your own investment objectives and financial situation.
          Add to Favorites
          Share

          Trump Extends Mexico Trade Deal Deadline

          Devin

          Economic

          President Trump announced in a Truth Social 网站 that he is extending trade talks with Mexico for another 90 days. Yahoo Finance Washington Correspondent.

          President Trump announcing on Truth Social he is extending Mexico's current tariff rates for 90 days to allow more time for trade negotiations with the country. That announcement coming after Trump threatened last month to increase Mexico's country-based duty to 30% starting August 1st. The president's decision coming shortly after he said he would not extend his Friday deadline. Joining us now, Washington correspondent Ben Werschkull. Ben, we were just talking about the countries that have been left out in the cold so to speak. Mexico was one of them, but it seems like they're getting a little more time, but the time that they're getting comes still with these high tariffs attached.

          For sure. Yeah. So this is, this is the 90 day pause that Trump announced just a few minutes ago, and it'll, it'll keeps the rates at 25%. So it's not a 5% increase to, to 30%. I do think it's significant that Trump talked about this call as very successful. He had a lot of kind words for Mexican president Claudia Sheinbaum, um, as, as they met this morning to, to kind of work out these deals considering how, how many, how many issues they have to work out over the next 90 days on the border and these other things. Um, other things Trump announced today in this post will be that the 25% headline rate will continue, the 25% auto rate will continue. That's, that's a big one in focus. And then as with all the other deals, the 50% tariffs on steel, aluminum and copper, which is also coming tomorrow, will, will, will stay in place. So those, those rates will stay now. Um, Trump also announced that Mexico has agreed to terminate its non-tariff trade barriers without providing any additional details there. the President Sheinbaum did already respond to confirm this call and to confirm the 90 day pause. What she says she's focused on for the next 90 days is building a long-term deal with President Trump on all these other more complex trade issues.

          Source: Kitco

          To stay updated on all economic events of today, please check out our Economic calendar
          Risk Warnings and Disclaimers
          You understand and acknowledge that there is a high degree of risk involved in trading. Following any strategies or investment methods may lead to potential losses. The content on the site is provided by our contributors and analysts for information purposes only. You are solely responsible for determining whether any trading assets, securities, strategy, or any other product is suitable for investing based on your own investment objectives and financial situation.
          Add to Favorites
          Share

          S&P 500: Will Strong Earnings From Big Tech Keep Outweighing Trade Risks?

          Adam

          Stocks

          US equity futures surged, lifted by blockbuster results from Microsoft (NASDAQ:MSFT) and Meta (NASDAQ:META), as the tech giants reinforced investor optimism around artificial intelligence. Microsoft soared more than 8%, while Meta climbed 12%, both posting results well ahead of expectations and signalling continued aggressive investment in AI infrastructure.
          With more tech earnings to come today, sandwiched between key economic releases, and not to mention the August 1 tariffs deadline looming tomorrow, markets will face heightened volatility in the next day and a half.
          Before discussing the macro factors further and what to watch, let’s quickly turn our gaze to the charts first.

          S&P 500 Continues To Make New Highs

          With the S&P 500 futures at new record levels, the bullish trend is continuing for now, meaning dip-buying remains the preferred trading strategy until we see a change in the market structure of higher highs and higher lows.
          S&P 500: Will Strong Earnings From Big Tech Keep Outweighing Trade Risks?_1
          Short-term support now comes in at 6,435, marking the high from Wednesday, followed by the day’s close at 6,396, before those earnings caused the S&P 500 futures to gap. Below these levels, 6,333 is another important support level that needs to hold. As well as prior resistance, the 21-day average comes into play here, too. Only if we go below this level can we then talk about the possibility of a deeper pullback towards the old records set earlier this year, around the 6,150-6,166 area.
          On the upside, there are clear blue skies, and it is anyone’s guess where the next resistance will come. Still, it is important to keep an eye on round handles like 6,500.
          Meanwhile, keep an eye on the Relative Strength Index (RSI), which continues to trade at overbought levels of above 70. It will need to unwind through price action (i.e., a sell-off) or time (i.e., consolidation). The latter would be a bullish outcome, the former bearish.

          Big Tech Keeps Rallying Going For Now

          The S&P 500 futures rose by 1%, but let’s see if the gains can hold heading deeper into the week. Markets are currently being pulled in two directions: on one hand, a powerful earnings season led by tech is providing real momentum for equities.
          On the other hand, ongoing trade tensions and central bank policy ambiguity are acting as counterweights. For now, investors are choosing to focus on the former — but the balance remains fragile. Much will hinge on the next data prints and whether Trump’s tariff barrage finds traction in the real economy.
          Microsoft’s performance now puts it within striking distance of a $4 trillion market capitalisation – if it can hold onto some of those pre-market gains into the cash open.
          Amazon (NASDAQ:AMZN) and Apple (NASDAQ:AAPL) are next in line, with results due later after the close today. Markets will be watching closely to see if the momentum continues in the AI trade and whether the rest of the Magnificent Seven will deliver this quarter. So far, they’ve not disappointed.
          So, it is the big rally in Big Tech which is helping to keep the S&P 500 rally going for now, with investors growing worried about the impact on inflation of Trump’s tariffs. This has also worried the Fed, raising uncertainty over the path of interest rates.

          Tariffs: Trump Ups the Ante

          On the trade front, tensions have escalated after President Trump announced a 15% tariff on South Korean imports, matching measures previously levied on Japan, alongside a demand for $350 billion in US-bound investment from Seoul. India has also been targeted, facing a 25% levy, with Washington citing its continued purchases of Russian oil and defence equipment. However, spared the most traded forms of copper while slapping others with duties of up to 50%.
          These moves come ahead of the August 1 deadline set by the White House, with countries lacking bilateral trade agreements facing potential blanket tariffs ranging from 15% to 50%. Trump’s gambit, aimed at reshaping global trade and bringing manufacturing back onshore, has so far not caused a major, long-lasting drop in markets, beyond that swoon in early April. With indices now at record levels, Trump appears to win the market’s vote of confidence with his trade tactics.

          September Rate Cut No Longer A Sure Thing

          Fed Chair Jerome Powell delivered a hawkish hold, emphasising that no decision has yet been made regarding a September policy cut. While two Fed officials — Bowman and Waller — dissented in favour of a cut, Powell remained steadfast in his view that inflation risks remain present, and that a modestly restrictive stance is still warranted.
          Expectations that inflation could take a boost from tariffs in the coming months have helped to support bond yields and the US dollar. In reaction to Powell’s hawkish press conference, markets quickly adjusted expectations, with pricing for a September rate cut slipping from 16 basis points to just 11. Powell’s remarks placed him squarely at odds with the White House, with Trump continuing to demand multiple rate cuts.
          The hawkish repricing of the Fed’s policy has also been bolstered by strong GDP data and expectations that core inflation may remain sticky. Traders are now focused on upcoming economic prints — particularly today’s core PCE numbers and Friday’s jobs data — which could further influence rate expectations.

          Source: investing

          Risk Warnings and Disclaimers
          You understand and acknowledge that there is a high degree of risk involved in trading. Following any strategies or investment methods may lead to potential losses. The content on the site is provided by our contributors and analysts for information purposes only. You are solely responsible for determining whether any trading assets, securities, strategy, or any other product is suitable for investing based on your own investment objectives and financial situation.
          Add to Favorites
          Share

          Silver (XAG/USD) Price: Down 1.5% as Trendline Break Hints at Deeper Correction

          Adam

          Commodity

          Silver prices have fallen around 4.5% over the last two trading days as a resurgent US Dollar and weaker haven flows weigh on prices.
          The US Dollar remains strong, and rising US bond yields are limiting any chance of recovery for now. The Dollar’s strength is driven by hawkish comments from Fed Chair Jerome Powell, along with strong US GDP and job data. These factors support the Federal Reserve’s cautious stance on monetary policy and reduce expectations for rate cuts in the near future.
          Now Silver's extended rally this year was down to a combination of factors. Those include safe haven demand, a weak US Dollar and supply demand discrepancies.
          Now if haven demand remains low and the US Dollar rally continues, how deep could the pullback in silver prices be? For the record, the discrepancy between supply and demand remains in play and is highly unlikely to change anytime soon.
          With that in mind and only one of the three main causes of the silver rally still present, what could the potential downside for silver be?

          Technical Analysis - Silver (XAG/USD)

          From a technical standpoint, Silver has peaked at 39.52 before falling. A brief attempt at a recovery on Monday and Tuesday has faded away thanks to Fed Chair Powell's comments yesterday.
          A daily candle closed yesterday below the ascending trendline with further losses today.
          The RSI period-14 on the daily chart has crossed below the 50 neutral level but remains some way off oversold conditions.
          This means that further downside toward the 100-day MA at 34.60 could materialize.
          Silver (XAG/USD) Daily Chart, July 31, 2025
          Silver (XAG/USD) Price: Down 1.5% as Trendline Break Hints at Deeper Correction_1
          Dropping down to the four-hour chart and the picture changes slightly.
          The period-14 RSI is deep in oversold territory with a potential short-term pullback a real possibility.
          Looking toward the upside, resistance is provided by the 200-day MA at 37.24 and the 100-day MA at 38.09.
          A four-hour candle close above the 38.22 handle would invalidate a potential bearish setup in the near-term.
          Silver (XAG/USD) Four-Hour Chart, July 31, 2025
          Silver (XAG/USD) Price: Down 1.5% as Trendline Break Hints at Deeper Correction_2

          Source: marketpulse

          Risk Warnings and Disclaimers
          You understand and acknowledge that there is a high degree of risk involved in trading. Following any strategies or investment methods may lead to potential losses. The content on the site is provided by our contributors and analysts for information purposes only. You are solely responsible for determining whether any trading assets, securities, strategy, or any other product is suitable for investing based on your own investment objectives and financial situation.
          Add to Favorites
          Share
          FastBull
          Copyright © 2025 FastBull Ltd

          728 RM B 7/F GEE LOK IND BLDG NO 34 HUNG TO RD KWUN TONG KLN HONG KONG

          TelegramInstagramTwitterfacebooklinkedin
          App Store Google Play Google Play
          Products
          Charts

          Chats

          Q&A with Experts
          Screeners
          Economic Calendar
          Data
          Tools
          Membership
          Features
          Function
          Markets
          Copy Trading
          Latest Signals
          Contests
          News
          Analysis
          24/7
          Columns
          Education
          Company
          Careers
          About Us
          Contact Us
          Advertising
          Help Center
          Feedback
          User Agreement
          Privacy Policy
          Business

          White Label

          Data API

          Web Plug-ins

          Poster Maker

          Affiliate Program

          Risk Disclosure

          The risk of loss in trading financial instruments such as stocks, FX, commodities, futures, bonds, ETFs and crypto can be substantial. You may sustain a total loss of the funds that you deposit with your broker. Therefore, you should carefully consider whether such trading is suitable for you in light of your circumstances and financial resources.

          No decision to invest should be made without thoroughly conducting due diligence by yourself or consulting with your financial advisors. Our web content might not suit you since we don't know your financial conditions and investment needs. Our financial information might have latency or contain inaccuracy, so you should be fully responsible for any of your trading and investment decisions. The company will not be responsible for your capital loss.

          Without getting permission from the website, you are not allowed to copy the website's graphics, texts, or trademarks. Intellectual property rights in the content or data incorporated into this website belong to its providers and exchange merchants.

          Not Logged In

          Log in to access more features

          FastBull Membership

          Not yet

          Purchase

          Become a signal provider
          Help Center
          Customer Service
          Dark Mode
          Price Up/Down Colors

          Log In

          Sign Up

          Position
          Layout
          Fullscreen
          Default to Chart
          The chart page opens by default when you visit fastbull.com