• Trade
  • Markets
  • Copy
  • Contests
  • News
  • 24/7
  • Calendar
  • Q&A
  • Chats
Trending
Screeners
SYMBOL
LAST
BID
ASK
HIGH
LOW
NET CHG.
%CHG.
SPREAD
SPX
S&P 500 Index
6827.42
6827.42
6827.42
6899.86
6801.80
-73.58
-1.07%
--
DJI
Dow Jones Industrial Average
48458.04
48458.04
48458.04
48886.86
48334.10
-245.98
-0.51%
--
IXIC
NASDAQ Composite Index
23195.16
23195.16
23195.16
23554.89
23094.51
-398.69
-1.69%
--
USDX
US Dollar Index
97.950
98.030
97.950
98.500
97.950
-0.370
-0.38%
--
EURUSD
Euro / US Dollar
1.17394
1.17409
1.17394
1.17496
1.17192
+0.00011
+ 0.01%
--
GBPUSD
Pound Sterling / US Dollar
1.33707
1.33732
1.33707
1.33997
1.33419
-0.00148
-0.11%
--
XAUUSD
Gold / US Dollar
4299.39
4299.39
4299.39
4353.41
4257.10
+20.10
+ 0.47%
--
WTI
Light Sweet Crude Oil
57.233
57.485
57.233
58.011
56.969
-0.408
-0.71%
--

Community Accounts

Signal Accounts
--
Profit Accounts
--
Loss Accounts
--
View More

Become a signal provider

Sell trading signals to earn additional income

View More

Guide to Copy Trading

Get started with ease and confidence

View More

Signal Accounts for Members

All Signal Accounts

Best Return
  • Best Return
  • Best P/L
  • Best MDD
Past 1W
  • Past 1W
  • Past 1M
  • Past 1Y

All Contests

  • All
  • Trump Updates
  • Recommend
  • Stocks
  • Cryptocurrencies
  • Central Banks
  • Featured News
Top News Only
Share

Iranian Media Says 18 Crew Members Of Foreign Tanker Seized In Gulf Of Oman Over Carrying 'Smuggled Fuel' Detained

Share

Regional Governor: Two Killed In Ukrainian Drone Strike On Russia's Saratov

Share

Chinese Foreign Ministry - China Foreign Minister Met With United Arab Emirates Counterpart On Dec 12

Share

China's Central Financial And Economic Affairs Commission Deputy Director: Will Expand Export And Increase Import In 2026

Share

Thai Leader Anutin: Landmine Blast That Killed Thai Soldiers 'Not A Roadside Accident'

Share

Thai Leader Anutin: Thailand To Continue Military Action Until 'We Feel No More Harm'

Share

Cambodian Prime Minister Hun Manet Says He Had Phone Calls With Trump And Malaysian Leader Anwar About Ceasefire

Share

Cambodia's Hun Manet Says USA, Malaysia Should Verify 'Which Side Fired First' In Latest Conflict

Share

Cambodia's Hun Manet: Cambodia Maintains Its Stance In Seeking Peaceful Resolution Of Disputes

Share

Nasdaq Companies: Allergan, Ferrovia, Insmed, Monolithic Power Systems, Seagate Technology, And Western Digital Will Be Added To The NASDAQ 100 Index. Biogen, CdW, GlobalFoundries, Lululemon, ON Semiconductor, And Tradedesk Will Be Removed From The NASDAQ 100 Index

Share

Witkoff Headed To Berlin This Weekend To Meet With Zelenskiy, European Leaders -Wsj Reporter On X

Share

Russia Attacks Two Ukrainian Ports, Damaging Three Turkish-Owned Vessels

Share

[Historic Flooding Occurs In At Least Four Rivers In Washington State Due To Days Of Torrential Rains] Multiple Areas In Washington State Have Been Hit By Severe Flooding Due To Days Of Torrential Rains, With At Least Four Rivers Experiencing Historic Flooding. Reporters Learned On The 12th That The Floods Caused By The Torrential Rains In Washington State Have Destroyed Homes And Closed Several Highways. Experts Warn That Even More Severe Flooding May Occur In The Future. A State Of Emergency Has Been Declared In Washington State

Share

Trump Says Proposed Free Economic Zone In Donbas Would Work

Share

Trump: I Think My Voice Should Be Heard

Share

Trump Says Will Be Choosing New Fed Chair In Near Future

Share

Trump Says Proposed Free Economic Zone In Donbas Complex But Would Work

Share

Trump Says Land Strikes In Venezuela Will Start Happening

Share

US President Trump: Thailand And Cambodia Are In A Good Situation

Share

State Media: North Korean Leader Kim Hails Troops Returning From Russia Mission

TIME
ACT
FCST
PREV
U.K. Trade Balance Non-EU (SA) (Oct)

A:--

F: --

P: --

U.K. Trade Balance (Oct)

A:--

F: --

P: --

U.K. Services Index MoM

A:--

F: --

P: --

U.K. Construction Output MoM (SA) (Oct)

A:--

F: --

P: --

U.K. Industrial Output YoY (Oct)

A:--

F: --

P: --

U.K. Trade Balance (SA) (Oct)

A:--

F: --

P: --

U.K. Trade Balance EU (SA) (Oct)

A:--

F: --

P: --

U.K. Manufacturing Output YoY (Oct)

A:--

F: --

P: --

U.K. GDP MoM (Oct)

A:--

F: --

P: --

U.K. GDP YoY (SA) (Oct)

A:--

F: --

P: --

U.K. Industrial Output MoM (Oct)

A:--

F: --

P: --

U.K. Construction Output YoY (Oct)

A:--

F: --

P: --

France HICP Final MoM (Nov)

A:--

F: --

P: --

China, Mainland Outstanding Loans Growth YoY (Nov)

A:--

F: --

P: --

China, Mainland M2 Money Supply YoY (Nov)

A:--

F: --

P: --

China, Mainland M0 Money Supply YoY (Nov)

A:--

F: --

P: --

China, Mainland M1 Money Supply YoY (Nov)

A:--

F: --

P: --

India CPI YoY (Nov)

A:--

F: --

P: --

India Deposit Gowth YoY

A:--

F: --

P: --

Brazil Services Growth YoY (Oct)

A:--

F: --

P: --

Mexico Industrial Output YoY (Oct)

A:--

F: --

P: --

Russia Trade Balance (Oct)

A:--

F: --

P: --

Philadelphia Fed President Henry Paulson delivers a speech
Canada Building Permits MoM (SA) (Oct)

A:--

F: --

P: --

Canada Wholesale Sales YoY (Oct)

A:--

F: --

P: --

Canada Wholesale Inventory MoM (Oct)

A:--

F: --

P: --

Canada Wholesale Inventory YoY (Oct)

A:--

F: --

P: --

Canada Wholesale Sales MoM (SA) (Oct)

A:--

F: --

P: --

Germany Current Account (Not SA) (Oct)

A:--

F: --

P: --

U.S. Weekly Total Rig Count

A:--

F: --

P: --

U.S. Weekly Total Oil Rig Count

A:--

F: --

P: --

Japan Tankan Large Non-Manufacturing Diffusion Index (Q4)

--

F: --

P: --

Japan Tankan Small Manufacturing Outlook Index (Q4)

--

F: --

P: --

Japan Tankan Large Non-Manufacturing Outlook Index (Q4)

--

F: --

P: --

Japan Tankan Large Manufacturing Outlook Index (Q4)

--

F: --

P: --

Japan Tankan Small Manufacturing Diffusion Index (Q4)

--

F: --

P: --

Japan Tankan Large Manufacturing Diffusion Index (Q4)

--

F: --

P: --

Japan Tankan Large-Enterprise Capital Expenditure YoY (Q4)

--

F: --

P: --

U.K. Rightmove House Price Index YoY (Dec)

--

F: --

P: --

China, Mainland Industrial Output YoY (YTD) (Nov)

--

F: --

P: --

China, Mainland Urban Area Unemployment Rate (Nov)

--

F: --

P: --

Saudi Arabia CPI YoY (Nov)

--

F: --

P: --

Euro Zone Industrial Output YoY (Oct)

--

F: --

P: --

Euro Zone Industrial Output MoM (Oct)

--

F: --

P: --

Canada Existing Home Sales MoM (Nov)

--

F: --

P: --

Euro Zone Total Reserve Assets (Nov)

--

F: --

P: --

U.K. Inflation Rate Expectations

--

F: --

P: --

Canada National Economic Confidence Index

--

F: --

P: --

Canada New Housing Starts (Nov)

--

F: --

P: --

U.S. NY Fed Manufacturing Employment Index (Dec)

--

F: --

P: --

U.S. NY Fed Manufacturing Index (Dec)

--

F: --

P: --

Canada Core CPI YoY (Nov)

--

F: --

P: --

Canada Manufacturing Unfilled Orders MoM (Oct)

--

F: --

P: --

Canada Manufacturing New Orders MoM (Oct)

--

F: --

P: --

Canada Core CPI MoM (Nov)

--

F: --

P: --

Canada Manufacturing Inventory MoM (Oct)

--

F: --

P: --

Canada CPI YoY (Nov)

--

F: --

P: --

Canada CPI MoM (Nov)

--

F: --

P: --

Canada CPI YoY (SA) (Nov)

--

F: --

P: --

Canada Core CPI MoM (SA) (Nov)

--

F: --

P: --

Q&A with Experts
    • All
    • Chatrooms
    • Groups
    • Friends
    Connecting
    .
    .
    .
    Type here...
    Add Symbol or Code

      No matching data

      All
      Trump Updates
      Recommend
      Stocks
      Cryptocurrencies
      Central Banks
      Featured News
      • All
      • Russia-Ukraine Conflict
      • Middle East Flashpoint
      • All
      • Russia-Ukraine Conflict
      • Middle East Flashpoint
      Search
      Products

      Charts Free Forever

      Chats Q&A with Experts
      Screeners Economic Calendar Data Tools
      Membership Features
      Data Warehouse Market Trends Institutional Data Policy Rates Macro

      Market Trends

      Market Sentiment Order Book Forex Correlations

      Top Indicators

      Charts Free Forever
      Markets

      News

      News Analysis 24/7 Columns Education
      From Institutions From Analysts
      Topics Columnists

      Latest Views

      Latest Views

      Trending Topics

      Top Columnists

      Latest Update

      Signals

      Copy Rankings Latest Signals Become a signal provider AI Rating
      Contests
      Brokers

      Overview Brokers Assessment Rankings Regulators News Claims
      Broker listing Forex Brokers Comparison Tool Live Spread Comparison Scam
      Q&A Complaint Scam Alert Videos Tips to Detect Scam
      More

      Business
      Events
      Careers About Us Advertising Help Center

      White Label

      Data API

      Web Plug-ins

      Affiliate Program

      Awards Institution Evaluation IB Seminar Salon Event Exhibition
      Vietnam Thailand Singapore Dubai
      Fans Party Investment Sharing Session
      FastBull Summit BrokersView Expo
      Recent Searches
        Top Searches
          Markets
          News
          Analysis
          User
          24/7
          Economic Calendar
          Education
          Data
          • Names
          • Latest
          • Prev

          View All

          No data

          Scan to Download

          Faster Charts, Chat Faster!

          Download App
          English
          • English
          • Español
          • العربية
          • Bahasa Indonesia
          • Bahasa Melayu
          • Tiếng Việt
          • ภาษาไทย
          • Français
          • Italiano
          • Türkçe
          • Русский язык
          • 简中
          • 繁中
          Open Account
          Search
          Products
          Charts Free Forever
          Markets
          News
          Signals

          Copy Rankings Latest Signals Become a signal provider AI Rating
          Contests
          Brokers

          Overview Brokers Assessment Rankings Regulators News Claims
          Broker listing Forex Brokers Comparison Tool Live Spread Comparison Scam
          Q&A Complaint Scam Alert Videos Tips to Detect Scam
          More

          Business
          Events
          Careers About Us Advertising Help Center

          White Label

          Data API

          Web Plug-ins

          Affiliate Program

          Awards Institution Evaluation IB Seminar Salon Event Exhibition
          Vietnam Thailand Singapore Dubai
          Fans Party Investment Sharing Session
          FastBull Summit BrokersView Expo

          US Business Spending On Equipment Softening As Tariff Uncertainty Persists

          Devin

          Economic

          Summary:

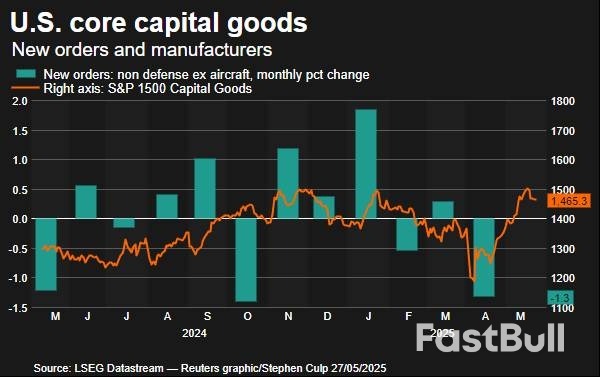
          New orders for key U.S.-manufactured capital goods plunged by the most in six months in April amid mounting uncertainty over the economy because of tariffs, suggesting business spending on equipment weakened at the start of the second quarter.

          The report from the Commerce Department on Tuesday also showed shipments of these goods falling last month. Economists said President Donald Trump's flip-flopping on import duties was making it difficult for businesses to plan ahead. That has been evident in the deterioration in sentiment among businesses.

          "I have predicted for months that business investment will be the main driver of a softer economic performance this year, as executives postpone their capital projects until they have more clarity on policy," said Stephen Stanley, chief U.S. economist at Santander U.S. Capital Markets. "These data offer the first confirming evidence of that hypothesis."

          Non-defense capital goods orders excluding aircraft, a closely watched proxy for business spending plans, tumbled 1.3% last month. That was the largest drop since last October and followed an upwardly revised 0.3% gain in March, the Commerce Department's Census Bureau said. Economists polled by Reuters had forecast these so-called core capital goods orders dipping 0.1% after a previously reported 0.2% drop in March.

          Core capital goods shipments slipped 0.1% after increasing 0.5% in March. Nondefense capital goods orders slumped 19.1%. Shipments of these goods rebounded 3.5% after falling 1.1% in March. Front-running by businesses eager to avoid higher prices from Trump's sweeping tariffs on imports contributed to business spending on equipment, mostly information processing equipment, surging at its fastest rate in 4-1/2 years in the first quarter.

          That helped to limit the drag on gross domestic product from a flood of imports. Trump has delayed higher import duties on most countries until July. The White House this month announced a deal with Beijing to slash tariffs on Chinese goods to 30% from 145% for 90 days.

          The truce in the trade war between Washington and Beijing helped to lift consumer confidence in May after deteriorating for five straight months. Consumers, however, continued to worry about tariffs raising prices and hurting the economy.

          The Conference Board's consumer confidence index increased 12.3 points to 98.0 this month, blowing past economists' expectations for an improvement to 87.0.

          But concerns about the labor market lingered, even as consumers planned to spend more over the next six months on big-ticket items such as motor vehicles and household appliances, take vacations and buy houses.

          The survey's so-called labor market differential, derived from data on respondents' views on whether jobs are plentiful or hard to get, narrowed to 13.2 from 13.7 in April. This measure correlates with the unemployment rate in the Labor Department's monthly employment report.

          Trump last week ratcheted up his trade war, proposing a 50% tariff on European Union goods starting June 1 and threatened Apple (AAPL.O), opens new tab with a 25% duty on any iPhones manufactured outside the United States. Trump at the weekend, however, backed off his threat against the EU, restoring a July 9 deadline.

          Stocks on Wall Street were trading higher. The dollar rose against a basket of currencies. U.S. Treasury yields fell.

          Core capital goods

          FRESH ROUND OF FRONT-LOADING

          Economists are anticipating a period of volatility for business spending, with the pauses in higher tariffs for Chinese and EU products seen unleashing a fresh round of front-loading. Ultimately, they expect investment to soften this year.

          Trump sees tariffs as a tool to, among other things, revive a long-declining U.S. industrial base, a feat that economists argue would be difficult to achieve in the short-term because of structural issues, including labor shortages.

          While orders for computers and electronic products rebounded 1.0% last month, bookings for communications equipment decreased 2.6%. Electrical equipment, appliances and components orders fell 0.2%. But orders for machinery increased 0.8% as did those for fabricated metal products.

          Orders for durable goods, items ranging from toasters to aircraft meant to last three years or more, dropped 6.3% last month after a slightly upwardly revised 7.6% rise in March.

          Durable goods

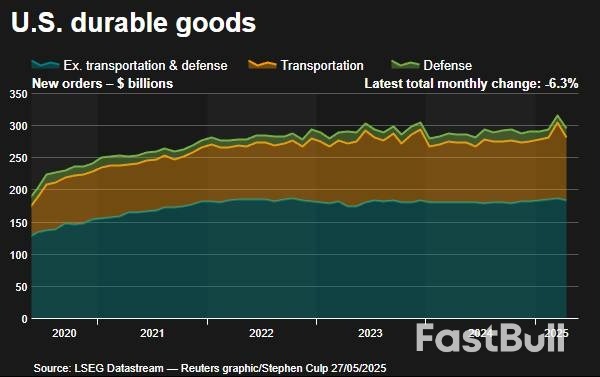
          Durable goods orders were previously reported to have jumped 7.5% in March. They were last month weighed down by a decline in orders for commercial aircraft as well as the fading boost from the tariff-related front-running.

          Boeing (BA.N), opens new tab reported on its website that it had received only eight aircraft orders in April, down from 192 in March. Orders for motor vehicles and parts decreased 2.9%.

          Overall transportation orders plummeted 17.1% after soaring 23.5% in March. The Atlanta Federal Reserve lowered its second-quarter GDP growth estimate to a 2.2% annualized rate on the data from a 2.4% pace earlier. The economy contracted at a 0.3% rate in the January-March quarter.

          Some economists expect business spending on equipment to hold up if companies more or less maintain the first quarter's robust pace of front-running of imports.

          "It is not until this import-driven boost fades later this year that we expect investment growth in that category to slow sharply," said Thomas Ryan, an economist at Capital Economics. "We expect business equipment investment to flatline in the second half of the year."

          The tariff-driven economic uncertainty and higher mortgage rates are weighing on demand for homes, resulting in a rise in supply that is curbing house price growth. New housing inventory is at levels last seen in 2007, while the supply of previously owned homes is the highest in more than four years.

          A third report from the Federal Housing Finance Agency showed house prices increased 3.7% in the 12 months through March after advancing 3.9% in February.

          "Prospects for house prices do not look strong," said Carl Weinberg, chief economist at High Frequency Economics. "A new slowing trend is emerging as the economy slows and real incomes falter."

          Source: Reuters

          To stay updated on all economic events of today, please check out our Economic calendar
          Risk Warnings and Disclaimers
          You understand and acknowledge that there is a high degree of risk involved in trading. Following any strategies or investment methods may lead to potential losses. The content on the site is provided by our contributors and analysts for information purposes only. You are solely responsible for determining whether any trading assets, securities, strategy, or any other product is suitable for investing based on your own investment objectives and financial situation.
          Add to Favorites
          Share

          Trump Media to raise $2.5 billion to buy bitcoin

          Adam

          Cryptocurrency

          Trump Media & Technology Group (DJT) is doubling down on cryptocurrency, unveiling plans Tuesday to create what it claims will be one of the largest bitcoin treasuries held by any public company.
          The initiative is backed by a $2.5 billion private funding round, with commitments from roughly 50 institutional investors, according to a company press release. The deal includes $1.5 billion in Trump Media common stock and $1 billion in convertible senior secured notes, set to close on or around May 29.
          Once finalized, the move will place bitcoin directly on Trump Media’s balance sheet, alongside existing cash, cash equivalents, and short-term investments totaling $759 million as of the end of Q1 2025.
          Shares of Trump Media, which are majority owned by the President Donald Trump, fell over 7% in early trading following the announcement. Bitcoin (BTC-USD), meanwhile, is hovering near record highs, trading around $110,000 per coin.
          Trump Media, the parent company of social media platform Truth Social, streaming service Truth+, and fintech brand Truth.Fi, said the bitcoin play is part of a broader strategy to integrate digital assets across its media and financial ecosystem.
          "We view bitcoin as an apex instrument of financial freedom, and now Trump Media will hold cryptocurrency as a crucial part of our assets," Trump Media CEO and Chairman Devin Nunes said in the release.
          Nunes called it a "big step forward" in Trump Media’s plans to transform into a diversified holding company focused on acquiring "profit-generating, crown jewel assets consistent with America First principles."
          Earlier this year, the company revealed plans to launch a bitcoin exchange-traded fund (ETF), part of a broader expansion into digital finance that includes trademark filings for a "Bitcoin Plus ETF" and other investment products. The move builds on Trump’s vocal support for cryptocurrency during his campaign, when he pledged to make the United States the "crypto capital of the planet."
          Just before taking office, his team introduced official meme coins for the 47th president (TRUMP) and First Lady Melania Trump (MELANIA) on the Solana (SOL) blockchain.

          Source: finance.yahoo

          Risk Warnings and Disclaimers
          You understand and acknowledge that there is a high degree of risk involved in trading. Following any strategies or investment methods may lead to potential losses. The content on the site is provided by our contributors and analysts for information purposes only. You are solely responsible for determining whether any trading assets, securities, strategy, or any other product is suitable for investing based on your own investment objectives and financial situation.
          Add to Favorites
          Share

          How retail investors won round one of tariff market volatility

          Adam

          Economic

          Who's the dumb money now?
          As $74 billion flowed out of equity mutual funds and ETFs in April, retail investors bought the dip and participated in the fastest snapback in the S&P 500 (^GSPC) since 1982.
          Retail investor inflows have surpassed $50 billion since April 8, according to a May 15 note from JPMorgan quantitative strategist Emma Wu. Although the pace of purchases slowed from "dip-buying weeks," Wu noted on Thursday that retail investors still bought $7.5 billion in equities over the past week.
          "I have to give retail a back-clap because they had been buying the dip all the way through," RBC Capital Markets derivatives strategist Amy Wu Silverman said on Catalysts (see video above). "It was really the institutional investor base that massively de-grossed [i.e., reduced exposure to financial markets]. So they're the ones who actually have to catch up right now."
          Data from investing platform Public indicates that investors who bought the dip between April 3 and May 9 earned a nearly 12% return. That winning streak led Bank of America's retail clients to sell stocks and take profits for the first time in 23 weeks prior to Memorial Day, according to a note from BofA senior US equity strategist Jill Carey Hall.
          Public founder and CEO Leif Abraham said the buy-the-dip strategy has become the norm, noting that "the concept of buying the dip has definitely become sort of retail investing culture."
          So what did the so-called smart money get wrong about the volatility and subsequent rally?
          Part of the reason is baked into the demands of the role, according to Silverman.
          "The pickle that an institutional investor is in ... [is] you're usually benchmarked to the S&P 500," she said. "So the S&P 500 goes up 15%, and you went up 5%. That's not great."
          It can be hard to justify fees if you're not beating the benchmark. Silverman calls this "career risk," which she said is something that isn't talked about enough.
          Retail investors benefit from a longer time horizon that institutional investors can't enjoy, since they are judged annually.
          "We miss a lot of returns," Invesco global market strategist Brian Levitt acknowledged. "Investors are still their own worst enemies."
          Levitt added that the lesson for long-term investors to stay the course in market volatility is a tale as old as time and not necessarily a strategy that indicates retail is winning.
          "Great days almost always happen near the worst days," Levitt said. "We've been through this so many times now. ... If you had told me when I graduated college in '98 that I would live through a tech wreck, a global financial crisis ... I wouldn't have thought that I would be up 12% a year in the broad US market."
          To be sure, retail or institutional buying can't protect investors from looming headwinds.
          Silverman warned investors to expect "uglier outcomes just down the road" because of how the 90-day tariff pauses were implemented.

          Source: finance.yahoo

          To stay updated on all economic events of today, please check out our Economic calendar
          Risk Warnings and Disclaimers
          You understand and acknowledge that there is a high degree of risk involved in trading. Following any strategies or investment methods may lead to potential losses. The content on the site is provided by our contributors and analysts for information purposes only. You are solely responsible for determining whether any trading assets, securities, strategy, or any other product is suitable for investing based on your own investment objectives and financial situation.
          Add to Favorites
          Share

          Wall St Rises More Than 1% As Trump Backs Down On EU Tariffs

          Thomas

          Economic

          Stocks

          Wall Street stocks climbed on Tuesday after U.S. President Donald Trump stepped back from his threat to impose 50% tariffs on the European Union, easing trade tensions and boosting sentiment as markets reopened after the Memorial Day break.

          On Sunday, Trump restored a July 9 tariff deadline to allow for talks between Washington and the 27-nation European bloc.

          He had initially threatened EU tariffs on Friday, alongside announcements of higher levies on Apple'siPhones.

          "The threat of 50% tariffs on the EU is likely a negotiation tactic to force dialogue on difficult issues such as non-tariff barriers," Glenmede analysts said in a note.

          Asian and European markets were mixed after rising on Monday, although moves in U.S. assets were more pronounced as traders returned after the long weekend.

          At 11:22 a.m. ET, the Dow Jones Industrial Averagerose 507.15 points, or 1.22%, to 42,111.45, the S&P 500gained 91.87 points, or 1.58%, to 5,894.63, and the Nasdaq Compositeadded 373.75 points, or 2.00%, to 19,110.68.

          Most megacap and growth stocks jumped with Nvidia, up 2.9%, leading gains. The AI bellwether is slated to report quarterly earnings after markets close on Wednesday.

          All 11 S&P sub-sectors moved higher, with consumer discretionaryand information technologybeing the biggest gainers.

          Long-dated U.S. Treasury yields dipped, while those on the 30-year note (US30YT=RR) were set for their biggest one-day fall since mid-April, mimicking a steep price rally in longer-term Japanese debt.

          In economic data, minutes from the U.S. Federal Reserve's last policy meeting are scheduled for release on Wednesday.

          An index tracking consumer confidence rose to 98 in May, a Conference Board report showed. Economists polled by Reuters had expected the index to stand at 87.

          A number of Fed officials are expected to speak through the week. Minneapolis Fed President Neel Kashkari on Tuesday called for holding interest rates steady until the impact of higher tariffs on inflation became clear.

          Personal Consumption Expenditure data - the Fed's favored inflation indicator - for May as well as a second estimate of first-quarter GDP are also scheduled to be released later this week.

          Wall Street witnessed sharp weekly losses on Friday as worries about mounting U.S. debt and Trump's latest trade policy shakeup sparked a broad selloff. His sweeping tax bill - which is expected to substantially expand federal debt - won a crucial House vote last Thursday.

          Equities have witnessed immense volatility since the start of the year, with the S&P 500 falling almost 19% in April from its February record highs. However, the benchmark is now about 4% away from its highs as easing trade concerns and tame inflation data spurred a risk-on rally.

          Temu-parent PDD Holdingsdropped 15.3% after reporting a 47% fall in first-quarter profit and missed quarterly revenue estimates.

          Advancing issues outnumbered decliners by a 5.38-to-1 ratio on the NYSE and by a 2.95-to-1 ratio on the Nasdaq.

          The S&P 500 posted 18 new 52-week highs and no new lows, while the Nasdaq Composite recorded 73 new highs and 41 new lows.

          Source: TradingView

          To stay updated on all economic events of today, please check out our Economic calendar
          Risk Warnings and Disclaimers
          You understand and acknowledge that there is a high degree of risk involved in trading. Following any strategies or investment methods may lead to potential losses. The content on the site is provided by our contributors and analysts for information purposes only. You are solely responsible for determining whether any trading assets, securities, strategy, or any other product is suitable for investing based on your own investment objectives and financial situation.
          Add to Favorites
          Share

          Oil prices edge lower ahead of OPEC+ meeting

          Adam

          Commodity

          Oil prices eased on Tuesday, on expectations OPEC+ will decide to increase output at a meeting later this week, while a decrease in trade tensions provided some support.
          Brent crude futures were down 31 cents, or 0.5%, at $64.42 a barrel by 1341 GMT. U.S. West Texas Intermediate crude fell 30 cents, or around 0.5%, to $61.23 a barrel.
          The Organization of the Petroleum Exporting Countries and its allies, known as OPEC+, is not expected to change policy at a meeting on Wednesday.
          However, another meeting on Saturday is likely to agree to a further accelerated oil output hike for July, three delegates from the group told Reuters.
          To an extant, the oil supply increase had also been priced in, said SEB analyst Ole Hvalbye.
          UBS analyst Giovanni Staunovo said the upside remains limited until it is clear what OPEC+ will decide on Saturday, although he said easing trade concerns were supportive.
          U.S. President Donald Trump's decision to extend trade talks with the European Union until July 9 alleviated immediate fears of tariffs that could suppress fuel demand.
          Uncertainty over whether a deal can be reached between Iran and the United States added to a more bullish mood.
          If nuclear talks between the U.S. and Iran fail, it could mean continued sanctions on Iran, which would limit Iranian oil supply.
          Iranian President Masoud Pezeshkian said on Monday that Iran would be able to survive if negotiations with the U.S. over its nuclear programme fail to secure a deal.

          source :Reuters

          Risk Warnings and Disclaimers
          You understand and acknowledge that there is a high degree of risk involved in trading. Following any strategies or investment methods may lead to potential losses. The content on the site is provided by our contributors and analysts for information purposes only. You are solely responsible for determining whether any trading assets, securities, strategy, or any other product is suitable for investing based on your own investment objectives and financial situation.
          Add to Favorites
          Share

          Natural Gas Price Analysis – Natural Gas Bounces to Show Signs of Life After Drop

          Adam

          Commodity

          Natural Gas Technical Analysis

          Natural gas markets have plunged during early trading on Tuesday, only to turn around and show signs of life as the market has been very choppy. Keep in mind that this time of year is typically very bearish for natural gas as temperatures rise in places like New York, Boston, Frankfurt, London, some of your bigger cities around the world that consume natural gas and use it for heat. So, as that catalyst peels off for the year, you typically see downward pressure. There is a little blip where we refill the storage tanks in the United States, which I believe just happened.
          So now the question is, where do we go from here? There are concerns about a recession, although that’s looking less likely. So that might keep natural gas a little bit elevated. Nonetheless, I am more bearish than bullish. So, I do look for signs of exhaustion to sell into on shorter term charts. In the short term though, I think we are going to continue to dance around the 200 day EMA as well as the 50 day EMA, ultimately finding a reason to fall apart and go looking to the $3 level.
          Anything below $2.80 opens up a trap door towards the $2 area. I don’t have a scenario in which I’m buying natural gas at the moment, unless of course something changes completely. Some of the tensions between Russia and the West continue to keep the market somewhat afloat, but keep in mind that the demand is starting to drop off, so I think that is somewhat counterbalanced at the moment.
          Unless there is an external factor to really drive down the supply of natural gas or increase the demand, I think it still needs to prove itself on rallies, and at the first signs of hesitation, I’m willing to get short. This will probably be more of a choppy run lower than we had seen in the past few months, and quite frankly, multiple years preceding.

          Source: fxempire

          Risk Warnings and Disclaimers
          You understand and acknowledge that there is a high degree of risk involved in trading. Following any strategies or investment methods may lead to potential losses. The content on the site is provided by our contributors and analysts for information purposes only. You are solely responsible for determining whether any trading assets, securities, strategy, or any other product is suitable for investing based on your own investment objectives and financial situation.
          Add to Favorites
          Share

          Is XRP Price Going to Crash Again?

          Warren Takunda

          Cryptocurrency

          Key points:
          XRP derivatives markets turn bearish amid reducing institutional demand, suggesting further downside for XRP price.
          XRP’s descending triangle breakout could lead to a decline toward $1.96.
          XRP has rebounded by more than 45% since April 7 lows to trade at $2.31 on May 27. But the price remains 31% below its January 2025 peak of $3.40, raising concerns about XRP’s ability to rise higher.
          Will XRP’s price drop from the current levels in the coming days?

          XRP derivatives data lean bearish

          One of the clearest signs that there could be trouble ahead for XRP is the presence of neutral funding rates and decreasing open interest (OI) in its futures markets.
          Funding rates are periodic payments made between long and short traders in perpetual futures contracts to keep prices aligned with the spot market.
          When neutral, it indicates a balance between long and short positions, reflecting a lack of strong directional bias among traders.
          XRP funding rates have hovered around 0% since February, indicating that traders are ambivalent. This could lead to continued price consolidation or sideways movement as the market lacks a clear catalyst for a breakout.Is XRP Price Going to Crash Again?_1

          XRP perpetual futures funding rates across all exchanges. Source: Glassnode

          Meanwhile, XRP’s OI in the futures market has dropped to $3.2 billion, down 9.6% from its three-month peak of $3.52 billion on May 13. Is XRP Price Going to Crash Again?_2

          XRP futures open interest. Source: Glassnode

          Historically, assets with declining open interest struggle to maintain upward momentum, as there’s insufficient capital and enthusiasm to drive prices higher.
          For XRP, this could mean that even minor selling pressure might trigger a cascade of liquidations, especially if leveraged positions are unwound.
          Without renewed interest from institutional or retail traders, XRP’s price risks sliding back into a downward spiral.

          Investors de-risk from XRP investment products

          Institutional demand for XRP investment products appears to be waning, according to data from CoinShares.
          XRP exchange-traded products (ETPs) posted the largest weekly outflow of $37.2 million, breaking an impressive 80-week inflow streak. This brought month-to-date outflows to $28.6 million.Is XRP Price Going to Crash Again?_3

          Flows into crypto investment products. Source: CoinShares

          While CoinShares did not highlight any reasons why XRP-related products experienced the largest outflows, other top-cap cryptocurrencies such as Bitcoin, Ether and Solana recorded significant net inflows of $2.9 billion, $326 million and $4.3 million, respectively.
          This indicates a decreased institutional appetite for XRP investment products, a negative catalyst for the XRP price.

          XRP descending triangle hints at 16% price drop

          The XRP price chart has been forming a descending triangle pattern on its four-hour chart since May 14, characterized by a flat support level and a downward-sloping resistance line.
          A descending triangle is a chart pattern that forms after a sharp uptrend is seen as a bearish reversal indicator. As a rule, the pattern resolves when the price breaks below the flat support level and falls by as much as the triangle’s maximum height.Is XRP Price Going to Crash Again?_4

          XRP/USD daily chart. Source: Cointelegraph/TradingView

          The bulls are struggling to keep XRP above the 200-day simple moving average (SMA), currently at $2.18, signaling a lack of strength.
          If this trend continues, a close below the 200-day SMA at $2.31 could sink the XRP/USDT pair toward the triangle’s support line at $2.28.
          If this support fails, XRP price could tumble toward the downside target at around $1.96 by the end of May, down 16% from current price levels.
          XRP’s descending triangle target echoes an earlier analysis that warned of a possible decline to as low as $1.61 if key support levels didn’t hold.
          Conversely, a clear breakout above the triangle’s resistance line at $2.35 (the 50-day SMA) would invalidate the bearish structure, putting XRP in a good position to rally toward the $3.00 psychological level.

          Source: Cointelegraph

          Risk Warnings and Disclaimers
          You understand and acknowledge that there is a high degree of risk involved in trading. Following any strategies or investment methods may lead to potential losses. The content on the site is provided by our contributors and analysts for information purposes only. You are solely responsible for determining whether any trading assets, securities, strategy, or any other product is suitable for investing based on your own investment objectives and financial situation.
          Add to Favorites
          Share
          FastBull
          Copyright © 2025 FastBull Ltd

          728 RM B 7/F GEE LOK IND BLDG NO 34 HUNG TO RD KWUN TONG KLN HONG KONG

          TelegramInstagramTwitterfacebooklinkedin
          App Store Google Play Google Play
          Products
          Charts

          Chats

          Q&A with Experts
          Screeners
          Economic Calendar
          Data
          Tools
          Membership
          Features
          Function
          Markets
          Copy Trading
          Latest Signals
          Contests
          News
          Analysis
          24/7
          Columns
          Education
          Company
          Careers
          About Us
          Contact Us
          Advertising
          Help Center
          Feedback
          User Agreement
          Privacy Policy
          Business

          White Label

          Data API

          Web Plug-ins

          Poster Maker

          Affiliate Program

          Risk Disclosure

          The risk of loss in trading financial instruments such as stocks, FX, commodities, futures, bonds, ETFs and crypto can be substantial. You may sustain a total loss of the funds that you deposit with your broker. Therefore, you should carefully consider whether such trading is suitable for you in light of your circumstances and financial resources.

          No decision to invest should be made without thoroughly conducting due diligence by yourself or consulting with your financial advisors. Our web content might not suit you since we don't know your financial conditions and investment needs. Our financial information might have latency or contain inaccuracy, so you should be fully responsible for any of your trading and investment decisions. The company will not be responsible for your capital loss.

          Without getting permission from the website, you are not allowed to copy the website's graphics, texts, or trademarks. Intellectual property rights in the content or data incorporated into this website belong to its providers and exchange merchants.

          Not Logged In

          Log in to access more features

          FastBull Membership

          Not yet

          Purchase

          Become a signal provider
          Help Center
          Customer Service
          Dark Mode
          Price Up/Down Colors

          Log In

          Sign Up

          Position
          Layout
          Fullscreen
          Default to Chart
          The chart page opens by default when you visit fastbull.com