• Trade
  • Markets
  • Copy
  • Contests
  • News
  • 24/7
  • Calendar
  • Q&A
  • Chats
Trending
Screeners
SYMBOL
LAST
BID
ASK
HIGH
LOW
NET CHG.
%CHG.
SPREAD
SPX
S&P 500 Index
6845.35
6845.35
6845.35
6861.30
6843.63
+17.94
+ 0.26%
--
DJI
Dow Jones Industrial Average
48604.32
48604.32
48604.32
48679.14
48557.21
+146.28
+ 0.30%
--
IXIC
NASDAQ Composite Index
23238.24
23238.24
23238.24
23345.56
23229.59
+43.08
+ 0.19%
--
USDX
US Dollar Index
97.820
97.900
97.820
98.070
97.810
-0.130
-0.13%
--
EURUSD
Euro / US Dollar
1.17569
1.17576
1.17569
1.17596
1.17262
+0.00175
+ 0.15%
--
GBPUSD
Pound Sterling / US Dollar
1.33953
1.33962
1.33953
1.33971
1.33546
+0.00246
+ 0.18%
--
XAUUSD
Gold / US Dollar
4329.60
4330.01
4329.60
4350.16
4294.68
+30.21
+ 0.70%
--
WTI
Light Sweet Crude Oil
56.749
56.779
56.749
57.601
56.697
-0.484
-0.85%
--

Community Accounts

Signal Accounts
--
Profit Accounts
--
Loss Accounts
--
View More

Become a signal provider

Sell trading signals to earn additional income

View More

Guide to Copy Trading

Get started with ease and confidence

View More

Signal Accounts for Members

All Signal Accounts

Best Return
  • Best Return
  • Best P/L
  • Best MDD
Past 1W
  • Past 1W
  • Past 1M
  • Past 1Y

All Contests

  • All
  • Trump Updates
  • Recommend
  • Stocks
  • Cryptocurrencies
  • Central Banks
  • Featured News
Top News Only
Share

Ukraine's Top Negotiator: Talks With USA Have Been Constructive And Productive

Share

The Nasdaq Golden Dragon China Index Fell 0.9% In Early Trading

Share

The S&P 500 Opened 32.78 Points Higher, Or 0.48%, At 6860.19; The Dow Jones Industrial Average Opened 136.31 Points Higher, Or 0.28%, At 48594.36; And The Nasdaq Composite Opened 134.87 Points Higher, Or 0.58%, At 23330.04

Share

Miran: Goods Inflation Could Be Settling In At A Higher Level Than Was Normal Before The Pandemic, But That Will Be More Than Offset By Housing Disinflation

Share

Miran, Who Dissented In Favor Of A Larger Cut At Last Fed Meeting, Repeats Keeping Policy Too Tight Will Lead To Job Losses

Share

Miran: Does Not Think Higher Goods Inflation Is Mostly From Tariffs, But Acknowledges Does Not Have A Full Explanation For It

Share

Toronto Stock Index .GSPTSE Rises 67.16 Points, Or 0.21 Percent, To 31594.55 At Open

Share

Miran: Excluding Housing And Non-Market Based Items, Core Pce Inflation May Be Below 2.3%, “Within Noise” Of The Fed's 2% Target

Share

Polish State Assets Minister Balczun Says Jsw Needs Over USD 830 Million Financing To Keep Liquidity For A Year

Share

Miran: Prices Are “Once Again Stable” And Monetary Policy Should Reflect That

Share

Fed's Miran: Current Excess Inflation Is Not Reflective Of Underlying Supply And Demand In The Economy

Share

Portugal Treasury Puts 2026 Net Financing Needs At 13 Billion Euros, Up From 10.8 Billion In 2025

Share

Portugal Treasury Expects 2026 Net Financing Needs At 29.4 Billion Euros, Up From 25.8 Billion In 2025

Share

Bank Of America Says With Indonesia's Smelter Now Ramping Up, It Expects Aluminium Supply Growth To Accelerate To 2.6% Year On Year In 2026

Share

Bank Of America Expects A Deficit In Aluminium Next Year And Sees Prices Pushing Above $3000/T

Share

Fed Data - USA Effective Federal Funds Rate At 3.64 Percent On 12 December On $102 Billion In Trades Versus 3.64 Percent On $99 Billion On 11 December

Share

Brazil's Petrobras Says No Impact Seen On Oil, Petroleum Products Output As Workers Start Planned Strike

Share

Statement: US Travel Group Warns New Proposed Trump Administration Requirements For Foreign Tourists To Provide Social Media Histories Could Mean Millions Of People Opting Not To Visit

Share

Blackrock: Kerry White Will Become Head Of Citi Investment Management At Citi Wealth

Share

Blackrock: Rob Jasminski, Head Of Citi Investment Management, Has Joined With Team

TIME
ACT
FCST
PREV
Japan Tankan Large Non-Manufacturing Outlook Index (Q4)

A:--

F: --

P: --

Japan Tankan Large Manufacturing Outlook Index (Q4)

A:--

F: --

P: --

Japan Tankan Small Manufacturing Diffusion Index (Q4)

A:--

F: --

P: --

Japan Tankan Large Manufacturing Diffusion Index (Q4)

A:--

F: --

P: --

Japan Tankan Large-Enterprise Capital Expenditure YoY (Q4)

A:--

F: --

P: --

U.K. Rightmove House Price Index YoY (Dec)

A:--

F: --

P: --

China, Mainland Industrial Output YoY (YTD) (Nov)

A:--

F: --

P: --

China, Mainland Urban Area Unemployment Rate (Nov)

A:--

F: --

P: --

Saudi Arabia CPI YoY (Nov)

A:--

F: --

P: --

Euro Zone Industrial Output YoY (Oct)

A:--

F: --

P: --

Euro Zone Industrial Output MoM (Oct)

A:--

F: --

P: --

Canada Existing Home Sales MoM (Nov)

A:--

F: --

P: --

Canada National Economic Confidence Index

A:--

F: --

P: --

Canada New Housing Starts (Nov)

A:--

F: --

P: --
U.S. NY Fed Manufacturing Employment Index (Dec)

A:--

F: --

P: --

U.S. NY Fed Manufacturing Index (Dec)

A:--

F: --

P: --

Canada Core CPI YoY (Nov)

A:--

F: --

P: --

Canada Manufacturing Unfilled Orders MoM (Oct)

A:--

F: --

P: --

U.S. NY Fed Manufacturing Prices Received Index (Dec)

A:--

F: --

P: --

U.S. NY Fed Manufacturing New Orders Index (Dec)

A:--

F: --

P: --

Canada Manufacturing New Orders MoM (Oct)

A:--

F: --

P: --

Canada Core CPI MoM (Nov)

A:--

F: --

P: --

Canada Trimmed CPI YoY (SA) (Nov)

A:--

F: --

P: --

Canada Manufacturing Inventory MoM (Oct)

A:--

F: --

P: --

Canada CPI YoY (Nov)

A:--

F: --

P: --

Canada CPI MoM (Nov)

A:--

F: --

P: --

Canada CPI YoY (SA) (Nov)

A:--

F: --

P: --

Canada Core CPI MoM (SA) (Nov)

A:--

F: --

P: --

Canada CPI MoM (SA) (Nov)

A:--

F: --

P: --

Federal Reserve Board Governor Milan delivered a speech
U.S. NAHB Housing Market Index (Dec)

--

F: --

P: --

Australia Composite PMI Prelim (Dec)

--

F: --

P: --

Australia Services PMI Prelim (Dec)

--

F: --

P: --

Australia Manufacturing PMI Prelim (Dec)

--

F: --

P: --

Japan Manufacturing PMI Prelim (SA) (Dec)

--

F: --

P: --

U.K. 3-Month ILO Employment Change (Oct)

--

F: --

P: --

U.K. Unemployment Claimant Count (Nov)

--

F: --

P: --

U.K. Unemployment Rate (Nov)

--

F: --

P: --

U.K. 3-Month ILO Unemployment Rate (Oct)

--

F: --

P: --

U.K. Average Weekly Earnings (3-Month Average, Including Bonuses) YoY (Oct)

--

F: --

P: --

U.K. Average Weekly Earnings (3-Month Average, Excluding Bonuses) YoY (Oct)

--

F: --

P: --

France Services PMI Prelim (Dec)

--

F: --

P: --

France Composite PMI Prelim (SA) (Dec)

--

F: --

P: --

France Manufacturing PMI Prelim (Dec)

--

F: --

P: --

Germany Services PMI Prelim (SA) (Dec)

--

F: --

P: --

Germany Manufacturing PMI Prelim (SA) (Dec)

--

F: --

P: --

Germany Composite PMI Prelim (SA) (Dec)

--

F: --

P: --

Euro Zone Composite PMI Prelim (SA) (Dec)

--

F: --

P: --

Euro Zone Services PMI Prelim (SA) (Dec)

--

F: --

P: --

Euro Zone Manufacturing PMI Prelim (SA) (Dec)

--

F: --

P: --

U.K. Services PMI Prelim (Dec)

--

F: --

P: --

U.K. Manufacturing PMI Prelim (Dec)

--

F: --

P: --

U.K. Composite PMI Prelim (Dec)

--

F: --

P: --

Euro Zone ZEW Economic Sentiment Index (Dec)

--

F: --

P: --

Germany ZEW Current Conditions Index (Dec)

--

F: --

P: --

Germany ZEW Economic Sentiment Index (Dec)

--

F: --

P: --

Euro Zone Trade Balance (Not SA) (Oct)

--

F: --

P: --

Euro Zone ZEW Current Conditions Index (Dec)

--

F: --

P: --

Euro Zone Trade Balance (SA) (Oct)

--

F: --

P: --

U.S. Retail Sales MoM (Excl. Automobile) (SA) (Oct)

--

F: --

P: --

Q&A with Experts
    • All
    • Chatrooms
    • Groups
    • Friends
    Connecting
    .
    .
    .
    Type here...
    Add Symbol or Code

      No matching data

      All
      Trump Updates
      Recommend
      Stocks
      Cryptocurrencies
      Central Banks
      Featured News
      • All
      • Russia-Ukraine Conflict
      • Middle East Flashpoint
      • All
      • Russia-Ukraine Conflict
      • Middle East Flashpoint
      Search
      Products

      Charts Free Forever

      Chats Q&A with Experts
      Screeners Economic Calendar Data Tools
      Membership Features
      Data Warehouse Market Trends Institutional Data Policy Rates Macro

      Market Trends

      Market Sentiment Order Book Forex Correlations

      Top Indicators

      Charts Free Forever
      Markets

      News

      News Analysis 24/7 Columns Education
      From Institutions From Analysts
      Topics Columnists

      Latest Views

      Latest Views

      Trending Topics

      Top Columnists

      Latest Update

      Signals

      Copy Rankings Latest Signals Become a signal provider AI Rating
      Contests
      Brokers

      Overview Brokers Assessment Rankings Regulators News Claims
      Broker listing Forex Brokers Comparison Tool Live Spread Comparison Scam
      Q&A Complaint Scam Alert Videos Tips to Detect Scam
      More

      Business
      Events
      Careers About Us Advertising Help Center

      White Label

      Data API

      Web Plug-ins

      Affiliate Program

      Awards Institution Evaluation IB Seminar Salon Event Exhibition
      Vietnam Thailand Singapore Dubai
      Fans Party Investment Sharing Session
      FastBull Summit BrokersView Expo
      Recent Searches
        Top Searches
          Markets
          News
          Analysis
          User
          24/7
          Economic Calendar
          Education
          Data
          • Names
          • Latest
          • Prev

          View All

          No data

          Scan to Download

          Faster Charts, Chat Faster!

          Download App
          English
          • English
          • Español
          • العربية
          • Bahasa Indonesia
          • Bahasa Melayu
          • Tiếng Việt
          • ภาษาไทย
          • Français
          • Italiano
          • Türkçe
          • Русский язык
          • 简中
          • 繁中
          Open Account
          Search
          Products
          Charts Free Forever
          Markets
          News
          Signals

          Copy Rankings Latest Signals Become a signal provider AI Rating
          Contests
          Brokers

          Overview Brokers Assessment Rankings Regulators News Claims
          Broker listing Forex Brokers Comparison Tool Live Spread Comparison Scam
          Q&A Complaint Scam Alert Videos Tips to Detect Scam
          More

          Business
          Events
          Careers About Us Advertising Help Center

          White Label

          Data API

          Web Plug-ins

          Affiliate Program

          Awards Institution Evaluation IB Seminar Salon Event Exhibition
          Vietnam Thailand Singapore Dubai
          Fans Party Investment Sharing Session
          FastBull Summit BrokersView Expo

          UK-Based Union Jack Oil Turns to Bitcoin Mining Amid Rising Network Difficulty

          Manuel

          Cryptocurrency

          Commodity

          Summary:

          According to the firm, the move is focused on harnessing the natural gas from its West Newton site in East Yorkshire to generate electricity for powering crypto mining operations

          Union Jack Oil (UJO), a UK-listed oil and gas firm, is exploring a new path to monetize its gas resources by turning to Bitcoin mining, per an Aug. 7 statement.
          According to the firm, the move is focused on harnessing the natural gas from its West Newton site in East Yorkshire to generate electricity for powering crypto mining operations.

          Why Bitcoin mining?

          Union Jack’s Executive Chairman, David Bramhill, expressed confidence in the project’s potential, noting that the Bitcoin mining strategy could lead to the creation of a new Bitcoin Treasury strategy for the oil and gas company.
          To achieve this, the firm stated that Rathlin Energy and its joint venture partners, including Reabold Resources, have signed a non-binding letter of intent (LOI) with 360 Energy, a Texas-based firm specializing in natural gas monetization.
          The agreement outlines a strategy to install gas-powered electricity infrastructure and Bitcoin mining units directly at the production site.
          The initiative aims to use gas from the West Newton A and B wells to power onsite data centers. Speaking about these centers, Bramhill said:
          “We continue to believe that this asset holds material value which could eventually deliver significant volumes of onshore low-carbon sales gas into the UK`s important domestic natural gas market. West Newton is estimated to contain gross recoverable 2C gas resources of almost 200 billion cubic feet, according to an independent assessment undertaken by RPS in 2022.”
          These centers will run 360 Energy’s “In-Field Computing” (IFC) system, designed to convert raw gas into electricity for crypto mining.
          According to Union Jack, early production concepts like this allow them to unlock value from existing wells without waiting for full field development. If successful, the model could be replicated at other nearby discoveries.

          Mining difficulty surging

          Union Jack’s Bitcoin mining plans come at an interesting time when Bitcoin mining difficulty is rising.
          According to data from Cloverpool, Bitcoin mining difficulty is expected to surge to an all-time high of over 130 trillion on Aug. 9.
          Despite this milestone, the broader growth in mining activity appears to be decelerating.
          According to insights from Blockware, the year-to-date increase in mining difficulty stands at just 16%. If this pace holds, 2025 could register as the slowest year of mining difficulty growth in Bitcoin’s history.
          The slowdown is primarily attributed to maturing hardware capabilities, infrastructure limitations, and the growing interest of data center operators in alternative sectors like artificial intelligence.
          Blockware suggested that this deceleration in mining difficulty is ultimately bullish for Bitcoin miners, as it translates into less competition for the daily 450 BTC mined.

          Source: Cryptoslate

          Risk Warnings and Disclaimers
          You understand and acknowledge that there is a high degree of risk involved in trading. Following any strategies or investment methods may lead to potential losses. The content on the site is provided by our contributors and analysts for information purposes only. You are solely responsible for determining whether any trading assets, securities, strategy, or any other product is suitable for investing based on your own investment objectives and financial situation.
          Add to Favorites
          Share

          India isn’t flinching: Why Trump might be misreading India’s tariff playbook

          Adam

          Economic

          India’s stock market showed little sign of panic a day after the U.S. announced a 50% tariff on goods from the country and threatened secondary sanctions over its continued oil trade with Russia.
          The Sensex, the benchmark index for India’s blue-chip stocks, ended the day around 0.1% higher on Aug. 7.
          From bureaucrats to businesses, there’s a broad consensus in India that the latest escalation from the U.S. is only a pressure tactic to fast-track trade talks. However, Indian Prime Minister Narendra Modi now has something he didn’t have, even a day earlier: the support of the Indian opposition to push back.
          Rahul Gandhi, the leader of India’s largest opposition party, the Indian National Congress, described the penalty for Russian oil purchases as “economic blackmail” by Trump.
          Consequently, the Indian negotiators’ resolve may only get stronger, especially in talks over areas that directly affect the country’s farmers.
          “India will never compromise on the interests of the country’s farmers, fishermen, and livestock breeders. I know it will cost me personally, but I am ready,” Modi said on Thursday morning, hours after the U.S. increased tariffs.
          Economic impact
          By most estimates, the cost of losing trade with the U.S. is significant for India but not debilitating.
          The most pessimistic estimate is from Morgan Stanley. It says that if all goods are subject to a 50% duty, the impact on India’s gross domestic product is likely to be 60 basis points, about $23 billion at current exchange rates.
          On the other hand, the cost of allowing U.S. dairy exports into India — one of the most contentious issues— is expected to cost India 1.8 lakh crore rupees ($20 billion) alone, according to SBI Research, a unit of the country’s largest bank. A little over half of that burden will hit farmers directly in the form of falling retail prices, SBI said, unless the government compensates for the loss.
          The additional tariffs could also be catastrophic for India’s gem and jewelry companies, a spokesperson for the industry lobby told CNBC-TV18 on Thursday, while Indian seafood exporters, who sell the bulk of their produce to the U.S., may lose nearly $3 billion a year at the 25% tariff effective today, according to analysts at Morgan Stanley.
          India’s labour-intensive textile industry, meanwhile, expects $5 billion worth of business to move away from India in the next few months due to the tariffs.
          High U.S. duties will also affect India’s ability to attract foreign direct investment (FDI), according to Arvind Sanger from Geosphere Capital Management, a New York-based broker.
          India’s position is bolstered by the fact that over 60% of its GDP comes from domestic consumption, however.
          The Indian rupee will be the immediate casualty, according to Mahesh Patil, who oversees more than 3 lakh crore rupees ($35 billion) worth of financial assets at the Mumbai-based Aditya Birla Mutual Fund as its chief investment officer. However, Patil also noted that the rupee settling at lower levels against the U.S. dollar may offset some of the hit on Indian exporters, and the impact may be visible with a lag of a few months.
          About 40% of India’s entire trade with the U.S. is in services, which is not even a point of discussion so far as the U.S. exports more services to India than it imports. Trump also hasn’t paid heed to the call for curbs on the H1-B visa, which is a route mostly used by Indian nationals looking to fill talent gaps — particularly in the tech sector — in the U.S.
          India’s middle ground
          Amid Trump’s threat of secondary sanctions on India, Modi is planning his first visit to China since 2018. And, close on the heels of U.S. envoy Steve Witkoff, India’s National Security Advisor Ajit Doval is visiting Russia in an effort to pursue India’s interests through diplomacy.
          Meanwhile, India’s foreign ministry has hit out at what it calls U.S. hypocrisy in ignoring its own trade with Russia that has continued through the war in Ukraine, an allegation that Trump brushed aside but didn’t deny. It’s also important to note that Indian companies own stakes in many Russian oil fields.
          Trump’s trade advisor, Peter Navarro, has also alleged that India uses the dollars from trade with America to pay for Russian oil, however most of India’s oil trade with Russia is settled in dirhams, the currency of the United Arab Emirates (UAE), refiners have told CNBC-TV18.
          India has been a lot more willing than Brazil and China to find a middle ground with the U.S.
          The government has already reduced duties on imports of U.S. motorcycles, bourbon, ethernet switches, synthetic flavoring essences and fish hydrolysate, to name a few. It has also allowed Tesla
          to set up shop in Mumbai and withdrew the equalization levy on internet giants, widely known as the Google tax.
          India has also increased its oil purchases from the U.S. by 120% in the last six months, source in the Indian government told CNBC-TV18, which was one of Trump’s primary demands when Modi visited the White House in February 2025.
          However, since then, Trump has moved the goalposts from just reducing the U.S.′ trade deficit with India to the South Asian country’s relationship with Russia.
          Watch and wait?
          Trump has said India’s purchases of Russian oil are why it’s now facing tariffs of 50%, with this full rate due to be imposed 21 days after Trump’s executive order was signed Wednesday.
          Despite this, New Delhi’s tone and rhetoric have been milder than the statements coming from Beijing or Rio De Janeiro, but it’s also sticking to its red lines. India is keen to use the 21 days before to find a win-win situation, a government official told CNBC-TV18.
          While the Indian government hasn’t hinted at any escalation on its end, some experts believe that India has some legal options at its disposal.
          “It is important that we talk to our trading partners and like-minded countries who have been hit by similar actions by the U.S.,” Anjali Prasad, the former Indian ambassador to the World Trade Organization, said.
          “Only when we get together, decide on a strategy, will there be some action effectively possible, because there is strength in numbers.”
          The fact that Trump is due to meet Russian President Vladimir Putin in the coming days, meanwhile, shows that the U.S.′ priority is to end Russia’s war on Ukraine.
          If there’s a breakthrough in talks between Trump, Putin, and Ukrainian President Volodymyr Zelenskyy, India’s oil purchases from Russia might no longer be a problem.
          The incentive for India to watch and wait, instead of rushing with concessions, is right there.

          Source: cnbc

          To stay updated on all economic events of today, please check out our Economic calendar
          Risk Warnings and Disclaimers
          You understand and acknowledge that there is a high degree of risk involved in trading. Following any strategies or investment methods may lead to potential losses. The content on the site is provided by our contributors and analysts for information purposes only. You are solely responsible for determining whether any trading assets, securities, strategy, or any other product is suitable for investing based on your own investment objectives and financial situation.
          Add to Favorites
          Share

          Why the oil market believes Trump will back down from tariffs on Russian crude buyers

          Adam

          Commodity

          The oil market is shrugging off President Donald Trump’s threats to impose heavy tariffs on countries that buy Russian energy exports.
          Trump has given Russia until Friday to agree to a ceasefire in Ukraine. If Moscow does not comply, the U.S. will impose 100% “secondary tariffs” on countries that buy Russian exports, the president has said. This would in theory force countries to choose between buying Russian oil or trading with the U.S.
          India, China and Turkey are the most exposed as the three biggest importers of Russian oil. Trump on Wednesday targeted India with a 25% tariff for buying Russian crude, a much lower rate than the 100% penalty he originally threatened. Oil prices closed 1% lower as traders seem to believe the president is bluffing and the tariff won’t really go into effect.
          “Given the price response to the news, it would appear that current threats are considered a negotiation tactic by Trump and little more,” Matt Smith, an oil analyst at Kpler, told CNBC.
          India is Russia’s biggest oil customer, importing about 1.7 million barrels per day, according to Kpler data. If Trump follows through on the tariff, oil prices would jump because barrels that Russia exports to India cannot be easily rerouted to other destinations, Smith said. Moscow would have to shut in some production, which would take supply out of the global market, he said.
          But the market senses right now that Trump is going to back down, said Bob McNally, president of Rapidan Energy. The additional tariff against India does not go into effect for 21 days, providing time for the countries to reach an agreement.
          “Traders believe that there will be a deal, that it really won’t go into effect,” McNally said of the tariff. “And if it did, India would probably just pay the tariffs and keep importing Russian oil,” he said of traders’ thinking.
          The Trump administration has not always backed up its words with actions when it comes to energy sanctions, said Helima Croft, head of global commodity strategy at RBC Capital Markets, in a note to clients. Iran’s oil exports, for example, remain elevated despite declarations from the White House that it is imposing a maximum pressure campaign, Croft said.
          “Our base case is that Russia will resist making serious concessions, believing that President Trump will blink at imposing measures that could push energy prices materially higher and that the White House’s newfound support for Ukraine will dissipate,” Croft told clients in the July 30 note.
          Steep tariffs on Russian oil buyers would jeopardize Trump’s push to reduce energy prices. The president said last month that he wants U.S. crude prices to fall below $64 per barrel. In an interview with CNBC Tuesday, the president said low oil prices would force Russia to end its war in Ukraine.
          “If you sanction hard enough that Russia can’t sell its oil, prices at the pump will soar — that’s just the barrel math,” McNally said.
          Trump seemed to acknowledge Wednesday that there would not be ceasefire by his deadline. He said his special envoy Steve Witkoff “had a highly productive meeting with Russian President Vladimir Putin.”
          “Everyone agrees this War must come to a close, and we will work towards that in the days and weeks to come,” Trump said in a post on Truth Social.
          Trump and Putin have agreed in principle to meet in the coming days, according to the Kremlin. If Putin refuses to make concessions, Trump will likely continue down the road of energy sanctions, McNally said. This includes targeting big importers of Russian oil, namely China.
          “He will have to go gingerly because of the blowback risk in terms of higher oil prices,” McNally said. “He has to do so in a way that isn’t counterproductive and that’s a tricky problem to solve.”

          Source: cnbc

          Risk Warnings and Disclaimers
          You understand and acknowledge that there is a high degree of risk involved in trading. Following any strategies or investment methods may lead to potential losses. The content on the site is provided by our contributors and analysts for information purposes only. You are solely responsible for determining whether any trading assets, securities, strategy, or any other product is suitable for investing based on your own investment objectives and financial situation.
          Add to Favorites
          Share

          Waller Emerges as Favorite for Fed Chair Among Trump Team

          Manuel

          Central Bank

          Political

          Federal Reserve Governor Christopher Waller is emerging as a top candidate to serve as the central bank’s chair among President Donald Trump’s advisers as they look for a replacement for Jerome Powell, according to people familiar with the matter.
          Trump advisers are impressed with Waller’s willingness to move on policy based on forecasting, rather than current data, and his deep knowledge of the Fed system as a whole, the people said. Waller has met with the president’s team about the role, but has yet to meet with Trump himself, the people said on the condition of anonymity to discuss private deliberations.
          Kevin Warsh, a former Fed official, and Kevin Hassett, currently Trump’s National Economic Council director, also remain in contention for the job, the people said, which will open up when Powell’s tenure as chair expires in May 2026.
          “President Trump will continue to nominate the most competent and experienced individuals,” White House Spokesman Kush Desai said in a statement. “Unless it comes from President Trump himself, however, any discussion about personnel decisions should be regarded as pure speculation.”
          A representative for the Fed declined to comment.
          “I think that Governor Waller has really built up a really impressive track record in the last two years at the Fed with his predictions about inflation, and with his predictions about where Fed policy needed to move to respond to that inflation,” Stephen Miran, who chairs the White House Council of Economic Advisers, said in an interview with Bloomberg Television Thursday.
          Trump said on Wednesday that the administration has narrowed the list of candidates for Fed chair to three people. Treasury Secretary Scott Bessent, Vice President JD Vance and Commerce Secretary Howard Lutnick are on the search committee, Trump said.
          Hassett has met with Trump to discuss the chair job and has also impressed both the president and the team, Bloomberg News has reported. Warsh interviewed for the job in 2017 but was ultimately passed over for Powell. In November, he was also considered to serve as Treasury secretary.
          The search for a new Fed chair is happening simultaneously with talks to fill a soon-to-be vacant slot from Adriana Kugler’s early departure from the Fed board. Trump said he planned to fill that seat with a temporary governor, who would serve for just a handful of months.
          Later, he will name a candidate for a 14-year Fed governor term which opens up in early 2026. Trump is likely to appoint someone to that seat who has stated a preference for lower interest rates.
          Last week, Waller was one of two Fed board members to vote against the central bank’s decision to hold its benchmark rate steady for a fifth consecutive time. He and his colleague Michelle Bowman, both Trump nominees, preferred a quarter-point reduction, citing growing signs of labor-market weakness.
          A few days after the Fed announced its decision to hold interest rates, a jobs report showed that job growth cooled sharply over the previous three months, lending credence to Waller and Bowman’s dissent.
          Waller’s views differed from those of Powell and other policymakers on the board, who have so far described the labor market as broadly solid and have supported a patient approach to adjusting rates so that the central bank can continue to gauge how Trump’s tariffs will impact the economy. That view has frustrated the president, who has repeatedly assailed Powell for not cutting rates sooner.
          Waller, a Ph.D. economist, has attracted the attention of Trump’s economic advisers over the past year as the president talked about the economy while on the campaign trail.

          Fed Experience

          Trump nominated Waller to the Fed in 2020. Before that, he had served as a research director and executive vice president at the St. Louis Fed. In 2020, senators voted 48-47 to support Waller’s nomination to the Fed board.
          As a Fed governor in 2022, Waller engaged in a public debate with influential economists outside the Fed, including former Treasury Secretary Larry Summers, with his argument that the central bank could successfully lower the post-pandemic inflation without significantly raising unemployment. In the end, Waller proved right as inflation came back below 3% and unemployment never moved back above 4.2%.
          Trump’s dissatisfaction with Powell has triggered questions about whether his next pick to lead the Fed would back monetary policy independence for the central bank. Waller said in April that the Fed’s independence is “critical to the well-functioning of the US economy.”
          He noted that markets, Fed watchers and consumers all criticize the chair.
          “If you don’t like being criticized, don’t take the job,” Waller said. “The president is free to say what he wants to on policy, just like anybody else.”
          Last month, Waller told Bloomberg Television that he hasn’t yet directly heard from the president about the Fed chair role.
          “If the president contacted me and said, ‘I want you to serve,’ I would do it,” he said in July. “But he has not contacted me.”

          Source: Bloomberg

          Risk Warnings and Disclaimers
          You understand and acknowledge that there is a high degree of risk involved in trading. Following any strategies or investment methods may lead to potential losses. The content on the site is provided by our contributors and analysts for information purposes only. You are solely responsible for determining whether any trading assets, securities, strategy, or any other product is suitable for investing based on your own investment objectives and financial situation.
          Add to Favorites
          Share

          Gold, silver gain on central banks buying gold, bullish charts

          Adam

          Commodity

          Gold and silver prices are higher and hit two-week highs in midday U.S. trading Thursday. News that China’s central bank continues to add to its gold reserves and more-bullish near-term technical postures in both gold and silver recently are boosting both metals today. December gold was last up $17.70 at $3,451.00. September silver prices were last up $0.438 at $38.34.
          The People’s Bank of China increased its gold reserves in July, marking nine straight months of purchases that are helping it diversify its holdings away from U.S. dollars. Bloomberg reported gold held by the central bank increased by 60,000 troy ounces, to 73.96 million troy ounces last month. This brings the total of purchases since last November to around 36 tons. Buying by central banks, including China’s, is among the key drivers of the 30% rally that gold has seen this year. While the central bank buying spree is expected to continue, the pace has slowed amid elevated gold prices.
          The key outside markets today see the U.S. dollar index firmer. Nymex crude oil futures are slightly lower and trading around $64.25 a barrel. The yield on the benchmark 10-year U.S. Treasury note is presently 4.233%.
          Gold, silver gain on central banks buying gold, bullish charts_1
          Technically, December gold futures bulls have the firm overall near-term technical advantage. Bulls’ next upside price objective is to produce a close above solid resistance at the July high of $3,509.00. Bears' next near-term downside price objective is pushing futures prices below solid technical support at the July low of $3,319.20. First resistance is seen at today’s high of $3,470.30 and then at $3,500.00. First support is seen at the overnight low of $3,430.00 and then at $3,400.00. Wyckoff's Market Rating: 7.0.
          Gold, silver gain on central banks buying gold, bullish charts_2
          September silver futures bulls have the overall near-term technical advantage and have regained momentum. Silver bulls' next upside price objective is closing prices above solid technical resistance at the July high of $39.91. The next downside price objective for the bears is closing prices below solid support at the July low of $36.28. First resistance is seen at the overnight high of $38.76 and then at $39.00. Next support is seen at $38.00 and then at $37.50. Wyckoff's Market Rating: 7.0.

          Source: kitco

          Risk Warnings and Disclaimers
          You understand and acknowledge that there is a high degree of risk involved in trading. Following any strategies or investment methods may lead to potential losses. The content on the site is provided by our contributors and analysts for information purposes only. You are solely responsible for determining whether any trading assets, securities, strategy, or any other product is suitable for investing based on your own investment objectives and financial situation.
          Add to Favorites
          Share

          Trump Approval Rating Still Negative While The Public Sours Further On Democrats

          Owen Li

          Economic

          Political

          President Donald Trump's overall and economic approval ratings remain in negative territory despite a slight improvement in the latest CNBC All-America Economic Survey.

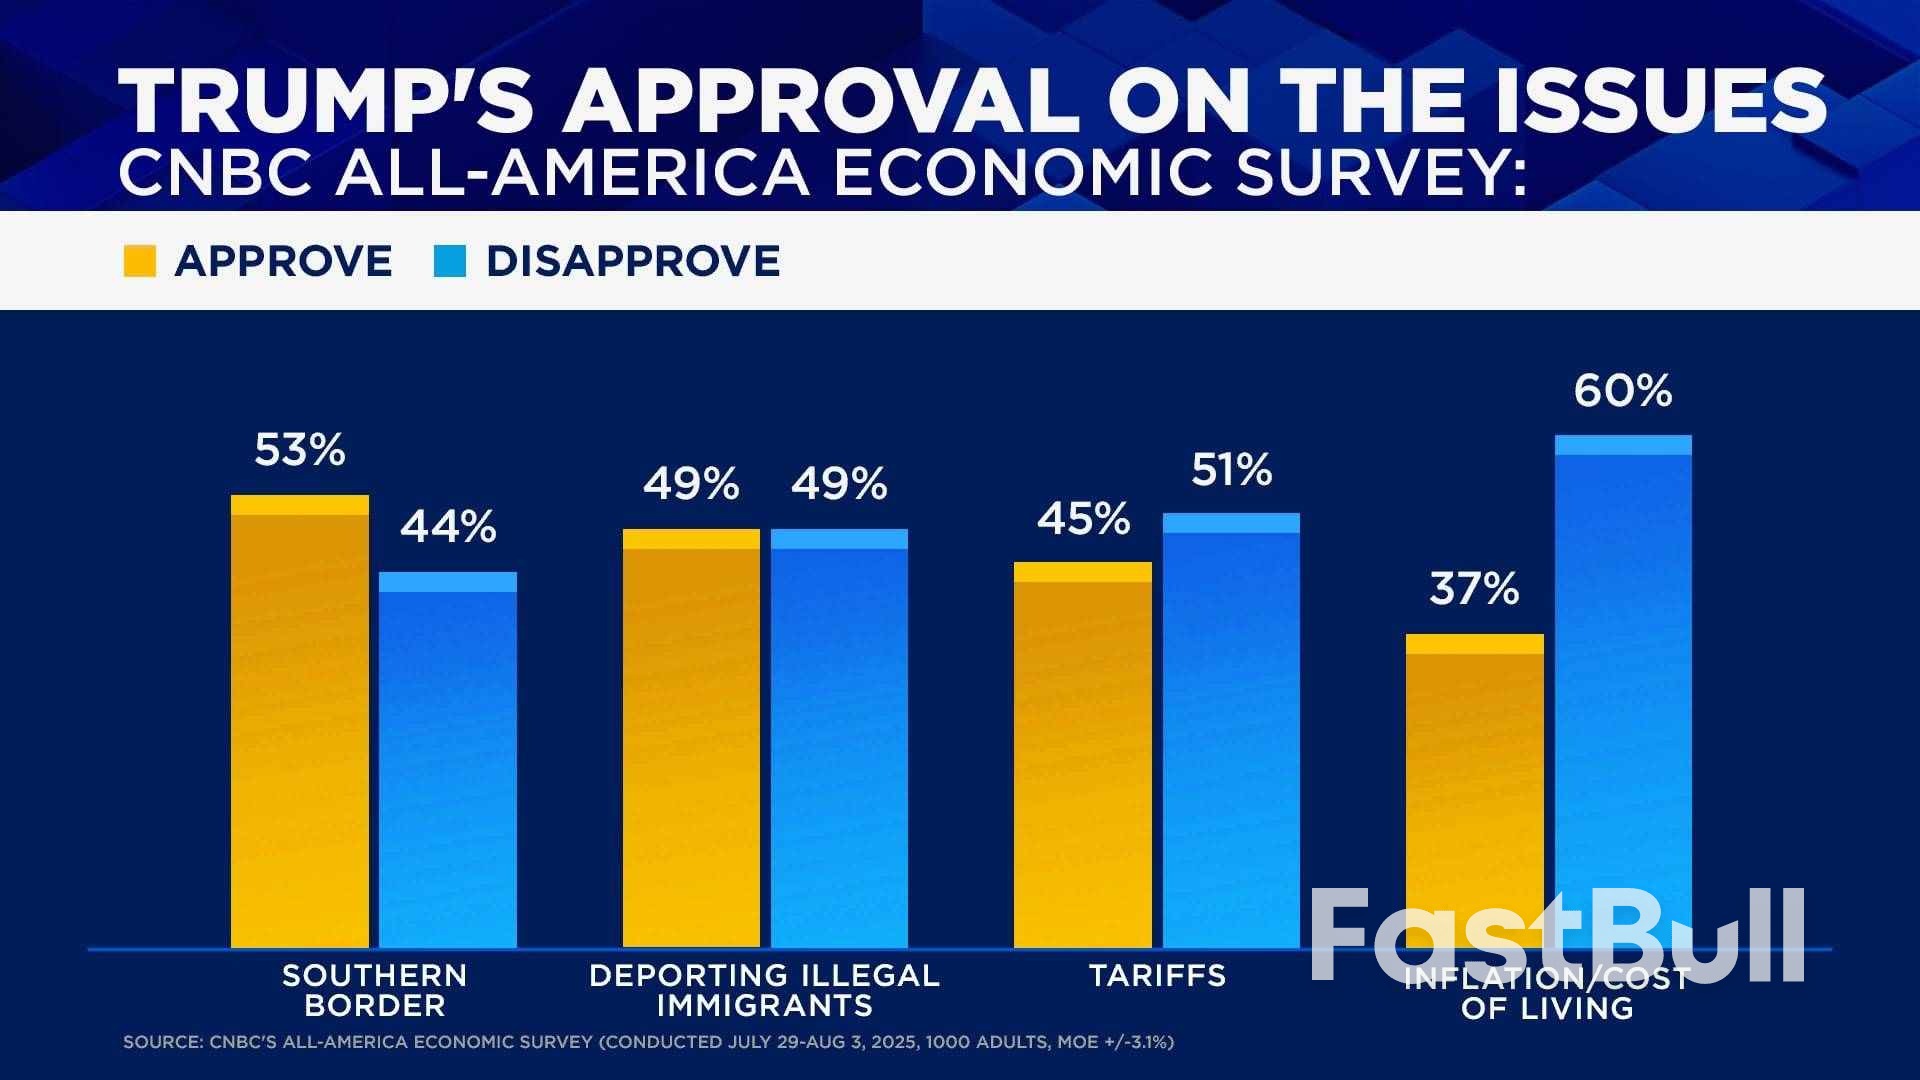
          More troubling for the president, however, could be that the survey shows positive approval of only one of seven key issues, with the public holding negative views on his handling of tariffs, inflation, taxes and federal spending.

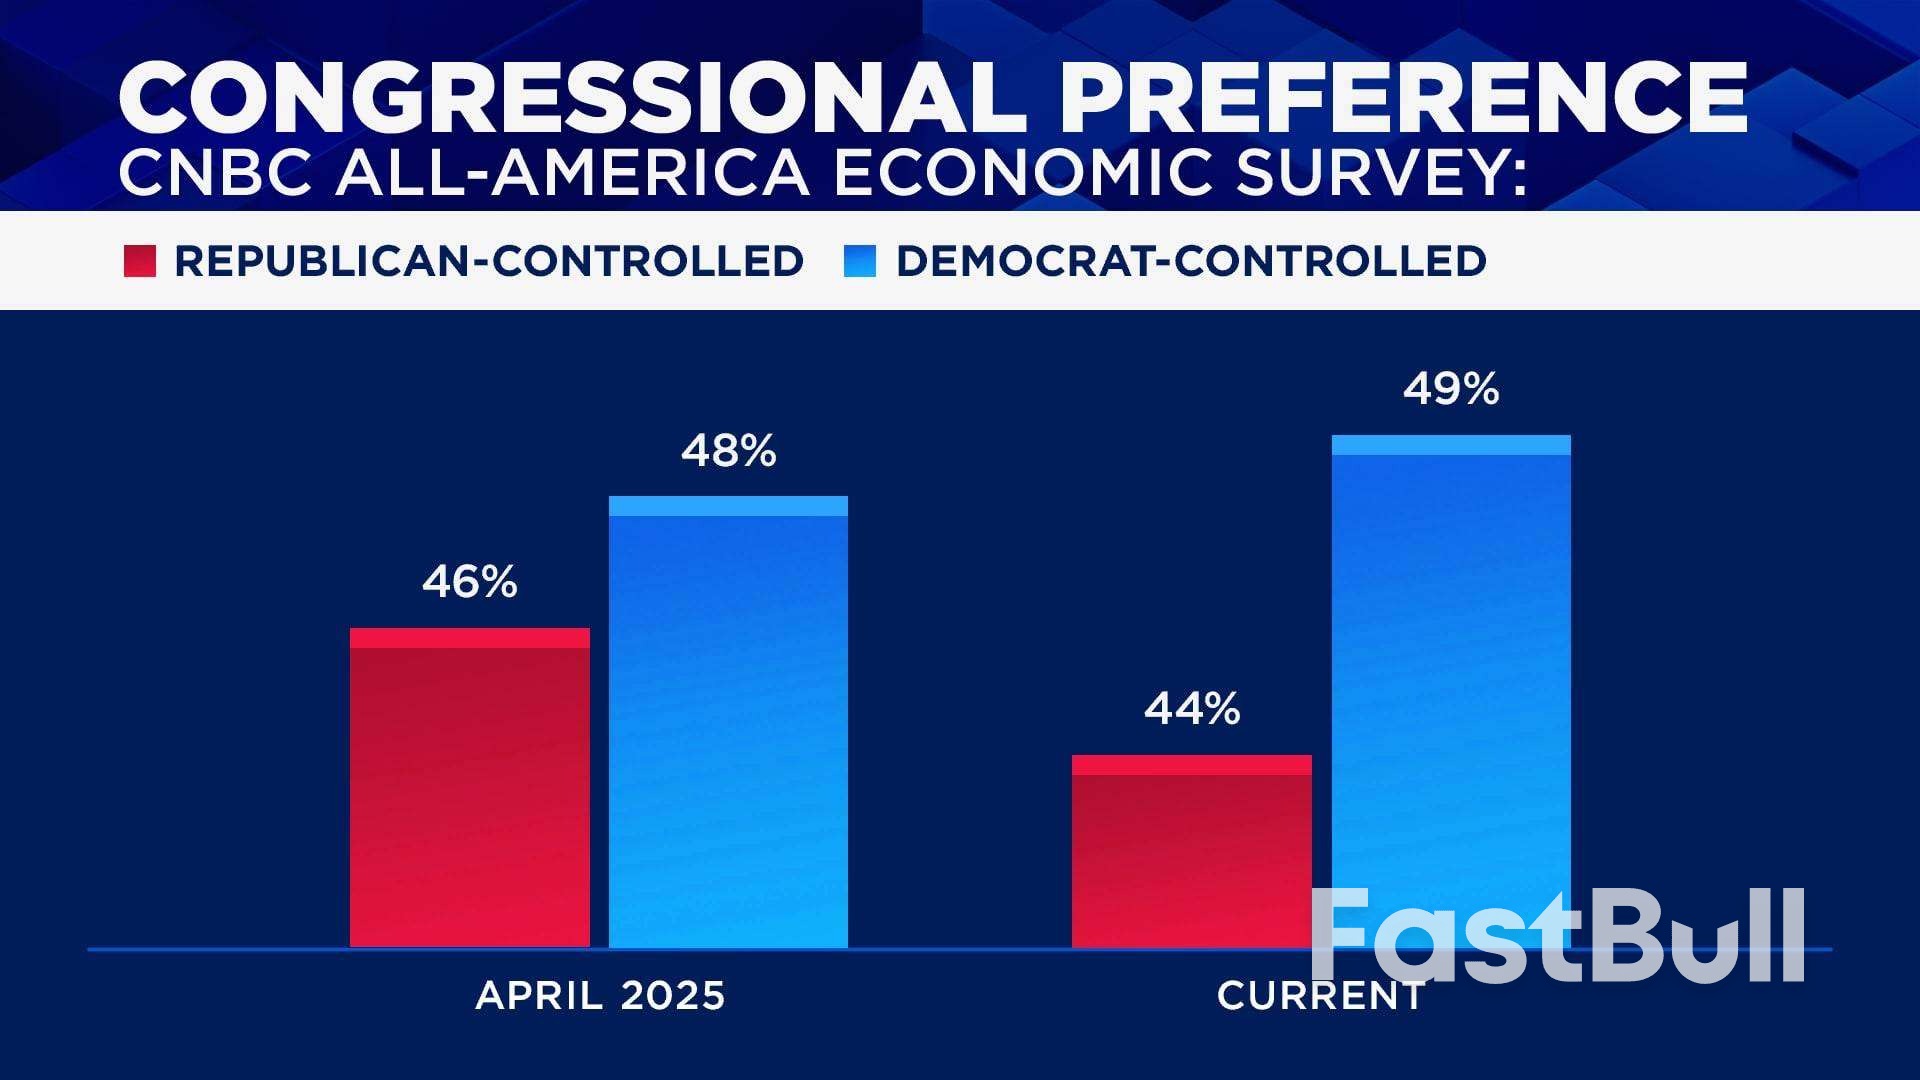
          There also was a modest rise in the public's preference for the Democrats to control Congress, rising to a 49%-44% advantage from 48%-46% in April. It was the largest lead for Democrats since 2021.

          At the same time, favorability of the Democratic party among registered voters sank to a net -32 percentage points, with 24% positive and 56% negative. The -32 rating appeared to be the lowest rating for either party going back to at least 1996.

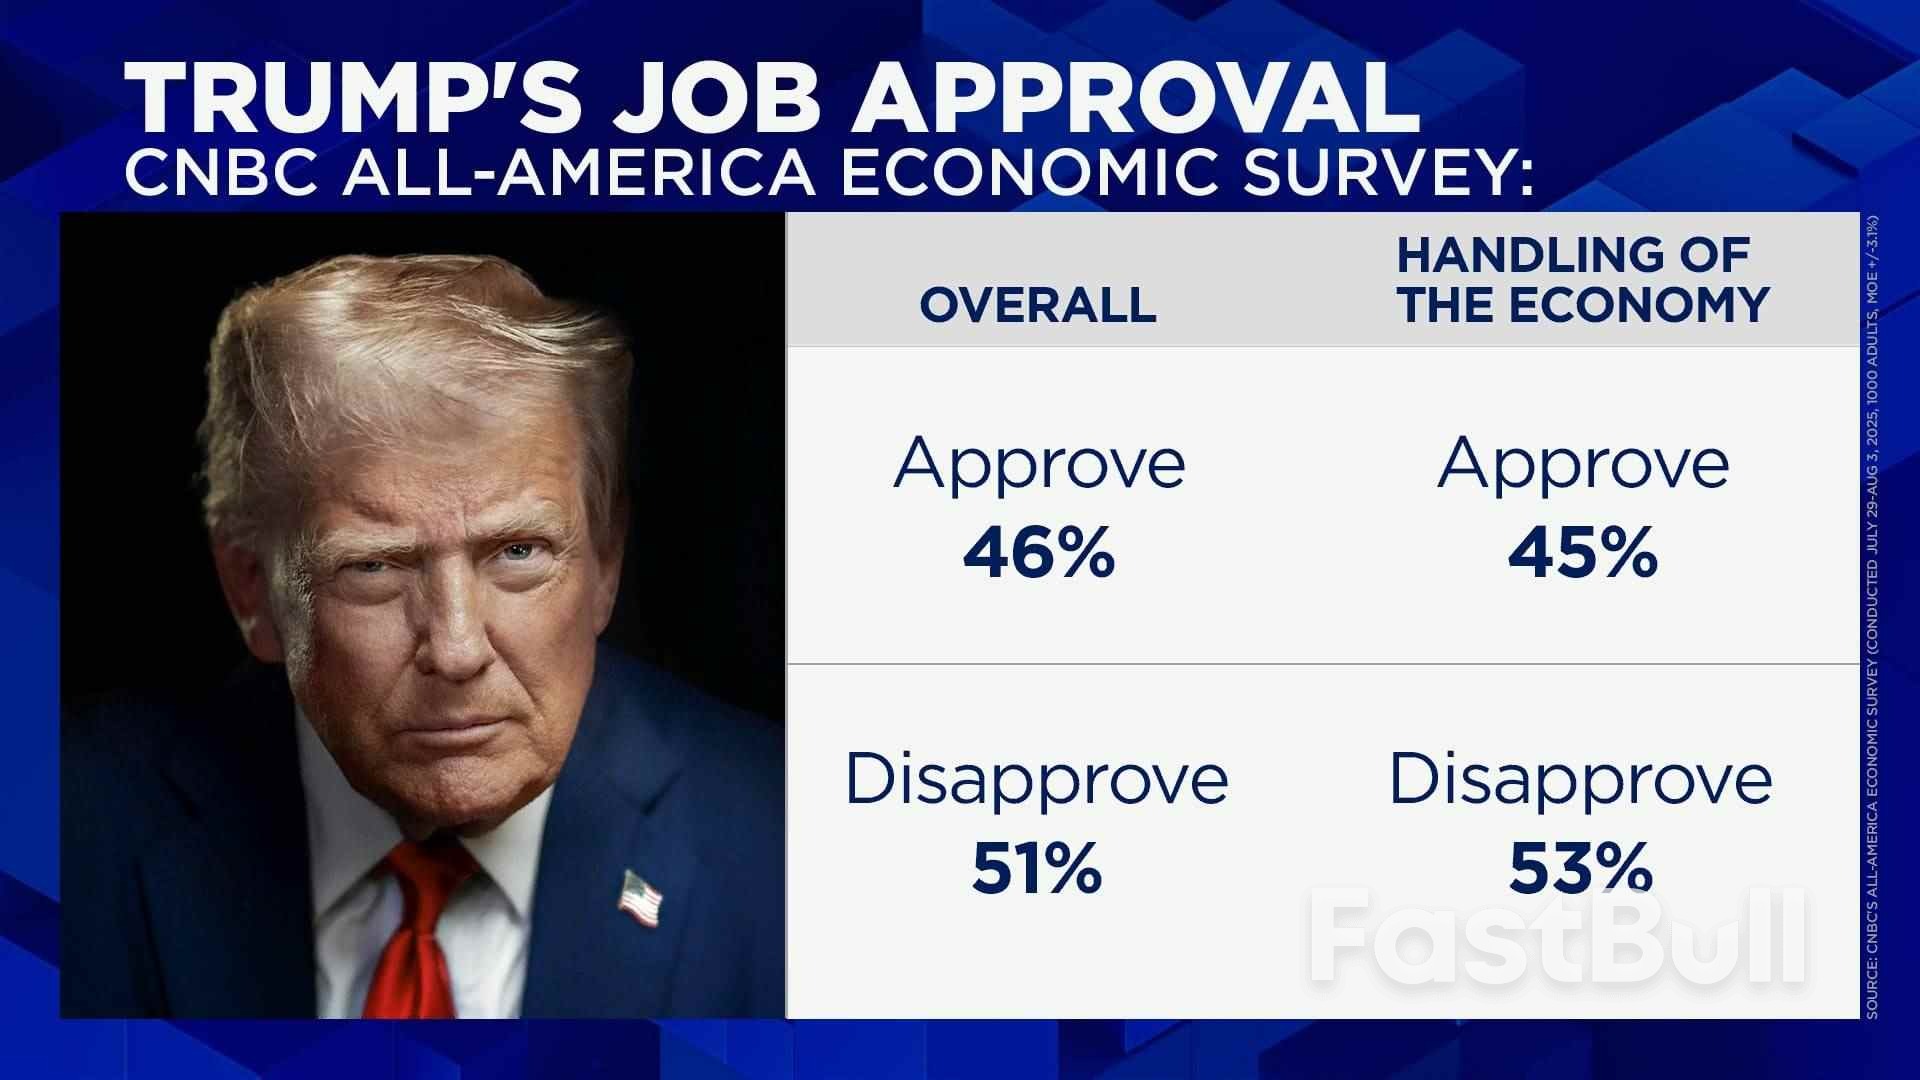
          The public disapproves of the job Trump is doing as president by a 51%-46% margin, up from 51%-44% in the April survey. The change is within the survey's +/-3.1 percentage point margin of error as is the gap in his approval rating.

          The president's economic approval rating remains negative with 45% approving and 53% disapproving, a modest gain from 43%-55% in April. But it's the second time in a row that his economic approval was worse than his overall approval, a reversal from his first term when the president was always stronger on the economy.

          "What seemed to be keeping President Trump's overall approval level from really dropping down was the strong economy and the credit that he got from the public," said Jay Campbell, partner at Hart Research, the survey's Democratic pollster. "He cannot rely on that at this point."

          Overall, the survey of 1,000 people nationwide conducted July 29-Aug 3 showed a series of conflicting political and economic crosscurrents, with individuals and demographic groups offering sometimes contradictory opinions.

          "Trump's approval is stable, but his individual ratings are down on issue after issue, except for tariffs," said Micah Roberts, partner with Public Opinion Strategies, which conducted the poll and served as its Republican pollster. "Economic optimism is higher, but there's been no relief in this data from inflation."

          For example, just 39% of Independents approve of the president's handling of the economy, and that drops to 24% on inflation. Even Republicans are 9 points lower on inflation than their economic approval rating.

          The president is underwater on inflation by 23 points, with 37% approving and 60% disapproving, unchanged from the last survey. The conflicts could be the result of the public simply having trouble keeping up with the breakneck changes to the economy, immigration, taxation and the political system issuing from the Trump administration.

          Party-line split on Trump

          But Republicans remain solidly behind the president and Democrats solidly against. Half of Independents disapprove of the president, with 36% approving.

          Roberts added that the survey is "capturing a country that's in a shifting moment across all of these issues."

          Views on the economy are equally conflicting.

          On the current state of the economy, attitudes have improved, with 31% saying it's excellent or good and 68% calling it just fair or poor. Those are the best numbers since the early years of the Biden administration as the nation emerged from the pandemic, and an 11-point improvement from the CNBC survey in April.

          The move was driven largely by growing optimism among Republicans, with some improvement among Independents. But the outlook for the economy barely budged, with 36% saying it will get better, 17% saying it will stay the same, and 46% expecting it to get worse.

          Republicans became a bit less optimistic and Independents somewhat less pessimistic.

          Views on the stock market also improved with 46% saying it's a good time to invest and 42% saying it's a bad time. The sharp improvement to +4 percentage points from -15 percentage points has come with a surge in stocks that followed the president backing off in from sweeping reciprocal tariffs and the passage of tax legislation.

          Even 36% of those with no investments think it's a good time invest, the highest on record for a group that is typically negative on stocks.

          Views on other matters

          But the survey shows some gathering areas of concern for the president on key issues.

          Approval on measures taken to secure the southern border is the only one of seven that is above water with a 53% to 44% positive approval rating. The public is evenly split on deportations 49% to 49%, with sharp divides by party, age, race, gender, geography, income and education.

          There are even splits within parties.

          For example, 98% of MAGA Republicans, who represent 26% of the party, approve of the deportations, compared with 61% of non-MAGA Republicans. That compares with 97% of liberal Democrats disapproving of Trump's deportations and 78% of moderate Democrats.

          There also is unambiguous disapproval of the President's foreign policy (-14 points), federal spending (-19 points), taxes (-13 points) and inflation (-23 points), which is unchanged from April.

          In fact, 60% of the public still say their incomes are falling behind the rising cost of living, with women and those with lower incomes saying they are especially hard hit.

          Tariffs could be playing a role in the inflation outlook: 49% say tariffs hurt workers compared to only 37% who say they help; 67% say they raise the cost of everyday goods. But by a 47%-37% margin, tariffs are seen helping US companies who produce in the U.S.

          Still, almost three-quarters of the public say foreign trade represents an economic opportunity for the U.S., rather than a threat. The public on net disapproves of the President's tariffs by a 51%-45% margin.

          Source: CNBC

          To stay updated on all economic events of today, please check out our Economic calendar
          Risk Warnings and Disclaimers
          You understand and acknowledge that there is a high degree of risk involved in trading. Following any strategies or investment methods may lead to potential losses. The content on the site is provided by our contributors and analysts for information purposes only. You are solely responsible for determining whether any trading assets, securities, strategy, or any other product is suitable for investing based on your own investment objectives and financial situation.
          Add to Favorites
          Share

          The jobs report that enraged Trump was flashing a recession warning sign

          Adam

          Economic

          The bad news in last Friday’s jobs report may have been overshadowed when President Donald Trump fired the commissioner in charge of producing it. But economists haven’t forgotten about America’s job market – and they’re growing concerned.
          Some of the jobs report data has economists using a word they haven’t uttered in several months: recession.
          Hiring over the past three months slowed dramatically, creating problems for the economists and statisticians at the Bureau of Labor Statistics whose job is to make sense of the payroll data they get from thousands of businesses across the country. As new data came in about May and June’s employment, the BLS was forced to sharply lower those months’ job totals from their preliminary estimates.
          The BLS revised May and June’s jobs totals lower by a combined 258,000 jobs. That massive revision gave economists some serious agita. Larger revisions have happened before, but every time changes that large have taken place over the course of at least two months, the US economy has been in a recession – at least since records began in 1968.
          “The job market is terrible,” said Douglas Holtz-Eakin, former director of the Congressional Budget Office during the George W. Bush administration. “Outside of education and health, the economy has lost private sector jobs in the past three months. That’s terrible.”
          Warnings – but no recession yet
          The US economy has added an average of just 85,000 jobs per month this year, which is well below the 177,000 jobs that the economy added on average each month before the pandemic.
          Poor jobs data doesn’t mean the US economy is in or going into a recession. Several recent economic indicators are pointing in the wrong direction – weakness in second-quarter gross domestic product and slower-than-expected growth in both the manufacturing and services sectors, for example. But, importantly, the National Bureau of Economic Research, which is responsible for declaring recessions, tracks four big indicators of economic activity – consumer spending, personal income, factory production and employment. None have been pointing to a recession or even that the US economy is on the precipice of a recession.
          That is, until Friday’s jobs report. Yet even the recession alarms it sounded come with some caveats. Recent moribund job growth was likely distorted by business uncertainty surrounding Trump’s tariffs, and it’s too early to tell whether it will rebound or continue to remain at this low level, noted Keith Lerner, co-chief investment officer at Truist.
          “The US economy is in a muddle-through environment,” said Lerner, who said the Federal Reserve probably needs to take action to lower interest rates soon because the jobs report suggests it might be behind the curve.
          The Fed has known about the slowing hiring for quite some time. But the sharp pullback over the past few months – data the Fed didn’t have when it made its decision last week to hold interest rates steady – probably means the economy is considerably weaker than economists had expected.
          “Friday’s jobs report was terrible with recessionary level numbers, but slowing hiring is not new,” said Robert Ruggirello, chief investment officer, Brave Eagle Wealth Management. “While Friday’s report does not mean we are entering a recession, it shows that companies are freezing hiring and firing until there is more policy certainty and business confidence.”
          Ironically, the leading culprit for slowing jobs growth may be the thing that has been holding the Fed back from cutting rates: Trump’s tariffs. The Fed had been in wait-in-see mode in case tariffs pushed prices higher. The flip side is that the US economy appeared strong enough to handle higher interest rates.
          But it seems businesses are no longer waiting. They’re freezing hiring and changing their investments as they grow fearful that tariffs could raise costs and hurt the economy.
          “The president’s unorthodox economic agenda and policies may be starting to make a dent in the labor market,” said Chris Rupkey, chief economist at FwdBonds. “Businesses are not waiting as they are cutting back on the numbers of new workers they bring on board, which means we can no longer count on the employment markets to be a positive factor supporting economic growth in the weeks and months ahead.”
          Trump’s immigration policy appears to be taking a toll, too. Since April, 1.4 million people dropped out of the US labor force – 802,000 of whom were foreign born.
          That may have helped make the jobs report look slightly better than it actually is. Because of the way the survey was taken, if the 503,000 who dropped out of the labor force but still wanted to work had told the BLS that they were actively searching for a job, the unemployment rate would have risen to 4.5% last month, Rupkey said. Instead, it rose to 4.2%.
          About those revisions…
          The revisions, though surprising for their sheer size, were not fully unexpected. They align with the other inputs that analysts have been tracking, Goldman Sachs economists said in a note to clients Saturday, and they help paint a clearer picture of the economy.
          Other key jobs indicators “have slowed significantly in recent months,” wrote Goldman Sachs economist Jan Hatzius. “Taken together, the economic data confirm our view that the US economy is growing at a below-potential pace.”
          In other words, Goldman Sachs isn’t shocked by the revisions. If anything, they fit with the broader puzzle pieces.
          The revisions were “undeniably concerning,” Bank of America economists said in a note to investors Monday. But the “silver lining” is that a considerable amount of the revisions had to do with seasonal adjustments – basically algorithms that needed adjusting as new data came in.
          The BLS considers its initial jobs numbers to be preliminary when they’re first published, because some respondents fail to report their payroll data by the BLS’ deadline. Low survey responses can make the report more challenging to estimate. But the BLS continues to collect the payroll data as it’s reported, and it revises the data accordingly.
          To extrapolate the data for the entire country, BLS economists add in some educated guesswork, based on seasonal hiring trends. The BLS also smooths out the data with calculations known as seasonal adjustments to avoid huge spikes and dips in data each month.
          The data are also revised because of those seasonal adjustments. If the more complete data comes in well above or below the preliminary data, revisions can be exacerbated by the BLS’ seasonal adjustments, which sometimes need to be recalculated.
          Now that the BLS has a better sense of the job market – one with a much slower pace of hiring – revisions in future months may be far less dramatic than over the past several.

          Source: cnn

          To stay updated on all economic events of today, please check out our Economic calendar
          Risk Warnings and Disclaimers
          You understand and acknowledge that there is a high degree of risk involved in trading. Following any strategies or investment methods may lead to potential losses. The content on the site is provided by our contributors and analysts for information purposes only. You are solely responsible for determining whether any trading assets, securities, strategy, or any other product is suitable for investing based on your own investment objectives and financial situation.
          Add to Favorites
          Share
          FastBull
          Copyright © 2025 FastBull Ltd

          728 RM B 7/F GEE LOK IND BLDG NO 34 HUNG TO RD KWUN TONG KLN HONG KONG

          TelegramInstagramTwitterfacebooklinkedin
          App Store Google Play Google Play
          Products
          Charts

          Chats

          Q&A with Experts
          Screeners
          Economic Calendar
          Data
          Tools
          Membership
          Features
          Function
          Markets
          Copy Trading
          Latest Signals
          Contests
          News
          Analysis
          24/7
          Columns
          Education
          Company
          Careers
          About Us
          Contact Us
          Advertising
          Help Center
          Feedback
          User Agreement
          Privacy Policy
          Business

          White Label

          Data API

          Web Plug-ins

          Poster Maker

          Affiliate Program

          Risk Disclosure

          The risk of loss in trading financial instruments such as stocks, FX, commodities, futures, bonds, ETFs and crypto can be substantial. You may sustain a total loss of the funds that you deposit with your broker. Therefore, you should carefully consider whether such trading is suitable for you in light of your circumstances and financial resources.

          No decision to invest should be made without thoroughly conducting due diligence by yourself or consulting with your financial advisors. Our web content might not suit you since we don't know your financial conditions and investment needs. Our financial information might have latency or contain inaccuracy, so you should be fully responsible for any of your trading and investment decisions. The company will not be responsible for your capital loss.

          Without getting permission from the website, you are not allowed to copy the website's graphics, texts, or trademarks. Intellectual property rights in the content or data incorporated into this website belong to its providers and exchange merchants.

          Not Logged In

          Log in to access more features

          FastBull Membership

          Not yet

          Purchase

          Become a signal provider
          Help Center
          Customer Service
          Dark Mode
          Price Up/Down Colors

          Log In

          Sign Up

          Position
          Layout
          Fullscreen
          Default to Chart
          The chart page opens by default when you visit fastbull.com