Markets
News
Analysis
User
24/7
Economic Calendar
Education
Data
- Names
- Latest
- Prev


Signal Accounts for Members
All Signal Accounts
All Contests


France Industrial Output MoM (SA) (Oct)A:--
F: --
France Trade Balance (SA) (Oct)A:--
F: --
Euro Zone Employment YoY (SA) (Q3)A:--
F: --
Canada Part-Time Employment (SA) (Nov)A:--
F: --
P: --
Canada Unemployment Rate (SA) (Nov)A:--
F: --
P: --
Canada Full-time Employment (SA) (Nov)A:--
F: --
P: --
Canada Labor Force Participation Rate (SA) (Nov)A:--
F: --
P: --
Canada Employment (SA) (Nov)A:--
F: --
P: --
U.S. PCE Price Index MoM (Sept)A:--
F: --
P: --
U.S. Personal Income MoM (Sept)A:--
F: --
P: --
U.S. Core PCE Price Index MoM (Sept)A:--
F: --
P: --
U.S. PCE Price Index YoY (SA) (Sept)A:--
F: --
P: --
U.S. Core PCE Price Index YoY (Sept)A:--
F: --
P: --
U.S. Personal Outlays MoM (SA) (Sept)A:--
F: --
U.S. 5-10 Year-Ahead Inflation Expectations (Dec)A:--
F: --
P: --
U.S. Real Personal Consumption Expenditures MoM (Sept)A:--
F: --
U.S. Weekly Total Rig CountA:--
F: --
P: --
U.S. Weekly Total Oil Rig CountA:--
F: --
P: --
U.S. Consumer Credit (SA) (Oct)A:--
F: --
China, Mainland Foreign Exchange Reserves (Nov)A:--
F: --
P: --
Japan Trade Balance (Oct)A:--
F: --
P: --
Japan Nominal GDP Revised QoQ (Q3)A:--
F: --
P: --
China, Mainland Imports YoY (CNH) (Nov)A:--
F: --
P: --
China, Mainland Exports (Nov)A:--
F: --
P: --
China, Mainland Imports (CNH) (Nov)A:--
F: --
P: --
China, Mainland Trade Balance (CNH) (Nov)A:--
F: --
P: --
China, Mainland Exports YoY (USD) (Nov)A:--
F: --
P: --
China, Mainland Imports YoY (USD) (Nov)A:--
F: --
P: --
Germany Industrial Output MoM (SA) (Oct)A:--
F: --
Euro Zone Sentix Investor Confidence Index (Dec)A:--
F: --
P: --
Canada National Economic Confidence Index--
F: --
P: --
U.K. BRC Like-For-Like Retail Sales YoY (Nov)--
F: --
P: --
U.K. BRC Overall Retail Sales YoY (Nov)--
F: --
P: --
Australia Overnight (Borrowing) Key Rate--
F: --
P: --
RBA Rate Statement
RBA Press Conference
Germany Exports MoM (SA) (Oct)--
F: --
P: --
U.S. NFIB Small Business Optimism Index (SA) (Nov)--
F: --
P: --
Mexico 12-Month Inflation (CPI) (Nov)--
F: --
P: --
Mexico Core CPI YoY (Nov)--
F: --
P: --
Mexico PPI YoY (Nov)--
F: --
P: --
U.S. Weekly Redbook Index YoY--
F: --
P: --
U.S. JOLTS Job Openings (SA) (Oct)--
F: --
P: --
China, Mainland M1 Money Supply YoY (Nov)--
F: --
P: --
China, Mainland M0 Money Supply YoY (Nov)--
F: --
P: --
China, Mainland M2 Money Supply YoY (Nov)--
F: --
P: --
U.S. EIA Short-Term Crude Production Forecast For The Year (Dec)--
F: --
P: --
U.S. EIA Natural Gas Production Forecast For The Next Year (Dec)--
F: --
P: --
U.S. EIA Short-Term Crude Production Forecast For The Next Year (Dec)--
F: --
P: --
EIA Monthly Short-Term Energy Outlook
U.S. API Weekly Gasoline Stocks--
F: --
P: --
U.S. API Weekly Cushing Crude Oil Stocks--
F: --
P: --
U.S. API Weekly Crude Oil Stocks--
F: --
P: --
U.S. API Weekly Refined Oil Stocks--
F: --
P: --
South Korea Unemployment Rate (SA) (Nov)--
F: --
P: --
Japan Reuters Tankan Non-Manufacturers Index (Dec)--
F: --
P: --
Japan Reuters Tankan Manufacturers Index (Dec)--
F: --
P: --
Japan Domestic Enterprise Commodity Price Index MoM (Nov)--
F: --
P: --
Japan Domestic Enterprise Commodity Price Index YoY (Nov)--
F: --
P: --
China, Mainland PPI YoY (Nov)--
F: --
P: --
China, Mainland CPI MoM (Nov)--
F: --
P: --


No matching data
Latest Views
Latest Views
Trending Topics
Top Columnists
Latest Update
White Label
Data API
Web Plug-ins
Affiliate Program
View All

No data
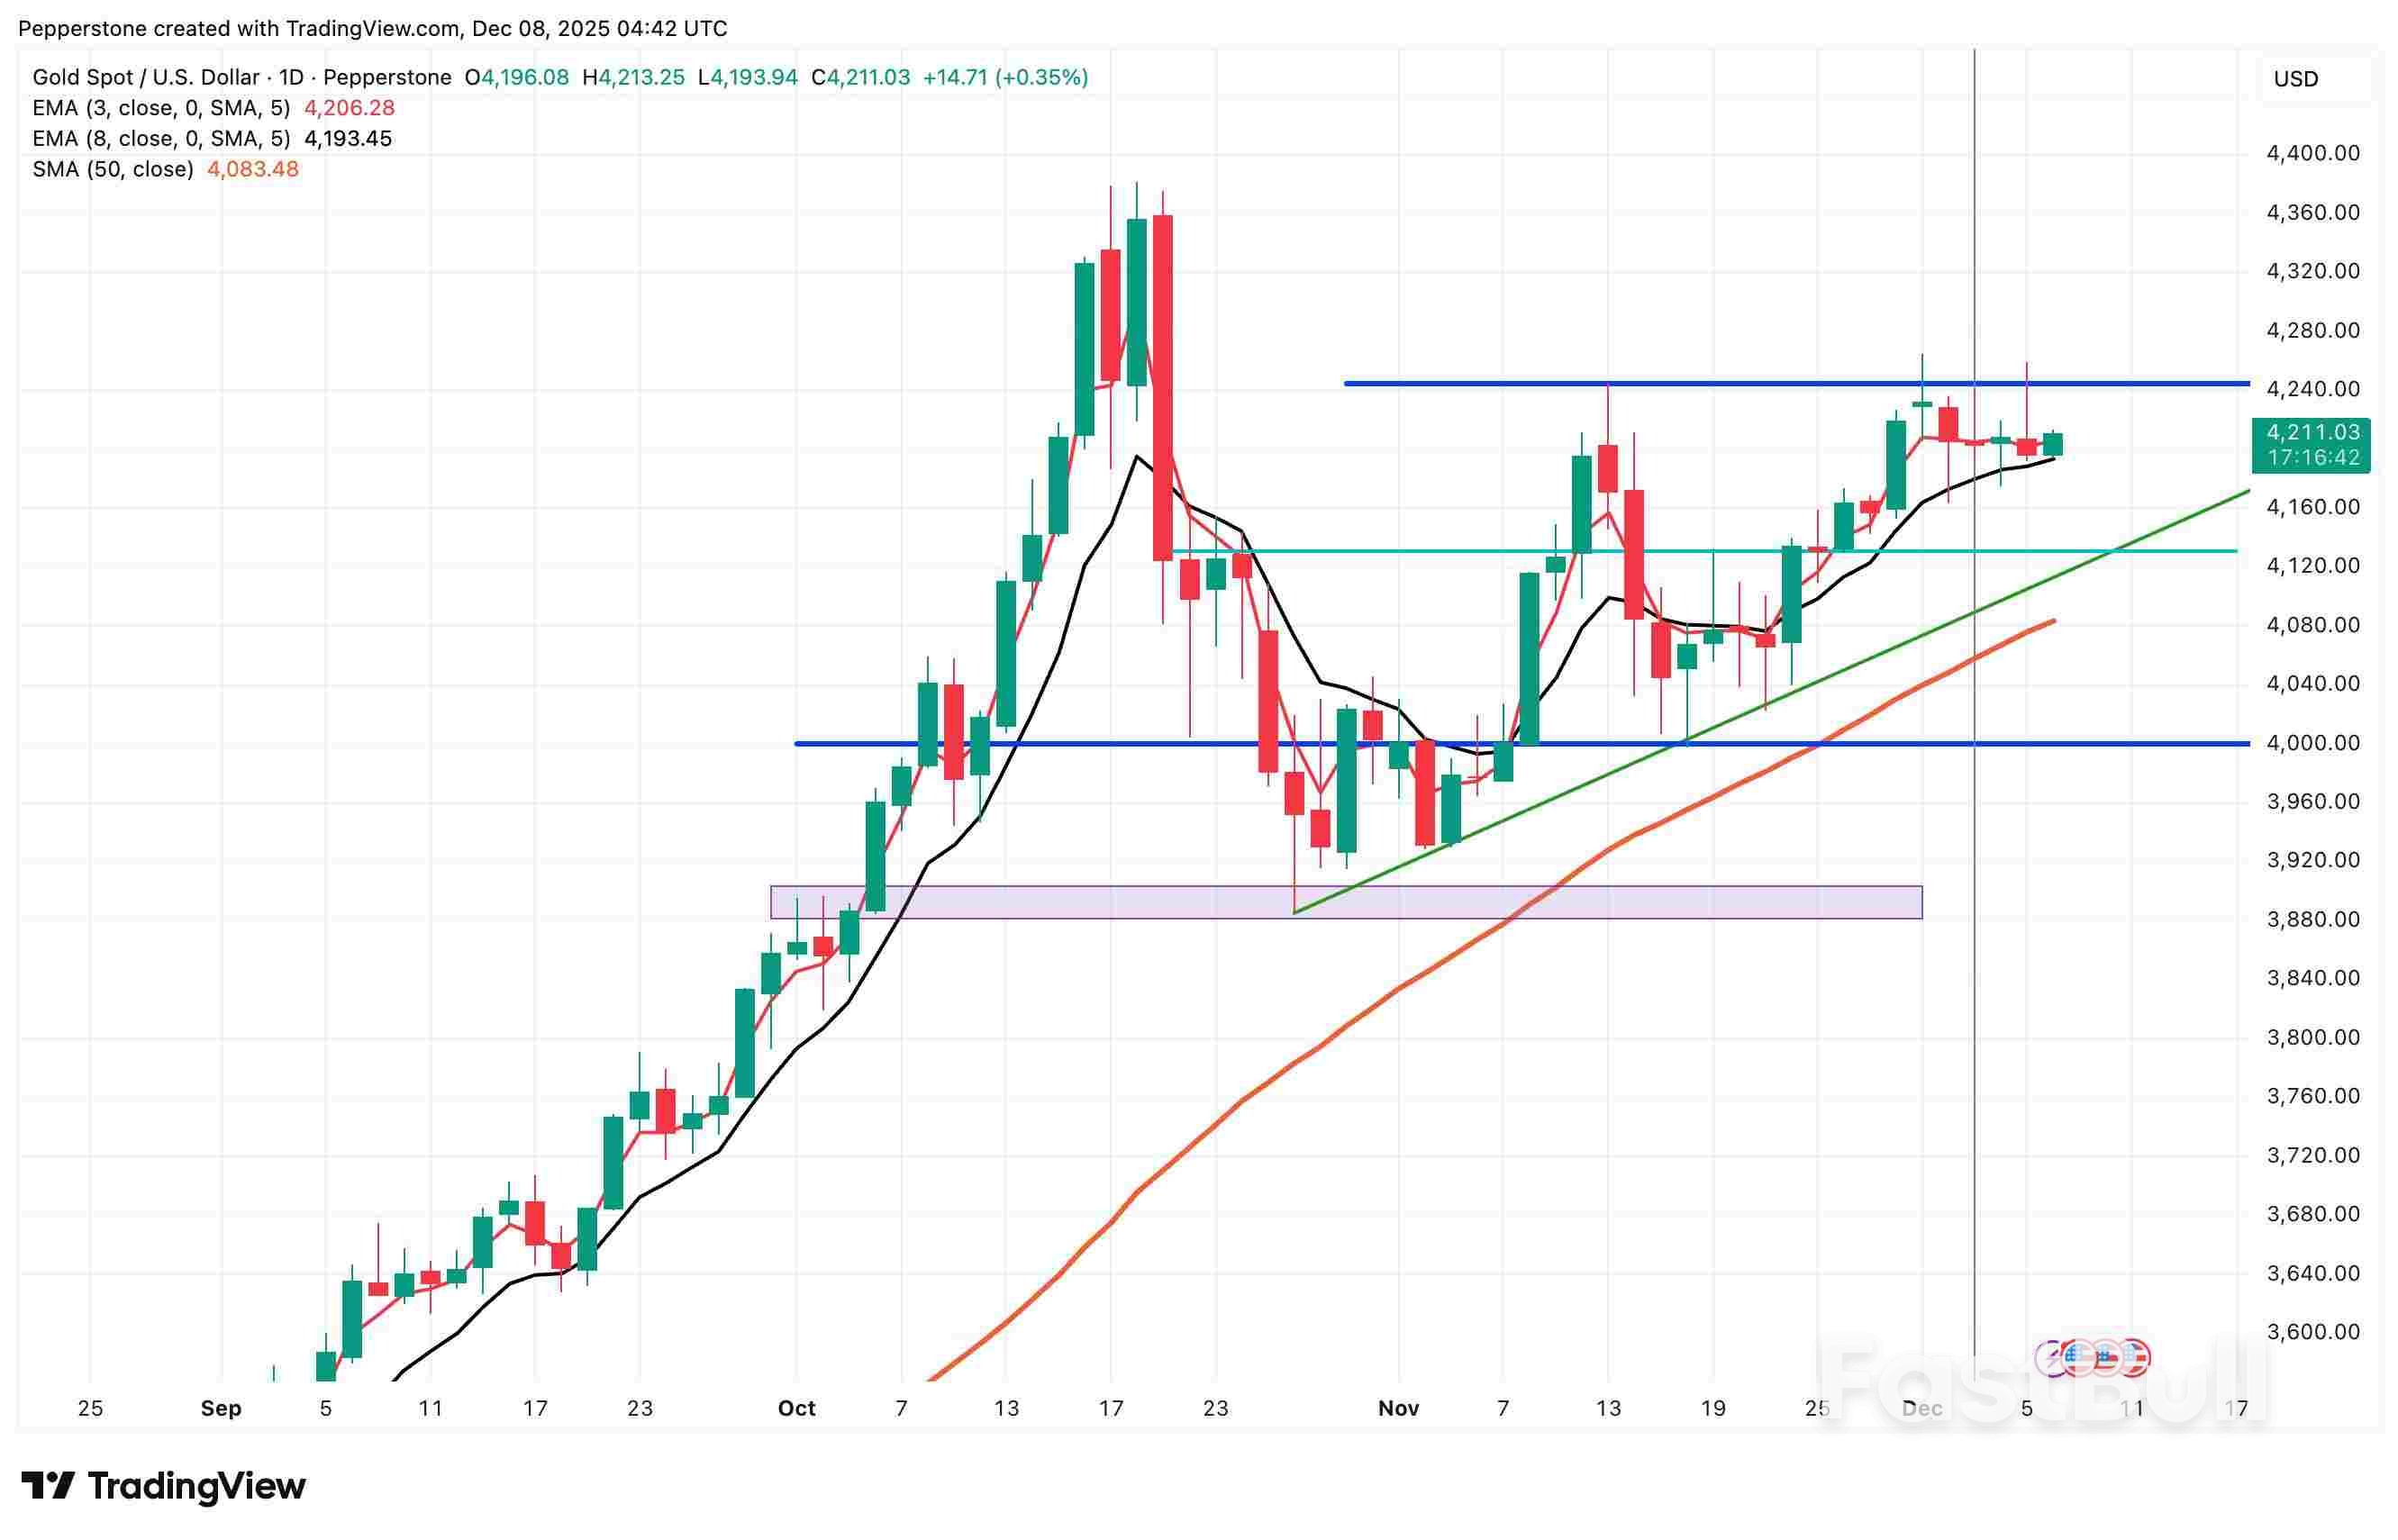
XAUUSD continues to rise amid expectations of Fed policy easing and steady gold demand from China, with prices currently standing at 4,217 USD.
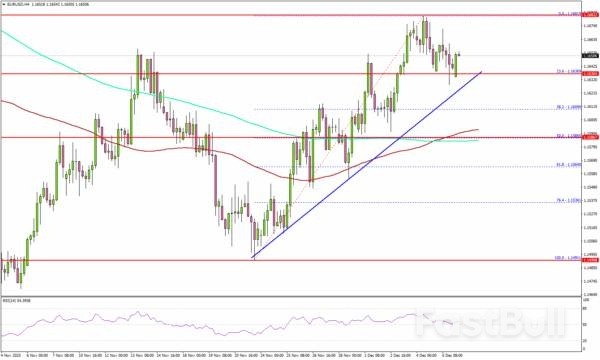
XAUUSD quotes are moderately rising after rebounding confidently from the 4,205 USD support level. The market is focused on the final Fed monetary policy meeting of the year, where traders expect policymakers to move towards lowering interest rates.
Mixed US labour market data, combined with core inflation that matched forecasts, strengthens the case for further policy easing. The core PCE price index, which excludes food and energy, rose 0.2% month-on-month and 2.8% year-over-year in September, the highest since April 2024.
Current market expectations indicate an 87.2% probability that the Federal Reserve will cut interest rates by 25 basis points, with investors also pricing in two additional cuts next year. Gold is further supported by continued demand from China: the country's central bank has increased its gold reserves for 13 consecutive months.
XAUUSD quotes continue to attempt to rise within an ascending price channel. Despite the slowdown in upward movement and the formation of a Triangle pattern, buying pressure remains dominant, as evidenced by the price holding above the EMA-65.
The XAUUSD forecast for 8 December 2025 suggests the bearish correction is nearing completion, followed by renewed growth towards 4,365 USD. An additional bullish signal comes from the Stochastic Oscillator, with the signal lines bouncing off the support level and approaching oversold territory.
A consolidation above 4,290 USD will serve as key confirmation of the end of consolidation and the formation of a bullish impulse within the Triangle pattern.

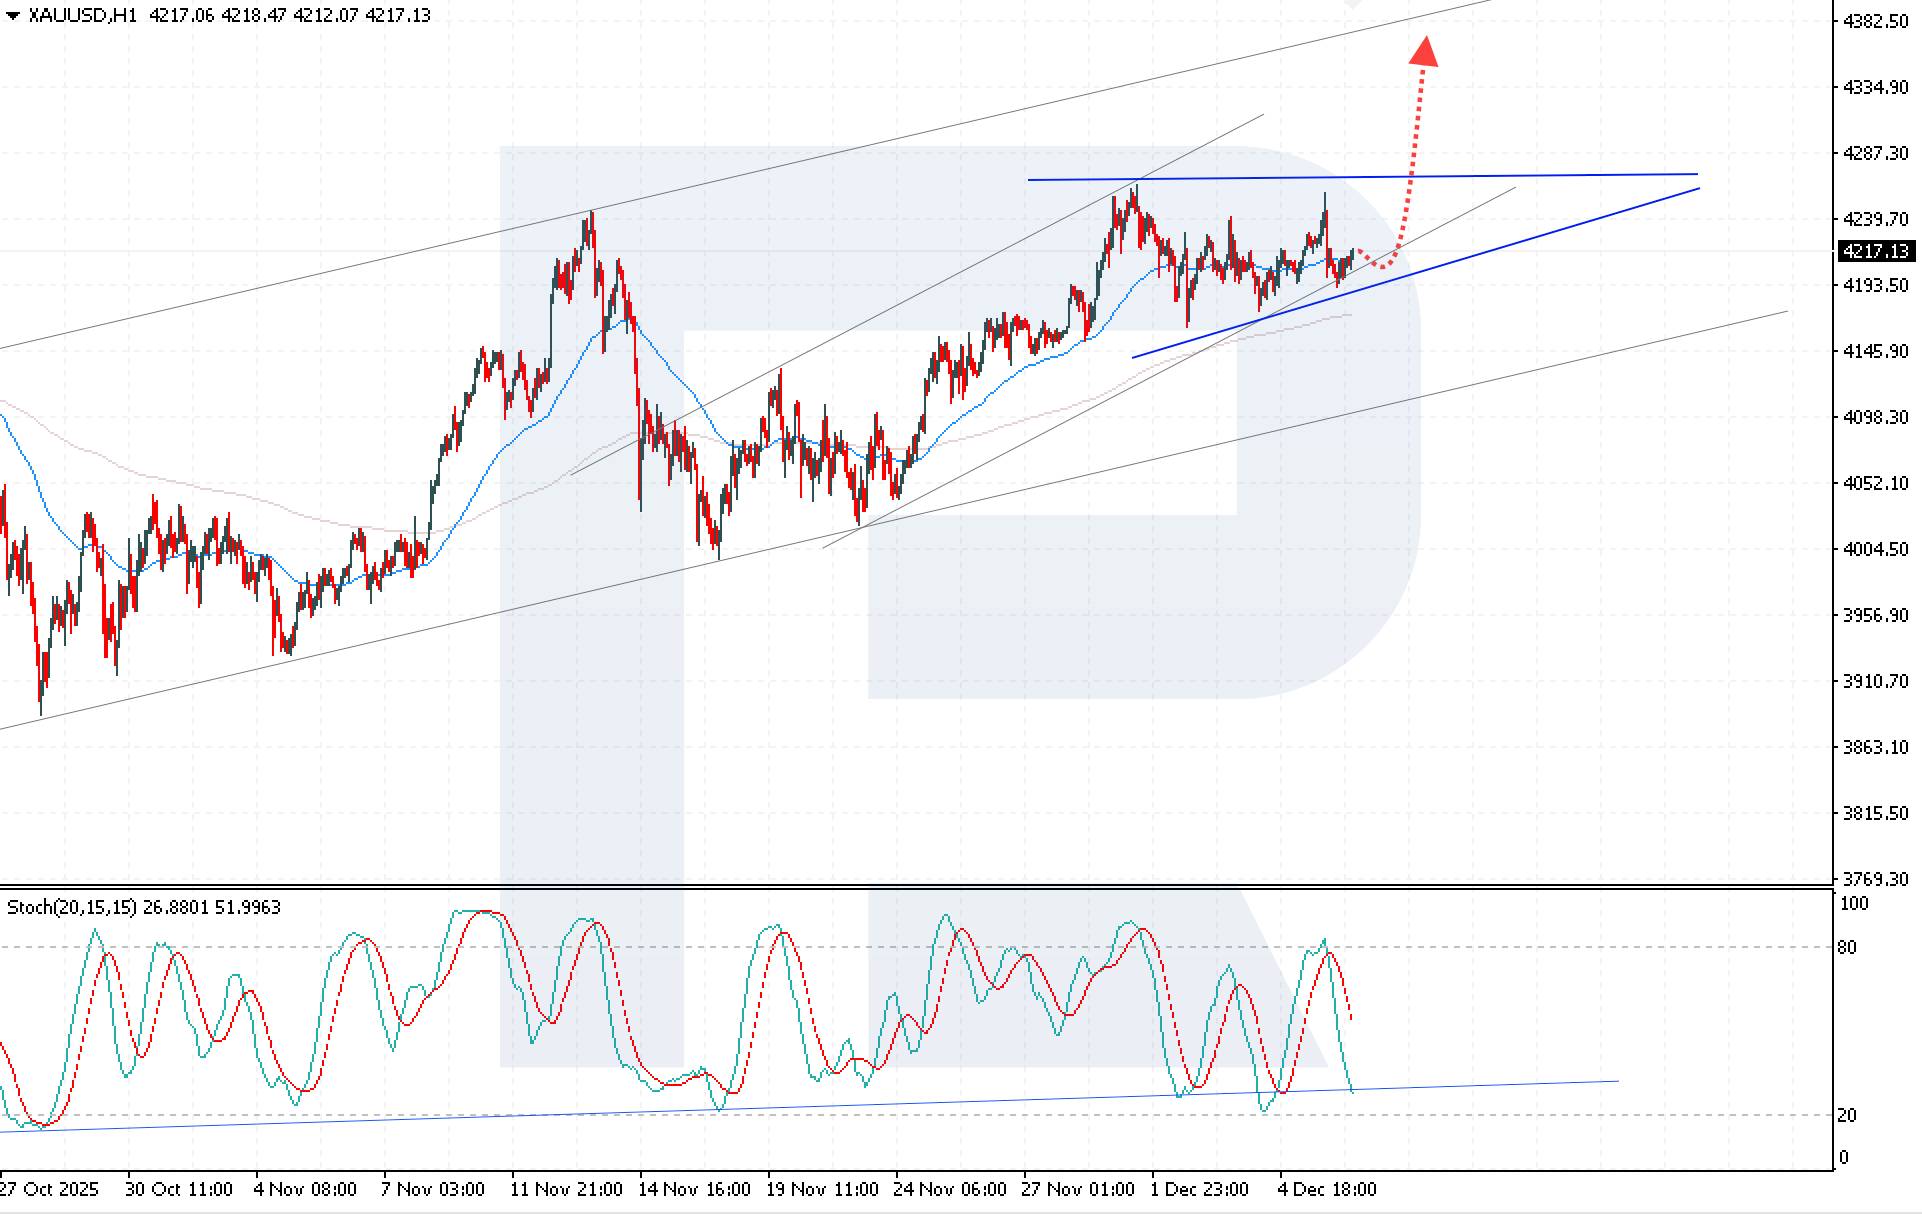
XAUUSD prices retain strong upside potential amid expectations of Fed rate cuts and stable gold demand from China. Today's XAUUSD analysis indicates continued bullish sentiment, and a breakout above 4,290 USD will open the way towards the next target at 4,365 USD.
EURUSD 2026-2027 forecast: key market trends and future predictionsThis article provides the EURUSD forecast for 2026 and 2027 and highlights the main factors determining the direction of the pair's movements. We will apply technical analysis, take into account the opinions of leading experts, large banks, and financial institutions, and study AI-based forecasts. This comprehensive insight into EURUSD predictions should help investors and traders make informed decisions.
Gold (XAUUSD) forecast 2026 and beyond: expert insights, price predictions, and analysisDive deep into the Gold (XAUUSD) price outlook for 2026 and beyond, combining technical analysis, expert forecasts, and key macroeconomic factors. It explains the drivers behind gold's recent surge, explores potential scenarios including a move toward 4,500 to 5,000 USD per ounce, and highlights why the metal remains a strong hedge during global uncertainty.
Last week was full of uncertainties and mixed signals, but US indices ultimately ended in the green after the PCE report — the Fed's preferred inflation gauge — confirmed that inflation remains elevated, near 3%, well above the 2% target, but broadly stable.
Core PCE even eased slightly to 2.8% from 2.9%. More importantly for sentiment, both the 1-year and 5-year Michigan inflation expectations fell. December's survey showed a modest improvement in consumer sentiment — likely helped by the holiday season — but current conditions deteriorated. The softening in recent economic data explains why inflation expectations are easing: the weaker the labour market, the more cautious households become, and the slower price pressures build. That's not good news for Main Street — but it is good news for Wall Street, where investors are eager for rate cuts as long as corporate earnings hold up.
The good news for them is that a 25bp Fed cut on Wednesday is essentially locked in. The recent weakness in employment data and a stable, up-to-date PCE print support that decision.
But what happens next is the part no one agrees on. The FOMC is divided. Some members worry that tariff-driven inflation could offset disinflationary forces and argue for caution — versus those pushing for quicker cuts, in line with political pressures and public preference. The base case is that politics will dominate and that rates will continue to move lower as the committee rotates toward members more aligned with the incoming administration's views, starting with a new Federal Reserve (Fed) Chair.
But here is the risk: if the Fed delivers politically driven cuts without economic justification, markets could push back and long-term yields could rise.
Elsewhere, the Reserve Bank of Australia (RBA), the Bank of Canada (BoC) and the Swiss National Bank (SNB) are all expected to keep rates unchanged. In Japan, today's weak GDP print raised some doubts among Bank of Japan (BoJ) hawks, but 10-year yield continues to climb — now around 1.96% — as wage growth accelerates and keeps inflation concerns alive. The BoJ still looks likely to hike next week.
Meanwhile, tensions between China and Japan are rising, boosting Japanese defence stocks, with Mitsubishi and Kawasaki Heavy Industries each up between 2-3% this morning. Chinese equities, by contrast, are gaining on strong trade data showing a robust jump in exports last month as firms rushed to move inventory ahead of the latest tariff truce with the US.
Oil is also firmer: WTI broke above its 50-day moving average last Friday and closed the week above it, suggesting that further upside is possible, supported by a softer US dollar — which, in theory, should help EM demand — and ongoing AI-related energy needs.
AI earnings: two major AI-linked names report earnings this week. Let's start with the simpler one: Broadcom, reporting Thursday. Expectations are constructive. Broadcom continues to benefit from Google's accelerating deployment of TPUs — for internal use and for Google Cloud customers. Broadcom is one of Google's key partners in producing these chips, handling physical design and components for the latest TPU generations. Rising TPU demand therefore translates into meaningful revenue for Broadcom. The company also recently expanded its client base, including chip supply for Meta. Altogether, the stock remains — for now — relatively resilient to the broader AI-sector volatility.
Oracle, however, is more complicated. The company is now treated as a bellwether of AI-related balance-sheet RISK: it has taken on significant debt to fund its AI and cloud expansion, and carries a lower credit rating than its Big Tech peers. Its 5-year CDS widened sharply last week to a 16-month high.
Analysts expect Oracle to report roughly $16.2bn in revenue and $1.63 EPS. Those figures look solid at first glance but current estimates imply about 9–10% revenue growth and 11–12% EPS growth versus last year. That signals that Wall Street is no longer expecting blowout numbers, but rather a steadier, more incremental climb as Oracle converts its large AI-cloud backlog into realised revenue. Expectations are low — the good news. The bad news is that investors will scrutinise margins and capital efficiency.
Oracle's massive cloud and AI build-out has required equally massive spending. Capex has surged as the company races to expand data-centre capacity, putting pressure on margins just as scrutiny intensifies. At the same time, Oracle's elevated debt load remains one of the largest in Big Tech, and the recent CDS widening shows that credit markets are increasingly sensitive to how much leverage is being used to finance its AI push.
German industrial production rose much more than anticipated, supporting assumptions that the economy will return to growth in the final quarter of 2025.
Output increased 1.8% from the previous month in October, up from a revised 1.1% in September, Destatis said in a statement. That surpassed analyst estimates for a 0.3% gain.
The advance was driven by construction, machinery and electronics products, though output in the car industry fell, the statistics agency said.
Europe's largest economy was boosted by trade at the start of the year as companies rushed to avoid US tariffs. A reversal of that effect weighed on output in the following months, almost tipping the country into another recession.
Germany may see slight growth in the fourth quarter as exports and the manufacturing sector in general "stabilize," the Bundesbank said last month. A significant pickup is forecast next year thanks to government spending on infrastructure on defense.
Factory orders also rose in October, driven by large-scale orders — in particular a 87% jump in the transport category that includes aircraft, ships, trains and military vehicles, data Friday showed.
Industrial firms have still rung the alarm due to their worsening competitive position. The influential BDI business lobby said last week that every month without effective structural reforms will cost more jobs and prosperity.
Surveys by S&P Global last month confirmed the important manufacturing sector still faces significant challenges, with an activity index falling to a nine-month low. Firms have frequently complained about excessive red tape, high labor costs and growing competition from China.
The Euro started a decent increase above 1.1550 against the US Dollar. EUR/USD cleared the key barrier at 1.1600 to enter a positive zone.
Looking at the 4-hour chart, the pair gained pace for a move above 1.1620. It traded as high as 1.1681 and settled above the 100 simple moving average (red, 4-hour) and the 200 simple moving average (green, 4-hour).

It is now consolidating gains above 1.1620. There is also a key bullish trend line forming with support at 1.1630. Immediate resistance sits near 1.1660. The first key hurdle is seen near 1.1680.
A close above 1.1680 could open the doors for a move toward 1.1725. Any more gains could set the pace for a steady increase toward 1.1780.
On the downside, there is key support at 1.1630 and the trend line at 1.1620. The next support is 1.1580 and the 100 simple moving average (red, 4-hour). A close below the 100 simple moving average (red, 4-hour) could spark a bearish move and send the pair to 1.1510. Any more losses might call for a test of 1.1465.
Looking at GBP/USD, the pair rallied above 1.3300 and recently started a consolidation phase. The main support sits at 1.3260.
This week, market attention turns to the Fed's final rate decision of the year. Updates to the dot plot, adjustments to economic projections, and Powell's remarks could all be key factors influencing gold's year-end trajectory.
Looking at the XAUUSD daily chart, gold has been trading in a tight range between $4,180 and $4,250. Bulls face clear resistance near $4,250, with multiple attempts failing to hold above this level. Although the uptrend formed at the end of October remains intact, buying momentum has been limited, keeping supply and demand relatively balanced.

On Monday morning, gold traded near $4,200. To the upside, $4,250 is a critical level for resuming the uptrend. A sustained break above this level, accompanied by higher volume, could reignite bullish momentum, pushing toward $4,300 and ultimately the record high of $4,381.
To the downside, a drop below last week's $4,180 low would shift focus to the October uptrend line near the 50-day moving average, likely attracting buying interest and prompting a short-term rebound.
Bullish factors remain dominant for gold. In the U.S., the December rate cut is priced at nearly 90%, the dollar is weak, and internal Fed divisions over the path of future easing have grown, all supporting gold. Meanwhile, China's central bank increased its gold holdings for the 13th consecutive month in November, reinforcing price support. Yet, last week's economic data only reinforced existing bullish narratives without providing new momentum.
At the same time, U.S. Treasuries faced continued selling, with yields rising, reflecting cautious expectations for a "hawkish cut," which adds some pressure to the non-yielding asset.
The market's focus is squarely on the Fed's decision this week. Beyond the rate cut itself, traders are watching dot plot updates, Powell's tone, and guidance on the 2026 rate cut path. Unlike Powell's previous emphasis on internal consensus, committee members now differ significantly in both policy direction and magnitude. Even minor adjustments by a few members could lead to notable dot plot shifts and rate path changes.
The baseline scenario for traders is that the U.S. labor market faces downside risks, unemployment forecasts may be slightly revised higher, and Powell may acknowledge internal Fed divisions while using moderately hawkish language on the rate cut. With dot plot uncertainty intact, this policy risk hedging could provide some support to gold.
If the Fed's outcome and comments are clearly dovish, gold's upside momentum could strengthen further. Conversely, if economic forecasts show persistent inflation and some Fed members lean hawkish, delaying 2026 rate cuts, profit-taking could intensify, putting short-term pressure on gold prices.
Overall, gold remains in high-level consolidation, and market confidence in its long-term bullish outlook stays firm. In the short term, "range trading and trend-following" remains the preferred strategy. Until $4,250 is decisively breached, chasing positions carries risk. Any reasonable pullback is likely to attract buying interest and support prices.
Aside from the Fed, the market will also monitor policy meetings from the RBA, Bank of Canada, and Swiss National Bank. The market's main tension has shifted from simply validating economic data to pre-pricing potential divergences in major central bank policies. Greater volatility in interest rates and currencies could further enhance gold's appeal as a safe-haven asset.
On Tuesday, the U.S. will release October JOLTS job openings, expected at 7.15 million. This will be the first data reflecting the true labor market post-government shutdown, potentially shaping expectations for Fed policy.
If the figure falls below consensus, it may reinforce expectations of a weaker labor market, increase the probability of rate cuts, and provide additional support for gold.
White Label
Data API
Web Plug-ins
Poster Maker
Affiliate Program
The risk of loss in trading financial instruments such as stocks, FX, commodities, futures, bonds, ETFs and crypto can be substantial. You may sustain a total loss of the funds that you deposit with your broker. Therefore, you should carefully consider whether such trading is suitable for you in light of your circumstances and financial resources.
No decision to invest should be made without thoroughly conducting due diligence by yourself or consulting with your financial advisors. Our web content might not suit you since we don't know your financial conditions and investment needs. Our financial information might have latency or contain inaccuracy, so you should be fully responsible for any of your trading and investment decisions. The company will not be responsible for your capital loss.
Without getting permission from the website, you are not allowed to copy the website's graphics, texts, or trademarks. Intellectual property rights in the content or data incorporated into this website belong to its providers and exchange merchants.
Not Logged In
Log in to access more features

FastBull Membership
Not yet
Purchase
Log In
Sign Up