• Trade
  • Markets
  • Copy
  • Contests
  • News
  • 24/7
  • Calendar
  • Q&A
  • Chats
Trending
Screeners
SYMBOL
LAST
BID
ASK
HIGH
LOW
NET CHG.
%CHG.
SPREAD
SPX
S&P 500 Index
6827.42
6827.42
6827.42
6899.86
6801.80
-73.58
-1.07%
--
DJI
Dow Jones Industrial Average
48458.04
48458.04
48458.04
48886.86
48334.10
-245.98
-0.51%
--
IXIC
NASDAQ Composite Index
23195.16
23195.16
23195.16
23554.89
23094.51
-398.69
-1.69%
--
USDX
US Dollar Index
97.950
98.030
97.950
98.500
97.950
-0.370
-0.38%
--
EURUSD
Euro / US Dollar
1.17394
1.17409
1.17394
1.17496
1.17192
+0.00011
+ 0.01%
--
GBPUSD
Pound Sterling / US Dollar
1.33707
1.33732
1.33707
1.33997
1.33419
-0.00148
-0.11%
--
XAUUSD
Gold / US Dollar
4299.39
4299.39
4299.39
4353.41
4257.10
+20.10
+ 0.47%
--
WTI
Light Sweet Crude Oil
57.233
57.485
57.233
58.011
56.969
-0.408
-0.71%
--

Community Accounts

Signal Accounts
--
Profit Accounts
--
Loss Accounts
--
View More

Become a signal provider

Sell trading signals to earn additional income

View More

Guide to Copy Trading

Get started with ease and confidence

View More

Signal Accounts for Members

All Signal Accounts

Best Return
  • Best Return
  • Best P/L
  • Best MDD
Past 1W
  • Past 1W
  • Past 1M
  • Past 1Y

All Contests

  • All
  • Trump Updates
  • Recommend
  • Stocks
  • Cryptocurrencies
  • Central Banks
  • Featured News
Top News Only
Share

Ukraine Says It Received 114 Prisoners From Belarus

Share

USA Embassy In Lithuania: Maria Kalesnikava Is Not Going To Vilnius

Share

USA Embassy In Lithuania: Other Prisoners Are Being Sent From Belarus To Ukraine

Share

Ukraine President Zelenskiy: Five Ukrainians Released By Belarus In US-Brokered Deal

Share

USA Vilnius Embassy: USA Stands Ready For "Additional Engagement With Belarus That Advances USA Interests"

Share

USA Vilnius Embassy: Belarus, USA, Other Citizens Among The Prisoners Released Into Lithuania

Share

USA Vilnius Embassy: USA Will Continue Diplomatic Efforts To Free The Remaining Political Prisoners In Belarus

Share

USA Vilnius Embassy: Belarus Releases 123 Prisoners Following Meeting Of President Trump's Envoy Coale And Belarus President Lukashenko

Share

USA Vilnius Embassy: Masatoshi Nakanishi, Aliaksandr Syrytsa Are Among The Prisoners Released By Belarus

Share

USA Vilnius Embassy: Maria Kalesnikava And Viktor Babaryka Are Among The Prisoners Released By Belarus

Share

USA Vilnius Embassy: Nobel Peace Prize Laureate Ales Bialiatski Is Among The Prisoners Released By Belarus

Share

Belarusian Presidential Administration Telegram Channel: Lukashenko Has Pardoned 123 Prisoners As Part Of Deal With US

Share

Two Local Syrian Officials: Joint US-Syrian Military Patrol In Central Syria Came Under Fire From Unknown Assailants

Share

Israeli Military Says It Targeted 'Key Hamas Terrorist' In Gaza City

Share

Rwanda's Actions In Eastern Drc Are A Clear Violation Of Washington Accords Signed By President Trump - Secretary Of State Rubio

Share

Israeli Military Issues Evacuation Warning In Southern Lebanon Village Ahead Of Strike - Spokesperson On X

Share

Belarusian State Media Cites US Envoy Coale As Saying He Discussed Ukraine And Venezuela With Lukashenko

Share

Belarusian State Media Cites US Envoy Coale As Saying That US Removes Sanctions On Belarusian Potassium

Share

Thai Prime Minister: No Ceasefire Agreement With Cambodia

Share

US, Ukraine To Discuss Ceasefire In Berlin Ahead Of European Summit

TIME
ACT
FCST
PREV
U.K. Trade Balance Non-EU (SA) (Oct)

A:--

F: --

P: --

U.K. Trade Balance (Oct)

A:--

F: --

P: --

U.K. Services Index MoM

A:--

F: --

P: --

U.K. Construction Output MoM (SA) (Oct)

A:--

F: --

P: --

U.K. Industrial Output YoY (Oct)

A:--

F: --

P: --

U.K. Trade Balance (SA) (Oct)

A:--

F: --

P: --

U.K. Trade Balance EU (SA) (Oct)

A:--

F: --

P: --

U.K. Manufacturing Output YoY (Oct)

A:--

F: --

P: --

U.K. GDP MoM (Oct)

A:--

F: --

P: --

U.K. GDP YoY (SA) (Oct)

A:--

F: --

P: --

U.K. Industrial Output MoM (Oct)

A:--

F: --

P: --

U.K. Construction Output YoY (Oct)

A:--

F: --

P: --

France HICP Final MoM (Nov)

A:--

F: --

P: --

China, Mainland Outstanding Loans Growth YoY (Nov)

A:--

F: --

P: --

China, Mainland M2 Money Supply YoY (Nov)

A:--

F: --

P: --

China, Mainland M0 Money Supply YoY (Nov)

A:--

F: --

P: --

China, Mainland M1 Money Supply YoY (Nov)

A:--

F: --

P: --

India CPI YoY (Nov)

A:--

F: --

P: --

India Deposit Gowth YoY

A:--

F: --

P: --

Brazil Services Growth YoY (Oct)

A:--

F: --

P: --

Mexico Industrial Output YoY (Oct)

A:--

F: --

P: --

Russia Trade Balance (Oct)

A:--

F: --

P: --

Philadelphia Fed President Henry Paulson delivers a speech
Canada Building Permits MoM (SA) (Oct)

A:--

F: --

P: --

Canada Wholesale Sales YoY (Oct)

A:--

F: --

P: --

Canada Wholesale Inventory MoM (Oct)

A:--

F: --

P: --

Canada Wholesale Inventory YoY (Oct)

A:--

F: --

P: --

Canada Wholesale Sales MoM (SA) (Oct)

A:--

F: --

P: --

Germany Current Account (Not SA) (Oct)

A:--

F: --

P: --

U.S. Weekly Total Rig Count

A:--

F: --

P: --

U.S. Weekly Total Oil Rig Count

A:--

F: --

P: --

Japan Tankan Large Non-Manufacturing Diffusion Index (Q4)

--

F: --

P: --

Japan Tankan Small Manufacturing Outlook Index (Q4)

--

F: --

P: --

Japan Tankan Large Non-Manufacturing Outlook Index (Q4)

--

F: --

P: --

Japan Tankan Large Manufacturing Outlook Index (Q4)

--

F: --

P: --

Japan Tankan Small Manufacturing Diffusion Index (Q4)

--

F: --

P: --

Japan Tankan Large Manufacturing Diffusion Index (Q4)

--

F: --

P: --

Japan Tankan Large-Enterprise Capital Expenditure YoY (Q4)

--

F: --

P: --

U.K. Rightmove House Price Index YoY (Dec)

--

F: --

P: --

China, Mainland Industrial Output YoY (YTD) (Nov)

--

F: --

P: --

China, Mainland Urban Area Unemployment Rate (Nov)

--

F: --

P: --

Saudi Arabia CPI YoY (Nov)

--

F: --

P: --

Euro Zone Industrial Output YoY (Oct)

--

F: --

P: --

Euro Zone Industrial Output MoM (Oct)

--

F: --

P: --

Canada Existing Home Sales MoM (Nov)

--

F: --

P: --

Euro Zone Total Reserve Assets (Nov)

--

F: --

P: --

U.K. Inflation Rate Expectations

--

F: --

P: --

Canada National Economic Confidence Index

--

F: --

P: --

Canada New Housing Starts (Nov)

--

F: --

P: --

U.S. NY Fed Manufacturing Employment Index (Dec)

--

F: --

P: --

U.S. NY Fed Manufacturing Index (Dec)

--

F: --

P: --

Canada Core CPI YoY (Nov)

--

F: --

P: --

Canada Manufacturing Unfilled Orders MoM (Oct)

--

F: --

P: --

Canada Manufacturing New Orders MoM (Oct)

--

F: --

P: --

Canada Core CPI MoM (Nov)

--

F: --

P: --

Canada Manufacturing Inventory MoM (Oct)

--

F: --

P: --

Canada CPI YoY (Nov)

--

F: --

P: --

Canada CPI MoM (Nov)

--

F: --

P: --

Canada CPI YoY (SA) (Nov)

--

F: --

P: --

Canada Core CPI MoM (SA) (Nov)

--

F: --

P: --

Q&A with Experts
    • All
    • Chatrooms
    • Groups
    • Friends
    Connecting
    .
    .
    .
    Type here...
    Add Symbol or Code

      No matching data

      All
      Trump Updates
      Recommend
      Stocks
      Cryptocurrencies
      Central Banks
      Featured News
      • All
      • Russia-Ukraine Conflict
      • Middle East Flashpoint
      • All
      • Russia-Ukraine Conflict
      • Middle East Flashpoint
      Search
      Products

      Charts Free Forever

      Chats Q&A with Experts
      Screeners Economic Calendar Data Tools
      Membership Features
      Data Warehouse Market Trends Institutional Data Policy Rates Macro

      Market Trends

      Market Sentiment Order Book Forex Correlations

      Top Indicators

      Charts Free Forever
      Markets

      News

      News Analysis 24/7 Columns Education
      From Institutions From Analysts
      Topics Columnists

      Latest Views

      Latest Views

      Trending Topics

      Top Columnists

      Latest Update

      Signals

      Copy Rankings Latest Signals Become a signal provider AI Rating
      Contests
      Brokers

      Overview Brokers Assessment Rankings Regulators News Claims
      Broker listing Forex Brokers Comparison Tool Live Spread Comparison Scam
      Q&A Complaint Scam Alert Videos Tips to Detect Scam
      More

      Business
      Events
      Careers About Us Advertising Help Center

      White Label

      Data API

      Web Plug-ins

      Affiliate Program

      Awards Institution Evaluation IB Seminar Salon Event Exhibition
      Vietnam Thailand Singapore Dubai
      Fans Party Investment Sharing Session
      FastBull Summit BrokersView Expo
      Recent Searches
        Top Searches
          Markets
          News
          Analysis
          User
          24/7
          Economic Calendar
          Education
          Data
          • Names
          • Latest
          • Prev

          View All

          No data

          Scan to Download

          Faster Charts, Chat Faster!

          Download App
          English
          • English
          • Español
          • العربية
          • Bahasa Indonesia
          • Bahasa Melayu
          • Tiếng Việt
          • ภาษาไทย
          • Français
          • Italiano
          • Türkçe
          • Русский язык
          • 简中
          • 繁中
          Open Account
          Search
          Products
          Charts Free Forever
          Markets
          News
          Signals

          Copy Rankings Latest Signals Become a signal provider AI Rating
          Contests
          Brokers

          Overview Brokers Assessment Rankings Regulators News Claims
          Broker listing Forex Brokers Comparison Tool Live Spread Comparison Scam
          Q&A Complaint Scam Alert Videos Tips to Detect Scam
          More

          Business
          Events
          Careers About Us Advertising Help Center

          White Label

          Data API

          Web Plug-ins

          Affiliate Program

          Awards Institution Evaluation IB Seminar Salon Event Exhibition
          Vietnam Thailand Singapore Dubai
          Fans Party Investment Sharing Session
          FastBull Summit BrokersView Expo

          Thai Finance Minister Says Supports More Us Imports To Reduce Trade Surplus

          Justin

          Economic

          Summary:

          Thailand’s government supports increased US imports of necessary goods as a way to reduce the country’s trade surplus with the United States, the finance minister said on Monday. Authorities will also talk with US business people in Thailand to find ways to ease any impacts of US President Donald Trump’s trade policies, Pichai Chunhavajira told reporters.

          Thailand’s government supports increased US imports of necessary goods as a way to reduce the country’s trade surplus with the United States, the finance minister said on Monday. Authorities will also talk with US business people in Thailand to find ways to ease any impacts of US President Donald Trump’s trade policies, Pichai Chunhavajira told reporters.

          "This will help create understanding with the United States that most Thai exports to the country are investments by US companies based in Thailand," he said.

          Thailand had a trade surplus last year of US$35.4 billion (RM158.43 billion) with the United States, according to the Thai commerce ministry. The United States was Thailand’s largest export market last year, accounting for 18.3% of total shipments, or US$54.96 billion.

          The commerce ministry has cited uncertainty over US trade policies as a challenge to increasing Thai exports.

          Trump has ordered US federal agencies to complete comprehensive reviews of a range of trade issues by April 1, including analyses of persistent US trade deficits.

          He has imposed tariffs on China, and signalled that the 27-nation European Union would be his next target, but suspended his threat of 25% tariffs on Mexico and Canada for 30 days.

          Last week, a Thai government official said US ethane imports would be increased by at least one million tonnes, starting from the second quarter, to try to reduce the trade surplus.

          Pichai also said the government wanted to drive economic growth to above 3% this year by accelerating investment, and said he supported the use of digital assets as funding sources to boost the economy.

          Source: Theedgemarkets

          To stay updated on all economic events of today, please check out our Economic calendar
          Risk Warnings and Disclaimers
          You understand and acknowledge that there is a high degree of risk involved in trading. Following any strategies or investment methods may lead to potential losses. The content on the site is provided by our contributors and analysts for information purposes only. You are solely responsible for determining whether any trading assets, securities, strategy, or any other product is suitable for investing based on your own investment objectives and financial situation.
          Add to Favorites
          Share

          AUD/USD & NZD/USD Rebound: Signs Of Trend Shift?

          Justin

          Economic

          AUD/USD started a decent increase above the 0.6200 and 0.6240 levels. NZD/USD is also rising and might aim for more gains above 0.5700.

          Important Takeaways for AUD USD and NZD USD Analysis Today

          The Aussie Dollar rebounded after forming a base above the 0.6100 level against the US Dollar.

          There was a break below a connecting bullish trend line with support at 0.6255 on the hourly chart of AUD/USD at FXOpen.

          NZD/USD is consolidating gains above the 0.5600 zone.

          There is a key declining channel forming with resistance at 0.5680 on the hourly chart of NZD/USD at FXOpen.

          AUD/USD Technical Analysis

          On the hourly chart of AUD/USD at FXOpen, the pair started a fresh increase from the 0.6090 support. The Aussie Dollar was able to clear the 0.6170 resistance to move into a positive zone against the US Dollar.

          There was a close above the 0.6240 resistance and the 50-hour simple moving average. Finally, the pair tested the 0.6300 zone. A high was formed near 0.6301 and the pair recently saw a minor pullback.

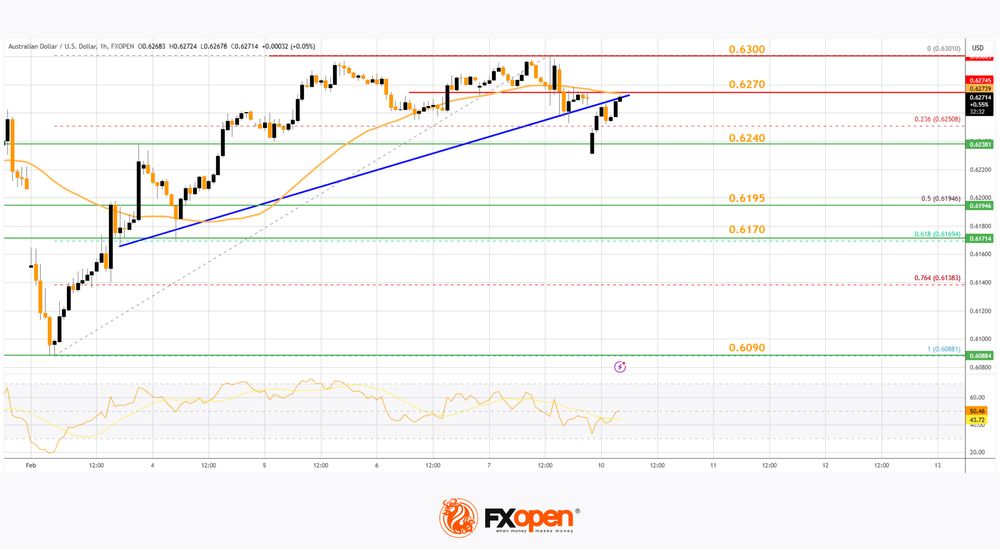
          There was a move below the 0.6300 level. The pair declined below the 23.6% Fib retracement level of the upward move from the 0.6088 swing low to the 0.6301 high. Besides, there was a break below a connecting bullish trend line with support at 0.6255.

          On the downside, initial support is near the 0.6240 level. The next major support is near the 0.6195 zone or the 50% Fib retracement level of the upward move from the 0.6088 swing low to the 0.6301 high.

          If there is a downside break below the 0.6195 support, the pair could extend its decline toward the 0.6170 level. Any more losses might signal a move toward 0.6090.

          On the upside, the AUD/USD chart indicates that the pair is now facing resistance near 0.6270. The first major resistance might be 0.6300. An upside break above the 0.6300 resistance might send the pair further higher.

          The next major resistance is near the 0.6335 level. Any more gains could clear the path for a move toward the 0.6380 resistance zone.

          NZD/USD Technical Analysis

          On the hourly chart of NZD/USD on FXOpen, the pair started a steady increase from the 0.5515 zone. The New Zealand Dollar broke the 0.5600 resistance to start the recent increase against the US Dollar.

          The pair settled above 0.5630 and the 50-hour simple moving average. It tested the 0.5700 zone and is currently correcting gains. The pair corrected lower below the 0.5660 level. However, the bulls are active above the 0.5630 level.

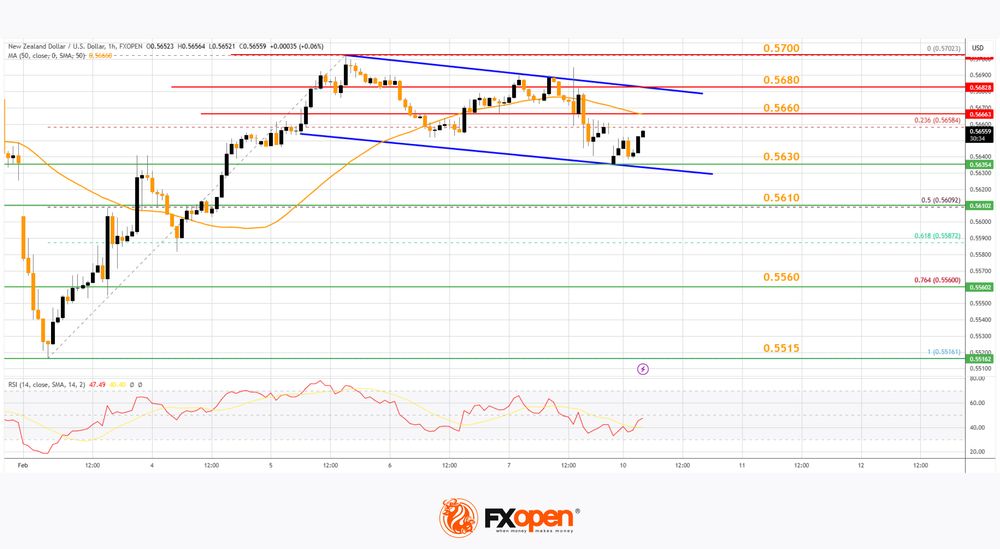
          The NZD/USD chart suggests that the RSI is now moving higher toward 50. On the upside, the pair might struggle near 0.5660. The next major resistance is near the 0.5680 level. There is also a key declining channel forming with resistance at 0.5680.

          A clear move above the 0.5680 level might even push the pair toward the 0.5700 level. Any more gains might clear the path for a move toward the 0.5750 resistance zone in the coming days.

          On the downside, immediate support is near the 0.5630 level. The first key support is near the 50% FIB retracement level of the upward move from the 0.5516 swing low to the 0.5702 high. The next major support is near the 0.5560 level.

          If there is a downside break below the 0.5560 support, the pair might slide toward the 0.5515 support. Any more losses could lead NZD/USD in a bearish zone to 0.5440.

          Source: ACTIONFOREX

          To stay updated on all economic events of today, please check out our Economic calendar
          Risk Warnings and Disclaimers
          You understand and acknowledge that there is a high degree of risk involved in trading. Following any strategies or investment methods may lead to potential losses. The content on the site is provided by our contributors and analysts for information purposes only. You are solely responsible for determining whether any trading assets, securities, strategy, or any other product is suitable for investing based on your own investment objectives and financial situation.
          Add to Favorites
          Share

          The Impact of Trump’S Tariffs on Japan’S Economy and the JPY

          ACY

          Economic

          The reintroduction of protectionist trade policies by the Trump administration is once again stirring uncertainty in global markets, with Japan emerging as a key player affected by the shifting dynamics. With the recent postponement of tariffs on Canada and Mexico and the imposition of new duties on Chinese imports, Japan faces both direct and indirect consequences. The key question remains: how will these tariffs shape the Japanese economy, corporate strategy, and currency markets in the months ahead?
          The Impact of Trump’S Tariffs on Japan’S Economy and the JPY_1

          Japanese Automakers Caught in the Crossfire

          The Trump administration’s initial plan to impose 25% tariffs on Canada and Mexico, although delayed, has already sent shockwaves through Japanese automakers operating in these regions. With Mexico and Canada being major export hubs for Japanese firms, an eventual tariff implementation would force companies to reevaluate their supply chains. The automotive sector, which accounts for nearly 60% of Japan’s exports in these countries, stands to lose significantly should these tariffs materialize. Some manufacturers are already exploring the possibility of shifting production either back to Japan or to the U.S., a move that would increase operational costs but potentially help navigate trade barriers.
          From a currency perspective, the impact is mixed. While a weaker yen would help offset some of the negative earnings implications for exporters, it could simultaneously increase import costs, placing additional strain on Japanese consumers. This dynamic creates a policy conundrum for Japanese authorities, who must balance currency depreciation with domestic price stability.

          China Tariffs and the Broader Impact on Japanese Firms

          In addition to North American tariffs, the Trump administration’s fresh 10% tariffs on Chinese imports exacerbate challenges for Japanese firms with significant manufacturing footprints in China. With over 30,000 Japanese corporate bases in China, many firms are accelerating their supply chain diversification efforts. India has increasingly become a preferred alternative, as firms seek to reduce their dependence on Chinese manufacturing and align with broader geopolitical shifts.
          However, Japan’s ability to fully decouple from China remains constrained by deep economic ties and supply chain entanglements. The Japanese government, under the leadership of Prime Minister Shigeru Ishiba, has emphasized economic security as a priority, advocating for fiscal policies that support corporate investment and industrial resilience. A clear roadmap for growth and incentives for domestic production will be crucial in mitigating the long-term risks posed by U.S.-China tensions.

          Trump’s Boomerang Risk: Could Japan Become a Target?

          As Prime Minister Ishiba prepares for a high-stakes summit with President Trump, Japan finds itself in a delicate position. Historically, Japan’s significant investment in the U.S. has shielded it from aggressive trade policies. However, Trump’s transactional approach to economic policy introduces a new layer of uncertainty. While Japan’s current exemption from new tariffs is a relief, the risk remains that heightened engagement with the U.S. administration could bring Japan into the spotlight.
          The most effective countermeasure? Domestic demand expansion. The Japanese economy is still struggling to recover to pre-pandemic levels, and without a strong commitment to stimulate internal consumption, Japan’s trade surplus with the U.S. could remain a point of contention. Policy missteps—such as premature rate hikes by the Bank of Japan (BoJ) or excessive fiscal tightening—could inadvertently increase Japan’s vulnerability to U.S. tariffs.

          JPY’s Resilience Amid Policy Uncertainty

          Despite these uncertainties, the JPY has remained relatively stable, benefiting from risk-off sentiment whenever Trump’s tariff threats escalate. The currency’s movements have been largely influenced by U.S.-Japan interest rate differentials, with the BoJ’s cautious stance on rate hikes keeping downward pressure on USD/JPY.
          Looking ahead, the key determinants of JPY’s trajectory will include U.S. economic data, upcoming Fed policy decisions, and Japan’s domestic wage growth trends. Recent hawkish signals from BoJ officials and U.S. Treasury Secretary Scott Bessent’s comments about managing long-term yields suggest further volatility in USD/JPY. Non-farm payroll data, inflation figures, and Federal Reserve Chair Jerome Powell’s testimony in the coming weeks will be crucial in determining whether USD/JPY moves toward the 150 level.
          The tariff landscape poses both challenges and opportunities for Japan. While short-term risks remain elevated, strategic shifts in supply chains, domestic fiscal policy, and proactive diplomatic engagement could mitigate the adverse effects. Currency markets will continue to react to these developments, with JPY likely to serve as both a safe-haven asset and a policy tool in navigating these economic headwinds. The coming weeks will be critical in determining how Japan positions itself in this shifting global trade environment.
          To stay updated on all economic events of today, please check out our Economic calendar
          Risk Warnings and Disclaimers
          You understand and acknowledge that there is a high degree of risk involved in trading. Following any strategies or investment methods may lead to potential losses. The content on the site is provided by our contributors and analysts for information purposes only. You are solely responsible for determining whether any trading assets, securities, strategy, or any other product is suitable for investing based on your own investment objectives and financial situation.
          Add to Favorites
          Share

          Gold (XAU) Silver (XAG) Daily Forecast: Prices Rally Amid Trade War Fears, USD Strength

          Owen Li

          Commodity

          Market Overview

          Gold prices (XAU/USD) climbed during the Asian session on Monday, reaching an intra-day high of $2,884 as investors sought safety amid growing trade tensions. The rally came in response to former U.S. President Donald Trump’s announcement of a 25% tariff on steel and aluminum imports, reigniting fears of a global trade war.
          Market participants worry that these tariffs could escalate economic uncertainty and lead to higher inflation, which historically supports gold as a hedge against rising prices. However, gold’s upward momentum could face resistance due to a strong U.S. dollar (USD), buoyed by robust employment data released on Friday.
          The U.S. economy added 143,000 jobs in January—slightly below expectations—while the unemployment rate unexpectedly dropped to 4.0%, signaling labor market resilience.
          Federal Reserve officials, including Neel Kashkari and Austan Goolsbee, have expressed concerns about policy uncertainty, making it difficult to predict inflation trends. Traders are closely watching Fed Chair Jerome Powell’s upcoming congressional testimony and key U.S. inflation data to gauge the central bank’s next moves.

          Silver Extends Gains but Faces Resistance from USD Strength

          Silver (XAG/USD) followed gold’s lead, rising to an intra-day high of $32.08 before settling at $32.04. The bullish momentum in silver mirrors gold’s price action, driven by renewed trade war fears and concerns over inflationary pressures stemming from Trump’s tariff policies.
          While safe-haven demand has lifted silver prices, the metal faces headwinds from a strengthening U.S. dollar. A firm greenback typically limits gains for commodities priced in USD, making them more expensive for foreign investors.
          Traders are also monitoring industrial demand for silver, particularly in the electronics and solar energy sectors, which could further influence price movements.

          Short-Term Forecast

          Gold prices (XAU/USD) remain bullish above $2,859.59, with resistance at $2,886.95. A breakout could push prices higher, while a drop below support may trigger selling. Silver (XAG/USD) consolidates above $31.89, eyeing $32.53.

          Gold Prices Forecast: Technical Analysis

          Gold (XAU) Silver (XAG) Daily Forecast: Prices Rally Amid Trade War Fears, USD Strength_1
          Gold (XAU/USD) is holding steady at $2,878.94, up 0.01%, as buyers defend key support levels. The pivot point at $2,859.59 is acting as a strong foundation, keeping the short-term bullish trend intact. With the 50-day EMA at $2,852.45 supporting price action, gold appears well-positioned for further gains.
          The next challenge for bulls is $2,886.95, followed by $2,906.90—a breakout above these levels could push prices toward fresh highs. However, if gold slips below $2,859.59, selling pressure may accelerate, testing support at $2,834.52 and $2,812.95.
          The upward trendline remains intact, suggesting continued strength. Traders should watch for a decisive move above $2,886.95 to confirm momentum.

          Silver (XAG/USD) Price Forecast: Technical OutlookGold (XAU) Silver (XAG) Daily Forecast: Prices Rally Amid Trade War Fears, USD Strength_2

          Silver (XAG/USD) is trading at $32.04, down 0.05%, as the market consolidates above key support. The pivot point at $31.89 is proving to be a crucial level—staying above it keeps silver in bullish territory, while a breakdown could trigger selling pressure.
          The 50-day EMA at $31.99 aligns closely with the current price, acting as dynamic support, while the 200-day EMA at $31.23 suggests strong buying interest on dips. A push above $32.53 could open the door to $32.92, reinforcing the uptrend.
          If silver drops below $31.89, expect a decline toward $31.37, with further downside risks at $30.96. The upward trendline remains intact, supporting a continued bullish outlook.

          Source:fxempire

          Risk Warnings and Disclaimers
          You understand and acknowledge that there is a high degree of risk involved in trading. Following any strategies or investment methods may lead to potential losses. The content on the site is provided by our contributors and analysts for information purposes only. You are solely responsible for determining whether any trading assets, securities, strategy, or any other product is suitable for investing based on your own investment objectives and financial situation.
          Add to Favorites
          Share

          New Week, New Threats

          Cohen

          Economic

          Another week starts with tariff threats. This time, everyone that applies tariffs to the US will be hit back with the same tariffs, and all aluminium and steel imports to the US – no matter from whom – will face a 25% tariff. Mood this Monday in Asia is pretty mixed – to say the least. Aluminum and iron ore futures are slightly down, the US dollar index is up and the commodity currencies like Aussie and Loonie opened the week with a gap but the AUDUSD recovered early losses.

          The swift recovery in Aussie was certainly due to the encouraging Chinese data that showed that inflation advanced to the highest level in five months thanks to increased spending during the Chinese New Year holiday. Australian equities are not particularly welcoming the fresh tariff news, while FTSE futures are slightly up. The rebound in oil prices on fresh US sanctions on Iranian crude exports and encouraging Chinese inflation data help counterweigh the negative impact of softer metal prices. As per oil, good news from China could throw a solid floor under the US crude selloff after the price of a barrel approached the $70pb psychological level last week and rebounded from there.

          Anti-goldilocks

          Friday’s jobs data from the US was all but ideal for the so-called goldilocks scenario. The US posted slower-than-expected nonfarm payrolls and acceleration in wages growth in January. The annual revision to the nonfarm employment on the other hand was just less than 600K jobs – as expected. The combination of slower job additions with higher wages didn’t enchant the Federal Reserve (Fed) doves. The US 2-year yield jumped to flirt with the 4.30% mark as the 10-year yield advanced past the 4.50% level. Plus, the share of foreign-born workers in the US kept climbing last year but these jobs are at risk under Trump administration.

          Plus, the latest data from the Fed on Friday showed alarming rise in household debt, credit card delinquencies remain strong. As such, it’s hard to guess what’s the best thing to do for the Fed. All eyes will be on Fed Chair Jerome Powell’s semi-annual testimony on Tuesday and Wednesday. For now, the Fed is expected to keep the rates unchanged at least until June – and a June rate cut is a coin toss.

          Overall, US’ exceptional growth story is based on exploding private and public debt. Trump’s plans for mass deportation and sizeable tariffs hint at uptick in US inflation in the coming months. Not helping are the California wildfires that are expected to cause a jump in new and used car prices, and the bird flu which is sending egg prices soaring. As a result, a stronger-than-expected set of inflation data this week – and/or a cautious stance from Powell should keep the US dollar in demand and weigh on risk appetite.

          Speaking of appetite

          Equity indices didn’t like the anti-goldilocks jobs report last Friday. The S&P500 retreated 0.95% while Nasdaq 100 fell 1.30%. Magnificent 7 earnings were robust but not ‘magnificent’ with slowing growth / high AI spending. Mag7 ETF slid 2% on Friday and 2.41% throughout the week.

          In Europe, Friday saw the European Stoxx 600 give back some gains too. On the data front, Germany posted a record trade surplus with the US. The timing is bad, as Trump is out and pointing his finger to Europe, as well. Consequently, the tariff threats remain on the back of investors’ minds in Europe and Germany will be on the front line of a potential transatlantic trade war. But that worry is not dominating the price action so far. On the contrary, the convergence trade between Europe and the US remains in full play.

          The S&P500 is up by a meagre 2% since the year started while the Stoxx 600 was up by almost 7% on Friday’s close. The divergence between the Fed and European Central Bank (ECB) expectations remains supportive of the convergence trade, but doesn’t change the fact that the European companies’ face dull economic outlook and instable political landscape. The EURUSD was aggressively sold on Friday and again at the Asian open. Losses have been mostly reversed at the time of recording but the EURUSD outlook remains negative on the back of diverging Fed / ECB policy outlooks and strong resistance is seen into the 50-DMA, a touch higher than the 1.04 psychological mark.

          Source: ACTIONFOREX

          To stay updated on all economic events of today, please check out our Economic calendar
          Risk Warnings and Disclaimers
          You understand and acknowledge that there is a high degree of risk involved in trading. Following any strategies or investment methods may lead to potential losses. The content on the site is provided by our contributors and analysts for information purposes only. You are solely responsible for determining whether any trading assets, securities, strategy, or any other product is suitable for investing based on your own investment objectives and financial situation.
          Add to Favorites
          Share

          Investor Focus Remains On US Data and Trump

          Owen Li

          Economic

          The Sentix indicator will give us the first indication of European investor confidence in February.

          In Denmark, inflation data for January is released. January data is always extra exciting because many businesses only adjust prices at the turn of the year. Sales also increases uncertainty. Particularly fuel prices have increased due to higher energy fees but also higher oil prices. Even so, we expect a decline in annual inflation to 1.5% from 1.9% in December, driven by particularly electricity, as a big increase in tariffs and fees in January 2024 exits the inflation measure.

          In Norway, January inflation figures are always extra uncertain. This is the time when most administrative prices are regulated, and the effects can be large in some years. In addition, there can be large variations in the price offers in the January sale. Prices normally drop in January, but as prices were unchanged last year, we expect that the annual growth in core inflation slowed to 2.6% in January, in line with Norges Bank’s forecast from the December MPR. The high inflation figures from Sweden for January obviously imply a certain upside risk for the Norwegian figures, because there are some similar seasonal and administrative factors in January as in Norway.

          In Sweden, the figures for industrial orders and monthly household consumption for December are being released. We anticipate some improvement in the household consumption figures, as December’s retail sales and the latest consumer confidence surveys have been encouraging.

          For the remainder of the week, the key data release will be the US January CPI, while US politics will also remain in focus. Attention in the US will also be on Fed Chair Powell’s congressional testimony on Wednesday and US retail sales on Friday. In China, focus will be on whether a call between Xi Jinping and Trump, cancelled last week due to China’s retaliation to Trump’s 10% tariffs, will take place. In the euro area, data releases are limited, but Q4 employment data on Friday will be a highlight. On Friday the Munich Security Conference begins, where the war in Ukraine and possible peace talks will be in focus.

          Economic and market news

          What happened since Friday

          In the US, the labour market report was to the strong side again. The establishment survey showed nonfarm payrolls for January grew by 143k SA, close to our forecast of +150k (cons. +170k), while data for the past two months was revised up by 100k. Average hourly earnings growth accelerated to 0.5% m/m SA, but this largely reflected a drop in average hours worked.

          The household survey was heavily distorted by updated population controls, which boosted labour force and household employment estimates by 2.2m. This effect is purely statistical and has no market impact. The unemployment rate declined to 4.0% (from 4.1%), but as it is based on the household survey, it is difficult to gauge if this really reflects the labour market re-tightening. The annual benchmark revisions to NFP data from April 2023 to March 2024 was -598k, slightly less negative than the preliminary estimate suggested (-818k). Overall, nothing in the report is particularly hawkish or dovish for the markets, when you look past all the possible distortions.

          Consumer sentiment fell from 71.1 in January to 67.8 in February. Notably 1y inflation expectations ticked higher to 4.3% from 3.3%, while 5y expectations were largely unchanged. While Republican respondents were much more optimistic about the future back in November and December, it seems that now both Democrats and Republicans have become much more concerned with the negative consequences of tariffs. However, Chicago Fed President Goolsbee (dovish and non-voting member) did not express new worries about inflation, repeating that the US is on its path back to 2% inflation.

          Turning to the geopolitical front, Trump has reportedly spoken with Putin during the weekend about ending the war in Ukraine. Putin has indicated he is willing to discuss a Ukraine peace deal but rules out making any territorial concessions.

          On Sunday, U.S. President Donald Trump announced plans to introduce new 25% tariffs on all steel and aluminium imports, on top of existing duties. These tariffs, along with reciprocal tariffs to match other countries’ rates, are set to be announced today.

          In the euro area, the most discussed piece on ECB staff updates on r* was published on 7 February. While the piece emphasised do and don’ts of using the estimates for real time monetary policy decisions, it underlines that the broad range of estimates can be summarized as neutral rate being in the range of 1.75% to 2.25% in nominal terms.

          In Germany, industrial production numbers were weak again in December, with production declining 2.4% m/m, leaving total Q4 production 0.9% lower than in Q3. The decline was especially due to the automotive industry and capital goods. Hence, the problems in the German industry are not over and we expect to see a continued decline in production the coming quarters. Yet, rebounding manufacturing PMIs in January gives a small ray of light in combination with the outlook for further rate cuts from the ECB, which should stabilize the industry from the second half of this year.

          In Norway, manufacturing production increased 3.2% m/m in December, which seems to be a shift in the negative trend seen since last summer. Hence, manufacturing activity was down 0.8% in Q4 and will act as a headwind to GDP (due this week).

          In China, CPI was stronger than expected showing a rise in the headline inflation from 0.1% y/y to 0.5% y/y (consensus 0.4% y/y) lifted by an increase in core inflation increased from 0.4% y/y to 0.6% y/y. Holiday spending from the Chinese New Year likely contributed to the increase. It is positive that inflation moved higher and further away from deflation territory, but overall price pressures are still low in China. Producer prices showed a decline again being unchanged at -2.3% y/y.

          Equities: Equities were generally lower on Friday, ending just off worst levels (MSCI World -0.7%). It was a bit of a reversal of the risk appetite from the prior session, with all sectors lower and the VIX rising. Europe outperformed US, with US big tech being the notable laggard. The usual drivers were in play: yields edging higher due to a double whammy of rising wage inflation and household inflation expectations were coupled with disappointing guidance from Amazon (currency related) on top of massive capex plans. However, it was not a full risk-off session, as banks and industrials held up relatively well. Equity markets are not startled by Trump’s steel tariffs, with US futures higher this morning and Hong Kong gaining a full 1.7%. We do not know details yet (such as exceptions). However, tariffs tend to gain Nordic producers which are local US producers in a net importer market and benefitted when tariffs were introduced the last time.

          FI: Global rates sold off with a knee-jerk reaction on the US labour market report on Friday, despite the headline print of 143k new jobs in January was consensus. 10y UST rose 5bp on the announcement and stayed there for the rest of the trading session. For policy signals, Friday’s print is difficult given the statistical uncertainties and revisions as per usual with the January print. Initially the US reaction took 10y Bund higher, albeit that reversed during the afternoon, thus with 10y Bunds ending the day broadly unchanged. Markets price 85bp worth of ECB rate cuts until year end. BundASW tightened into -3bp, a new low.

          FX: Trump’s new weekend pledge to impose tariffs on all steel and aluminium imports is hurting commodity currencies such as AUD and CAD. There might be even more to come this week, as Trump has threatened to unveil reciprocal tariffs on “everyone”. EUR/USD is starting the week’s trading in the low 1.03’s whereas Scandies are close to Friday’s closing levels again, following a temporary overnight sell-off. The ZAR suffers as the US has frozen all aid to South Africa.

          Source: ACTIONFOREX

          To stay updated on all economic events of today, please check out our Economic calendar
          Risk Warnings and Disclaimers
          You understand and acknowledge that there is a high degree of risk involved in trading. Following any strategies or investment methods may lead to potential losses. The content on the site is provided by our contributors and analysts for information purposes only. You are solely responsible for determining whether any trading assets, securities, strategy, or any other product is suitable for investing based on your own investment objectives and financial situation.
          Add to Favorites
          Share

          Don’t Play Trump’s Game On Trade

          Alex

          Economic

          President Trump’s tariffs pose a major threat to the global economy and risk a repeat of the damaging cycle of retaliation that made the Smoot-Hawley tariffs deepen the Great Depression in the 1930s. Rejecting retaliatory tariffs makes more economic sense and a better form of retaliation would be to review the terms of intellectual property protections for US firms.
          Two weeks into Trump 2.0 and North America has for now narrowly avoided what the Wall Street Journal editorial board called ‘the dumbest trade war in history’. But the Trump White House’s tariff mania still threatens contagion to the rest of the world.
          Trump’s 25 per cent tariffs on Canadian and Mexican imports would have dealt a devastating blow to those economies. The retaliation that was promised from both would have only made matters worse. For now they are eating into the 30-day stay on executing the trade war.
          The 10 per cent tariffs on all Chinese imports into the United States went ahead, and the EU is bracing for US tariffs with a retaliation plan reportedly in preparation.
          It’s going to be a long four years.
          Political leaders can’t afford to look weak in the face of Trump’s economic coercion — let’s call it what it is — and will feel forced to retaliate if they find themselves on the receiving end of it.
          As Shiro Armstrong and Tom Westland argue in this week’s lead article, ‘a cycle of retaliation and contagion, which will certainly not stop with Canada or Europe, would propel the world towards a 1930s style prisoner’s dilemma epic fail’. They remind us that what made the 1930 Smoot-Hawley tariffs from the United States so damaging to the global economy ‘was not so much their level but the catastrophic cycle of retaliation that followed’.
          When a country opens its economy up to international trade, it’s that country that benefits the most. Every economics student learns this in their first year, but every politician needs to be reminded of it regularly. Difficult as the politics may be, the reverse is also true: the country that is hurt the most from closing down international trade is the country that puts up the barriers.
          Retaliatory tariffs may be politically expedient but they are an instrument of self-harm.
          Countries sign up to global trade rules to limit their ability to introduce protectionist measures that sabotage their true national interests in the name of whatever political pressure they come under at home.
          The GATT–WTO-based trading system discourages discriminatory practices, promotes transparency and predictability, and discourages governments from enacting protectionist measures. Trump is exporting punitive discriminatory policies, might-is-right ideology, unpredictability, uncertainty and prosperity-destroying protectionism. The rest of the world should not buy in.
          The best revenge, as they say, is living well. The United States may have become the biggest threat to the postwar economic order that it once led, but the rest of the world doesn’t need to let that order fall apart. Protecting the system that underpins global development, prosperity and security is the top priority.
          The world can take a lesson from Australia’s rules-first response to China’s efforts at trade coercion, which weren’t swayed by pressures for retaliation that would have only led to more economic damage. Resorting to bilateral disputes directed through the WTO, as Australia did with China’s trade bans, isn’t an option for dealing with Washington now. But the broad strategy for national leaders looking to stand up to Trump’s bullying should be to offer an alternative vision of global order that appeals more to their constituents than a carbon copy of Trump’s dark, nationalistic, dog-eats-dog one.
          Just as dangerous as the economic impact of a general tariff war is the risk that leaders worldwide accept Trump’s false premises as they respond to his actions.
          Armstrong and Westland call for ‘collective action led by Asia and Europe — where trade openness is an economic and political security imperative — not against the United States, but for the global public good of an open, rules-based economic system’. The established trade system is far from perfect, but the alternative is disorder and economic and political insecurity.
          When the United States stopped the global trade umpire, the WTO Appellate Board, from enforcing rules, a group of countries including all of the European Union, China, Canada and Australia created the Multi-Party Interim Appeal Arbitration Agreement (MPIA) that replicates the WTO dispute settlement function. That group now comprises close to a third of the WTO membership. That’s the sort of collective action that’s now needed.
          The best revenge may well be living well, but that’s not mutually exclusive from revenge being a dish served cold, to borrow one too many clichés.
          One form of retaliation that would improve welfare, Armstrong and Westland suggest, is reviewing and loosening the intellectual property protections that countries have had to sign up to for US market access. There are real questions about whether IP should be in trade agreements at all. US market access is being revoked and now would be an appropriate time to review the huge flow of fees and royalties to US firms with rules stacked in their favour.
          ‘Few would argue against protecting intellectual property rights as a general principle’, Armstrong and Westland explain, but ‘the United States has gone overboard, favouring the interests of pharmaceutical giants and tech companies at the expense of global consumers’. New standards could be negotiated with minimal acceptable IP protections, introducing fair use or public good exceptions, which the United States has but many others don’t.
          Some of this would hit the tech ‘broligarchs’ backing Trump and would help AI development elsewhere. That is a public good. Unlike goods and services trade, there is no guarantee that monopoly privileges for IP are mutually beneficial. The rest of the world shouldn’t have to pay for deals of the past if the United States undermines them.
          The world now needs to protect the furniture of the global economic order from the United States, the system’s previous leader and enforcer. In doing so, it can avoid paying US companies for medicines, tech and copyright at rates beyond anything reasonable to incentivise R&D and innovation. This would have the added bonus of spurring innovation, health and protecting prosperity elsewhere.

          Source:Eastasiaforum

          To stay updated on all economic events of today, please check out our Economic calendar
          Risk Warnings and Disclaimers
          You understand and acknowledge that there is a high degree of risk involved in trading. Following any strategies or investment methods may lead to potential losses. The content on the site is provided by our contributors and analysts for information purposes only. You are solely responsible for determining whether any trading assets, securities, strategy, or any other product is suitable for investing based on your own investment objectives and financial situation.
          Add to Favorites
          Share
          FastBull
          Copyright © 2025 FastBull Ltd

          728 RM B 7/F GEE LOK IND BLDG NO 34 HUNG TO RD KWUN TONG KLN HONG KONG

          TelegramInstagramTwitterfacebooklinkedin
          App Store Google Play Google Play
          Products
          Charts

          Chats

          Q&A with Experts
          Screeners
          Economic Calendar
          Data
          Tools
          Membership
          Features
          Function
          Markets
          Copy Trading
          Latest Signals
          Contests
          News
          Analysis
          24/7
          Columns
          Education
          Company
          Careers
          About Us
          Contact Us
          Advertising
          Help Center
          Feedback
          User Agreement
          Privacy Policy
          Business

          White Label

          Data API

          Web Plug-ins

          Poster Maker

          Affiliate Program

          Risk Disclosure

          The risk of loss in trading financial instruments such as stocks, FX, commodities, futures, bonds, ETFs and crypto can be substantial. You may sustain a total loss of the funds that you deposit with your broker. Therefore, you should carefully consider whether such trading is suitable for you in light of your circumstances and financial resources.

          No decision to invest should be made without thoroughly conducting due diligence by yourself or consulting with your financial advisors. Our web content might not suit you since we don't know your financial conditions and investment needs. Our financial information might have latency or contain inaccuracy, so you should be fully responsible for any of your trading and investment decisions. The company will not be responsible for your capital loss.

          Without getting permission from the website, you are not allowed to copy the website's graphics, texts, or trademarks. Intellectual property rights in the content or data incorporated into this website belong to its providers and exchange merchants.

          Not Logged In

          Log in to access more features

          FastBull Membership

          Not yet

          Purchase

          Become a signal provider
          Help Center
          Customer Service
          Dark Mode
          Price Up/Down Colors

          Log In

          Sign Up

          Position
          Layout
          Fullscreen
          Default to Chart
          The chart page opens by default when you visit fastbull.com