• Trade
  • Markets
  • Copy
  • Contests
  • News
  • 24/7
  • Calendar
  • Q&A
  • Chats
Trending
Screeners
SYMBOL
LAST
BID
ASK
HIGH
LOW
NET CHG.
%CHG.
SPREAD
SPX
S&P 500 Index
6827.42
6827.42
6827.42
6899.86
6801.80
-73.58
-1.07%
--
DJI
Dow Jones Industrial Average
48458.04
48458.04
48458.04
48886.86
48334.10
-245.98
-0.51%
--
IXIC
NASDAQ Composite Index
23195.16
23195.16
23195.16
23554.89
23094.51
-398.69
-1.69%
--
USDX
US Dollar Index
97.950
98.030
97.950
98.500
97.950
-0.370
-0.38%
--
EURUSD
Euro / US Dollar
1.17394
1.17409
1.17394
1.17496
1.17192
+0.00011
+ 0.01%
--
GBPUSD
Pound Sterling / US Dollar
1.33707
1.33732
1.33707
1.33997
1.33419
-0.00148
-0.11%
--
XAUUSD
Gold / US Dollar
4299.39
4299.39
4299.39
4353.41
4257.10
+20.10
+ 0.47%
--
WTI
Light Sweet Crude Oil
57.233
57.485
57.233
58.011
56.969
-0.408
-0.71%
--

Community Accounts

Signal Accounts
--
Profit Accounts
--
Loss Accounts
--
View More

Become a signal provider

Sell trading signals to earn additional income

View More

Guide to Copy Trading

Get started with ease and confidence

View More

Signal Accounts for Members

All Signal Accounts

Best Return
  • Best Return
  • Best P/L
  • Best MDD
Past 1W
  • Past 1W
  • Past 1M
  • Past 1Y

All Contests

  • All
  • Trump Updates
  • Recommend
  • Stocks
  • Cryptocurrencies
  • Central Banks
  • Featured News
Top News Only
Share

Ukraine Says It Received 114 Prisoners From Belarus

Share

USA Embassy In Lithuania: Maria Kalesnikava Is Not Going To Vilnius

Share

USA Embassy In Lithuania: Other Prisoners Are Being Sent From Belarus To Ukraine

Share

Ukraine President Zelenskiy: Five Ukrainians Released By Belarus In US-Brokered Deal

Share

USA Vilnius Embassy: USA Stands Ready For "Additional Engagement With Belarus That Advances USA Interests"

Share

USA Vilnius Embassy: Belarus, USA, Other Citizens Among The Prisoners Released Into Lithuania

Share

USA Vilnius Embassy: USA Will Continue Diplomatic Efforts To Free The Remaining Political Prisoners In Belarus

Share

USA Vilnius Embassy: Belarus Releases 123 Prisoners Following Meeting Of President Trump's Envoy Coale And Belarus President Lukashenko

Share

USA Vilnius Embassy: Masatoshi Nakanishi, Aliaksandr Syrytsa Are Among The Prisoners Released By Belarus

Share

USA Vilnius Embassy: Maria Kalesnikava And Viktor Babaryka Are Among The Prisoners Released By Belarus

Share

USA Vilnius Embassy: Nobel Peace Prize Laureate Ales Bialiatski Is Among The Prisoners Released By Belarus

Share

Belarusian Presidential Administration Telegram Channel: Lukashenko Has Pardoned 123 Prisoners As Part Of Deal With US

Share

Two Local Syrian Officials: Joint US-Syrian Military Patrol In Central Syria Came Under Fire From Unknown Assailants

Share

Israeli Military Says It Targeted 'Key Hamas Terrorist' In Gaza City

Share

Rwanda's Actions In Eastern Drc Are A Clear Violation Of Washington Accords Signed By President Trump - Secretary Of State Rubio

Share

Israeli Military Issues Evacuation Warning In Southern Lebanon Village Ahead Of Strike - Spokesperson On X

Share

Belarusian State Media Cites US Envoy Coale As Saying He Discussed Ukraine And Venezuela With Lukashenko

Share

Belarusian State Media Cites US Envoy Coale As Saying That US Removes Sanctions On Belarusian Potassium

Share

Thai Prime Minister: No Ceasefire Agreement With Cambodia

Share

US, Ukraine To Discuss Ceasefire In Berlin Ahead Of European Summit

TIME
ACT
FCST
PREV
U.K. Trade Balance Non-EU (SA) (Oct)

A:--

F: --

P: --

U.K. Trade Balance (Oct)

A:--

F: --

P: --

U.K. Services Index MoM

A:--

F: --

P: --

U.K. Construction Output MoM (SA) (Oct)

A:--

F: --

P: --

U.K. Industrial Output YoY (Oct)

A:--

F: --

P: --

U.K. Trade Balance (SA) (Oct)

A:--

F: --

P: --

U.K. Trade Balance EU (SA) (Oct)

A:--

F: --

P: --

U.K. Manufacturing Output YoY (Oct)

A:--

F: --

P: --

U.K. GDP MoM (Oct)

A:--

F: --

P: --

U.K. GDP YoY (SA) (Oct)

A:--

F: --

P: --

U.K. Industrial Output MoM (Oct)

A:--

F: --

P: --

U.K. Construction Output YoY (Oct)

A:--

F: --

P: --

France HICP Final MoM (Nov)

A:--

F: --

P: --

China, Mainland Outstanding Loans Growth YoY (Nov)

A:--

F: --

P: --

China, Mainland M2 Money Supply YoY (Nov)

A:--

F: --

P: --

China, Mainland M0 Money Supply YoY (Nov)

A:--

F: --

P: --

China, Mainland M1 Money Supply YoY (Nov)

A:--

F: --

P: --

India CPI YoY (Nov)

A:--

F: --

P: --

India Deposit Gowth YoY

A:--

F: --

P: --

Brazil Services Growth YoY (Oct)

A:--

F: --

P: --

Mexico Industrial Output YoY (Oct)

A:--

F: --

P: --

Russia Trade Balance (Oct)

A:--

F: --

P: --

Philadelphia Fed President Henry Paulson delivers a speech
Canada Building Permits MoM (SA) (Oct)

A:--

F: --

P: --

Canada Wholesale Sales YoY (Oct)

A:--

F: --

P: --

Canada Wholesale Inventory MoM (Oct)

A:--

F: --

P: --

Canada Wholesale Inventory YoY (Oct)

A:--

F: --

P: --

Canada Wholesale Sales MoM (SA) (Oct)

A:--

F: --

P: --

Germany Current Account (Not SA) (Oct)

A:--

F: --

P: --

U.S. Weekly Total Rig Count

A:--

F: --

P: --

U.S. Weekly Total Oil Rig Count

A:--

F: --

P: --

Japan Tankan Large Non-Manufacturing Diffusion Index (Q4)

--

F: --

P: --

Japan Tankan Small Manufacturing Outlook Index (Q4)

--

F: --

P: --

Japan Tankan Large Non-Manufacturing Outlook Index (Q4)

--

F: --

P: --

Japan Tankan Large Manufacturing Outlook Index (Q4)

--

F: --

P: --

Japan Tankan Small Manufacturing Diffusion Index (Q4)

--

F: --

P: --

Japan Tankan Large Manufacturing Diffusion Index (Q4)

--

F: --

P: --

Japan Tankan Large-Enterprise Capital Expenditure YoY (Q4)

--

F: --

P: --

U.K. Rightmove House Price Index YoY (Dec)

--

F: --

P: --

China, Mainland Industrial Output YoY (YTD) (Nov)

--

F: --

P: --

China, Mainland Urban Area Unemployment Rate (Nov)

--

F: --

P: --

Saudi Arabia CPI YoY (Nov)

--

F: --

P: --

Euro Zone Industrial Output YoY (Oct)

--

F: --

P: --

Euro Zone Industrial Output MoM (Oct)

--

F: --

P: --

Canada Existing Home Sales MoM (Nov)

--

F: --

P: --

Euro Zone Total Reserve Assets (Nov)

--

F: --

P: --

U.K. Inflation Rate Expectations

--

F: --

P: --

Canada National Economic Confidence Index

--

F: --

P: --

Canada New Housing Starts (Nov)

--

F: --

P: --

U.S. NY Fed Manufacturing Employment Index (Dec)

--

F: --

P: --

U.S. NY Fed Manufacturing Index (Dec)

--

F: --

P: --

Canada Core CPI YoY (Nov)

--

F: --

P: --

Canada Manufacturing Unfilled Orders MoM (Oct)

--

F: --

P: --

Canada Manufacturing New Orders MoM (Oct)

--

F: --

P: --

Canada Core CPI MoM (Nov)

--

F: --

P: --

Canada Manufacturing Inventory MoM (Oct)

--

F: --

P: --

Canada CPI YoY (Nov)

--

F: --

P: --

Canada CPI MoM (Nov)

--

F: --

P: --

Canada CPI YoY (SA) (Nov)

--

F: --

P: --

Canada Core CPI MoM (SA) (Nov)

--

F: --

P: --

Q&A with Experts
    • All
    • Chatrooms
    • Groups
    • Friends
    Connecting
    .
    .
    .
    Type here...
    Add Symbol or Code

      No matching data

      All
      Trump Updates
      Recommend
      Stocks
      Cryptocurrencies
      Central Banks
      Featured News
      • All
      • Russia-Ukraine Conflict
      • Middle East Flashpoint
      • All
      • Russia-Ukraine Conflict
      • Middle East Flashpoint
      Search
      Products

      Charts Free Forever

      Chats Q&A with Experts
      Screeners Economic Calendar Data Tools
      Membership Features
      Data Warehouse Market Trends Institutional Data Policy Rates Macro

      Market Trends

      Market Sentiment Order Book Forex Correlations

      Top Indicators

      Charts Free Forever
      Markets

      News

      News Analysis 24/7 Columns Education
      From Institutions From Analysts
      Topics Columnists

      Latest Views

      Latest Views

      Trending Topics

      Top Columnists

      Latest Update

      Signals

      Copy Rankings Latest Signals Become a signal provider AI Rating
      Contests
      Brokers

      Overview Brokers Assessment Rankings Regulators News Claims
      Broker listing Forex Brokers Comparison Tool Live Spread Comparison Scam
      Q&A Complaint Scam Alert Videos Tips to Detect Scam
      More

      Business
      Events
      Careers About Us Advertising Help Center

      White Label

      Data API

      Web Plug-ins

      Affiliate Program

      Awards Institution Evaluation IB Seminar Salon Event Exhibition
      Vietnam Thailand Singapore Dubai
      Fans Party Investment Sharing Session
      FastBull Summit BrokersView Expo
      Recent Searches
        Top Searches
          Markets
          News
          Analysis
          User
          24/7
          Economic Calendar
          Education
          Data
          • Names
          • Latest
          • Prev

          View All

          No data

          Scan to Download

          Faster Charts, Chat Faster!

          Download App
          English
          • English
          • Español
          • العربية
          • Bahasa Indonesia
          • Bahasa Melayu
          • Tiếng Việt
          • ภาษาไทย
          • Français
          • Italiano
          • Türkçe
          • Русский язык
          • 简中
          • 繁中
          Open Account
          Search
          Products
          Charts Free Forever
          Markets
          News
          Signals

          Copy Rankings Latest Signals Become a signal provider AI Rating
          Contests
          Brokers

          Overview Brokers Assessment Rankings Regulators News Claims
          Broker listing Forex Brokers Comparison Tool Live Spread Comparison Scam
          Q&A Complaint Scam Alert Videos Tips to Detect Scam
          More

          Business
          Events
          Careers About Us Advertising Help Center

          White Label

          Data API

          Web Plug-ins

          Affiliate Program

          Awards Institution Evaluation IB Seminar Salon Event Exhibition
          Vietnam Thailand Singapore Dubai
          Fans Party Investment Sharing Session
          FastBull Summit BrokersView Expo

          Stocks Tick Up, Oil Falls As Uncertainty Reins On Middle East, Fed

          Olivia Brooks

          Economic

          Commodity

          Stocks

          Summary:

          Wall Street indexes posted modest gains and oil prices dipped on Wednesday as investors weighed the impacts of a Middle East conflict and a U.S. rate decision on a global economy already grappling with uncertainty stemming from U.S. economic policy.Brent crude oil prices initially extended their recent rise as the Israel-Iran air war entered its sixth day, feeding concerns over global oil supply, before falling 1.52% to $75.31 per barrel after U.S. President Donald Trump said Iran wanted to negotiate.

          Wall Street indexes posted modest gains and oil prices dipped on Wednesday as investors weighed the impacts of a Middle East conflict and a U.S. rate decision on a global economy already grappling with uncertainty stemming from U.S. economic policy.

          Brent crude oil prices initially extended their recent rise as the Israel-Iran air war entered its sixth day, feeding concerns over global oil supply, before falling 1.52% to $75.31 per barrel after U.S. President Donald Trump said Iran wanted to negotiate.

          Stock buyers made cautious inroads in early trading on Wall Street, giving a 0.50% push to both the Dow Jones Industrial Average and the S&P 500 (.SPX), and a 0.56% boost to the Nasdaq Composite (.IXIC).

          While geopolitics were the biggest immediate concern, other lingering doubts included a squabble over President Trump's tax bill, said Chris Maxey, Managing Director and Chief Market Strategist at New York-based Wealthspire.

          "Uncertainty began at the start of the year, and it felt like it just kept growing ... It's uncertain about what's coming next with respect to the (U.S.) tax package, what's going to happen with the Federal Reserve, what's going to happen in the Middle East," he said.

          "People are trying to digest all of this information without a huge amount of clarity," Maxey added.

          Trump declined to answer questions on whether the U.S. was planning to strike Iran or its nuclear facilities, saying: "Nobody knows what I am going to do."

          Watch the Fed for clues

          The Fed is expected to keep its main funds rate steady on Wednesday in the 4.25%-4.50% range it has held since December. It is expected to issue projections, known as a dot plot, that signal it will not move decisively for months to come.

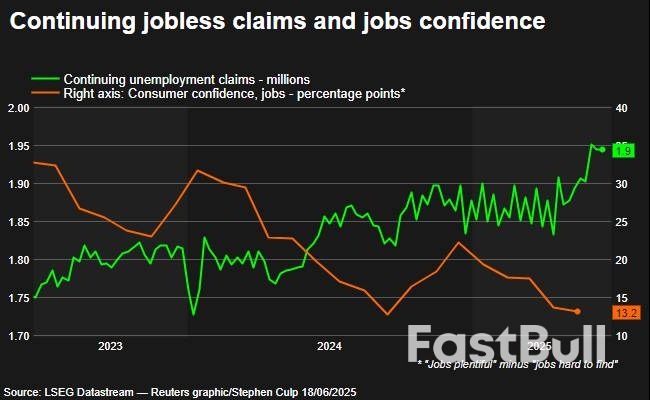
          Signs of fragility in the U.S. economy make for a challenging backdrop.

          U.S. retail sales fell by a larger-than-expected 0.9% in May, data showed on Tuesday, the biggest drop in four months, while labour market indicators are showing weakness.

          "Markets are going to be closely watching the Fed's quarterly dot plot for clues on how and when the central bank will resume its cutting cycle," Insight Investment co-head of global rates Harvey Bradley said.

          "As tensions in the Middle East have the potential to threaten the inflation picture further, it cannot be ruled out that projections adjust to reflect just one rate cut this year,” he added.

          U.S. Treasury yields fell again on Wednesday, continuing a slide on Tuesday prompted by investors calculating that geopolitical risks abroad were greater than the chances the U.S. debt pile becomes unmanageable.

          The benchmark 10-year note was last yielding 2.6 basis points less, at 4.365%, from 4.391% late on Tuesday.

          The two-year yield, which is more sensitive to changes in expectations for Fed interest rates, fell 1.1 basis points to 3.939%, from 3.95% late on Tuesday.

          Source: Kitco

          To stay updated on all economic events of today, please check out our Economic calendar
          Risk Warnings and Disclaimers
          You understand and acknowledge that there is a high degree of risk involved in trading. Following any strategies or investment methods may lead to potential losses. The content on the site is provided by our contributors and analysts for information purposes only. You are solely responsible for determining whether any trading assets, securities, strategy, or any other product is suitable for investing based on your own investment objectives and financial situation.
          Add to Favorites
          Share

          Gold price slightly down ahead of FOMC results

          Adam

          Commodity

          Gold prices are a bit lower and silver prices a bit higher in quieter early U.S. trading Wednesday. The marketplace awaits the Fed’s FOMC meeting that ends Wednesday afternoon with a statement and press conference from Fed Chair Powell. The Fed is not expected to cut interest rates. However, traders will closely scrutinize the FOMC statement and Fed Chair Powell’s comments in his press conference this afternoon. August gold was last down $4.70 at $3,402.20. July silver prices hit a 13-year high overnight and were last up $0.059 at $37.21.
          Asian and European stocks were mixed overnight. U.S. stock indexes are pointed to slightly higher openings today in New York. Risk aversion remains elevated at mid-week. Reports are saying President Trump is mulling striking Iranian nuclear sites with huge “bunker-buster” bombs, which many military analysts believe is necessary to set back Iran’s nuclear program for several years.
          Writes David Morrison of Trade Nation in a morning email dispatch: Despite the Israel-Iran military conflict that may bring in the U.S., “there has been no sense of panic from investors. Of course, as far as the U.S. is concerned, events are taking place a long way from home…. But there’s also a feeling that investors are betting on a short and sharp engagement, resulting in a more stable position across the Middle East than the one that currently exists. Perhaps that’s a matter of considering recent history. But if so, that’s quite an optimistic outlook. And the question must be: Does that factor in US military engagement or not?”
          The key outside markets today see the U.S. dollar index slightly down. Nymex crude oil futures prices are slightly higher and trading around $75.00 a barrel. The yield on the benchmark 10-year U.S. Treasury note is presently at 4.379%.
          Other U.S. economic data due for release Wednesday the weekly MBA mortgage applications survey, new residential construction, the weekly jobless claims report, the weekly DOE liquid energy stocks report and Treasury international capital data.
          Gold price slightly down ahead of FOMC results_1
          Technically, August gold futures bulls have the solid overall near-term technical advantage. Bulls’ next upside price objective is to produce a close above solid resistance at $3,500.00. Bears' next near-term downside price objective is pushing futures prices below solid technical support at the June low of $3,313.10. First resistance is seen at $3,427.70 and then at $3,450.00. First support is seen at this week’s low of $3,384.40 and then at $3,358.50. Wyckoff's Market Rating: 8.0.
          Gold price slightly down ahead of FOMC results_2
          July silver futures bulls have the solid overall near-term technical advantage and gained more power today. Prices are trending higher on the daily bar chart. Silver bulls' next upside price objective is closing prices above solid technical resistance at $40.00. The next downside price objective for the bears is closing prices below solid support at $35.00. First resistance is seen at $37.50 and then at $38.00. Next support is seen at $37.00 and then at $36.50. Wyckoff's Market Rating: 8.5.

          source : kitco

          Risk Warnings and Disclaimers
          You understand and acknowledge that there is a high degree of risk involved in trading. Following any strategies or investment methods may lead to potential losses. The content on the site is provided by our contributors and analysts for information purposes only. You are solely responsible for determining whether any trading assets, securities, strategy, or any other product is suitable for investing based on your own investment objectives and financial situation.
          Add to Favorites
          Share

          Bitcoin Eyes $105K Pre-FOMC as Trump Reveals Iran Asked for Dialogue

          Warren Takunda

          Cryptocurrency

          Key points:
          Bitcoin sees light relief as US President Trump reveals that Iran had been in touch.
          Trump calls Fed Chair Jerome Powell “stupid” as markets see no chance of an interest-rate cut at the June 18 FOMC meeting.
          Order books show BTC price action ripe for liquidity grabs.
          Bitcoin returned to $105,000 after the June 18 Wall Street open amid claims that Iran had “reached out” to the US for dialogue.Bitcoin Eyes $105K Pre-FOMC as Trump Reveals Iran Asked for Dialogue_1

          BTC/USD 1-hour chart. Source: Cointelegraph/TradingView

          Trump: Fed Chair Powell “stupid person” ahead of FOMC

          Data from Cointelegraph Markets Pro and TradingView showed BTC/USD reversing downside, which had taken it to lows of $103,857 on Bitstamp.
          Still highly sensitive to developments in the Iran-Israel conflict, Bitcoin sought relief from comments by US President Donald Trump that Iran had been in touch.
          “I said, ‘It’s very late,’” Trump told reporters during an appearance on the White House lawn, adding that he did not know how much longer the conflict might continue.
          Positive BTC price momentum built on US unemployment data, which broadly conformed to expectations, avoiding more uncertainty over inflation.
          Hours ahead of the Federal Reserve’s decision on interest rates, however, concerns lingered over the potential impact of US trade tariffs as well as the Middle East tensions and their effect on oil prices.
          “First tariffs, now missiles. This is no ordinary inflation fight,” trading resource QCP Capital summarized in its latest bulletin to Telegram channel subscribers on the day.
          “Our expectation is for the Fed to hold rates steady while striking a hawkish tone, acknowledging the fresh upside risks to inflation stemming from geopolitical instability.”

          Bitcoin Eyes $105K Pre-FOMC as Trump Reveals Iran Asked for Dialogue_2Fed target rate probabilities (screenshot). Source: CME Group FedWatch Tool

          QCP warned that the Fed reducing its forecast for the number of interest-rate cuts in 2025 would “likely pressure risk assets, including Bitcoin and broader digital assets, as liquidity expectations are pared back.”
          For his part, Trump reiterated existing demands for cuts, despite markets believing that they would not come until Q3.
          “$88 billion came in from tariffs; no inflation. I know what I’m doing,” he said, calling Fed Chair Jerome Powell a “stupid person.”

          Bitcoin liquidity stacks up into Fed decision

          Among Bitcoin traders, anticipation was brewing over a potential short squeeze, with the market positioned for further losses.
          “Market reacting so far positively off headlines of de-escalation (we see though),” popular trader Skew wrote in part of ongoing X analysis.
          “Orderbooks are skew towards bid depth - More bids closest to price vs asks. Perp positioning is pretty short with all the stacked defensive positioning here.”

          Bitcoin Eyes $105K Pre-FOMC as Trump Reveals Iran Asked for Dialogue_3BTC liquidation heatmap (screenshot). Source: CoinGlass

          Order book data from monitoring resource CoinGlass shows that the area around $103,000 is particularly primed to act as a short-term price magnet should a liquidity grab ensue.
          Fellow trader TheKingfisher nonetheless described a short liquidation event as “loading,” with asks in place between spot price and current all-time highs of $112,000.
          Bitcoin Eyes $105K Pre-FOMC as Trump Reveals Iran Asked for Dialogue_4

          Source: Cointelegraph

          Risk Warnings and Disclaimers
          You understand and acknowledge that there is a high degree of risk involved in trading. Following any strategies or investment methods may lead to potential losses. The content on the site is provided by our contributors and analysts for information purposes only. You are solely responsible for determining whether any trading assets, securities, strategy, or any other product is suitable for investing based on your own investment objectives and financial situation.
          Add to Favorites
          Share

          Oil analysts left scratching their heads over Israel-Iran conflict: ‘Your guess is as good as mine’

          Adam

          Commodity

          Middle East Situation

          Analysts are struggling to predict the extent to which Israel and Iran’s escalating conflict could influence oil prices.
          Israel’s surprise attack on Iran’s military and nuclear infrastructure on Friday has been followed by five days of spiraling warfare between the regional foes.
          U.S. President Donald Trump on Tuesday called for an “unconditional surrender” from Tehran, warning Washington’s patience was wearing thin. In response, Iran’s supreme leader Ayatollah Ali Khamenei threatened the U.S. with “irreparable damage” in the event of a military intervention, according to NBC News reporting.
          Energy markets are weighing the likelihood of direct U.S. involvement in the conflict, as well as the potential for major supply disruptions — particularly worst-case scenarios, such as Iran blocking the highly strategic Strait of Hormuz that links the Persian Gulf to the Gulf of Oman.
          John Evans, an analyst at oil broker PVM, said Wednesday that a “blanket of unease” had descended upon oil markets in recent days.
          “Our market is settling into a world where missile exchanges are commonplace but the cynicism of it being normal has yet to set in because of how easily the situation could escalate,” Evans said in a research note.
          Israel’s Bazan oil refinery complex sustained damage from an Iranian attack earlier this week, while an Israeli airstrike at the South Pars field, the world’s largest gas field, prompted Tehran to partially suspend production. The South Pars gas field is shared between Iran and Qatar.
          “The situation is as fluid as the underlying commodity it mostly affects and while there is a fraternal ‘your guess is [as] good as mine’ in future price divination, positioning will continue to be at least defensively long,” PVM’s Evans said.
          The chief executives of oil companies of TotalEnergies, Shell, and EnQuest told CNBC on Tuesday that further attacks on critical energy infrastructure could have serious consequences for global supply and prices.

          ‘It is a roulette’

          Oil prices, which have jumped in recent days, extended gains on Wednesday.
          International benchmark Brent crude futures with August delivery traded 0.3% higher at $76.69 per barrel at 2:02 p.m. London time. U.S. West Texas Intermediate futures with July delivery, meanwhile, traded up 0.5% at $75.25 per barrel.
          Per Lekander, founder of investment management firm Clean Energy Transition, described the situation for oil markets ahead of Israel’s attack on Iran last week as “bad,” given plentiful supply growth from OPEC and non-OPEC producers and soft demand.
          “I was increasingly convinced we were heading for a 2014/2020 reset lower to $30-50 to get capex down and start a new cycle. In fact, the current conflict makes that outcome even more likely when [the] conflict is over as producers are now producing and hedging as much as they can,” Lekander said in a note.
          “While this is going on it is a roulette. We have a $10 [per barrel] risk premium in the price which is fair given that there clearly are some interruptions (mainly Iran exports and some lower tanker loadings),” he added.

          What next for oil prices?

          Looking ahead, Stephen Schork, editor of The Schork Report, on Wednesday said that a significant escalation in the Israel-Iran conflict could push oil prices substantially higher.
          “We’re kind of stabilizing right now. I think we’re waiting for that next headline to come out and really, I think that anyone who does not think oil could go higher, I really think they are trading on hope and not reality,” Schork told CNBC’s “Access Middle East.”
          “We are now facing the biggest threat to the oil markets since Iraq invaded Kuwait in 1990 and perhaps even greater than the 1974 Arab oil embargo,” he added.
          Schork said there was a roughly 5% chance of oil prices climbing to above $103 per barrel within the next five weeks, with much longer odds of crude soaring as high as $160 per barrel by the end of summer, if flows out of the Persian Gulf are seriously disrupted.

          Source: cnbc

          Risk Warnings and Disclaimers
          You understand and acknowledge that there is a high degree of risk involved in trading. Following any strategies or investment methods may lead to potential losses. The content on the site is provided by our contributors and analysts for information purposes only. You are solely responsible for determining whether any trading assets, securities, strategy, or any other product is suitable for investing based on your own investment objectives and financial situation.
          Add to Favorites
          Share

          US Labor Market Softening; Single-family Building Permits Slump

          Damon

          Economic

          The number of Americans filing new applications for unemployment benefits fell last week, but stayed at levels consistent with a further loss of labor market momentum in June and softening economic activity.

          The report from the Labor Department on Wednesday showed widespread layoffs in the prior week, which had boosted claims to an eight-month high. Though some technical factors accounted for the elevation in claims, layoffs have risen this year, with economists saying President Donald Trump's broad tariffs had created a challenging economic environment for businesses.

          Those challenges were also evident in other data showing permits for future construction of single-family housing dropped to a two-year low in May as builders grappled with higher costs from duties on materials, including lumber, steel and aluminum.

          Higher borrowing costs as the Federal Reserve responded to the heightened economic uncertainty from tariffs by pausing its interest rate cutting cycle have weighed on demand for homes, resulting in excess inventory of unsold houses on the market.

          Fed officials at the end of a two-day policy meeting later on Wednesday were expected to leave the U.S. central bank's benchmark overnight interest rate in the 4.25%-4.50% range, where it has been since December, as it also monitored the economic fallout from the conflict between Israel and Iran.

          "Even though claims remain low by historical standards, we can no longer deny that there is some upward movement toward levels that would support our assessment of an economy slowing into a contraction," said Carl Weinberg, chief economist at High Frequency Economics. "It is time, now, to say that."

          Initial claims for state unemployment benefits dropped 5,000 to a seasonally adjusted 245,000 for the week ended June 14, the Labor Department said. Data for the prior week was revised to show 2,000 more applications received than previously reported, lifting claims for that week to the highest since October.

          Economists polled by Reuters had forecast 245,000 claims for the latest week. The report was released a day early because of the Juneteenth National Independence Day holiday on Thursday.

          Layoffs were reported in the prior week across several states in the transportation and warehousing, accommodation and food services, healthcare and social assistance, agriculture, construction and manufacturing industries as well as in wholesale, retail trade, administrative, professional, arts, entertainment, and recreation industries.

          Claims rose in Minnesota in the prior week as non-teaching staff filed for benefits at the start of summer school holidays. Filings in the state increased further last week. There were also rises in applications in Pennsylvania and Oregon.

          The claims data covered the period during which the government surveyed businesses for the nonfarm payrolls component of June's employment report. Claims increased between the May and June survey weeks.

          Historically low layoffs have accounted for much of the labor market stability, with the hiring side of the equation tepid amid hesitancy by employers to increase headcount because of the unsettled economic environment. Nonfarm payrolls increased by 139,000 jobs in May, compared with a 193,000 gain a year ago.

          Data next week on the number of people receiving benefits after an initial week of aid, a proxy for hiring, could shed more light on the state of the labor market in June.

          The so-called continuing claims dropped 6,000 to a still-high seasonally adjusted 1.945 million during the week ending June 7. Recently laid-off workers are struggling to find work.

          The dollar fell against a basket of currencies. U.S. Treasury yields eased.

          Continuing claims and jobs confidence

          HOUSING SUBDUED

          A separate report from the Commerce Department's Census Bureau showed permits for future construction of single-family housing dropped 2.7% to a seasonally adjusted annual rate of 898,000 units in May, the lowest level since April 2023.

          Higher borrowing costs have sidelined potential buyers, boosting the supply of new single-family homes on the market to levels last seen in late 2007. That has left builders with little incentive to break ground on new housing projects.

          A line chart titled "US mortgage rates" that tracks the metric over time

          A National Association of Home Builders survey on Tuesday showed sentiment among single-family homebuilders plummeted to a 2-1/2-year low in June. The NAHB reported an increase in the share of builders cutting prices to lure buyers and reduce inventory. It forecast a drop in single-family starts this year.

          Permits for the volatile multi-family housing segment, buildings with five units or more, rose 1.4% to a rate of 444,000 units in May. Overall building permits decreased 2.0% to a rate of 1.393 million units, the lowest level since June 2020.

          Single-family housing starts, which account for the bulk of homebuilding, gained 0.4% to 924,000 units last month. Starts for multi-family housing units slumped 30.4% to a rate of 316,000 units. Overall housing starts plunged 9.8% to a rate of 1.256 million units, the lowest level in five years.

          Housing starts and building permits

          Residential investment, which includes homebuilding, contracted slightly in the first quarter after rebounding in 2024 following steep declines in the prior two years caused by a surge in mortgage rates.

          "We appear on course for a substantial decline in real activity in the current quarter and perhaps further weakness in the summer," said Stephen Stanley, chief U.S. economist at Santander U.S. Capital Markets.

          Source: Reuters

          To stay updated on all economic events of today, please check out our Economic calendar
          Risk Warnings and Disclaimers
          You understand and acknowledge that there is a high degree of risk involved in trading. Following any strategies or investment methods may lead to potential losses. The content on the site is provided by our contributors and analysts for information purposes only. You are solely responsible for determining whether any trading assets, securities, strategy, or any other product is suitable for investing based on your own investment objectives and financial situation.
          Add to Favorites
          Share

          Spot gold at $3,387/oz after U.S. housing starts fall -9.8% in May

          Adam

          Commodity

          Gold prices are trading near flat on the session this morning after the latest U.S. data showed a deteriorating housing market last month.
          Housing starts fell 9.8% in May to a seasonally adjusted annual rate of 1.256 million units, the Commerce Department announced on Wednesday. The data was far worse than expected, as economists looked for only a slight decrease of -0.8% to 1.360 million units. April saw a revised increase of 2.7% to 1.392 million units.
          This was the lowest reading since May 2020, during the onset of the COVID-19 outbreak.
          For the year, housing construction is down 4.6% from the May 2024 rate of 1.316 million
          The report said that building permits for future homebuilding fell -2.0% to a rate of 1.393 million last month, which was lower than the consensus expectation for 1.430 million permits. April’s print was revised to -4.0% and 1.422 million units. For the year, building permit issuances were 1.0% below the May 2024 rate of 1,407,000.
          The gold market is holding steady following the 8:30 am EST housing data, which was released at the same time as weekly jobless claims. Spot gold last traded at $3,387.79 per ounce for a slight loss of 0.02% on the day.
          Spot gold at $3,387/oz after U.S. housing starts fall -9.8% in May_1
          The U.S. housing sector contributes significantly to the nation's Gross Domestic Product, and it remains a significant drag on the economy as persistent higher prices and elevated mortgage rates from the Federal Reserve's aggressive tightening cycle have pushed many new homebuyers out of the market.

          Source: kitco

          Risk Warnings and Disclaimers
          You understand and acknowledge that there is a high degree of risk involved in trading. Following any strategies or investment methods may lead to potential losses. The content on the site is provided by our contributors and analysts for information purposes only. You are solely responsible for determining whether any trading assets, securities, strategy, or any other product is suitable for investing based on your own investment objectives and financial situation.
          Add to Favorites
          Share

          Israel Running Low on Missile Interceptors As Iran Proves A Stronger Foe Than Expected

          Michelle

          Political

          Following multiple rounds of Iranian missile barrages that have proven far more effective than many "experts" anticipated, the Israeli Defense Forces are already running low on defensive Arrow interceptor missiles, making Israel all the more desperate for the United States to join the war Prime Minister Benjamin Netanyahu's government initiated on Friday the 13th. Meanwhile, as Iran's retaliation continues, reports of war-fatigue among Israel's population are already emerging.

          Interceptor missiles in the sky over Tel Aviv during an early-Wednesday Iranian barrage (Leo Correa via Associated Press)

          Against that backdrop, President Trump has been dialing up the intensity of his rhetoric as he pushes Iran to capitulate to demands that it cease all uranium enrichment -- a demand that Iran has long ruled out as a violation of its sovereignty, while insisting its nuclear program isn't focused on creating a weapon. The US intelligence community assessed that to be true in March. "UNCONDITIONAL SURRENDER!" exclaimed Trump in a terse Tuesday social media post. Trump, who spoke with Netanyahu by phone on Tuesday, is considering options that include a US strike on Iran, the Wall Street Journal reports. As his deliberations continue -- while some members of Congress are backing a resolution that would bar a US attack without congressional authorization -- the Pentagon continues shifting a variety of assets toward the region. The DOD insists they're for defensive use, which includes shielding Israel from the consequences of starting a war with Iran.

          According to an individual briefed on US and Israeli intelligence, Israel is on pace to run out of defensive missiles in 10 to 12 days. “They will need to select what they want to intercept,” that person told the Washington Post. “The system is already overwhelmed.” Arrow interceptors are manufactured by Israel Aerospace Industries. The United States has been pushing other missile defense assets into Israel over the last week, but the Wall Street Journal reports that practice is already raising concerns about the effect on US military readiness.

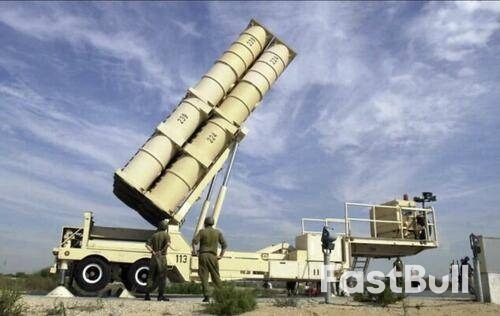
          Israel is running low on Arrow interceptor missiles fired from mobile launchers like this one (AP Photo: Eitan Hess-Ashkenazi)

          “Neither the U.S. nor the Israelis can continue to sit and intercept missiles all day,” Tom Karako of the Center for Strategic and International Studies (CSIS) told the Journal. “The Israelis and their friends need to move with all deliberate haste to do whatever needs to be done, because we cannot afford to sit and play catch.” (CSIS is funded in part by the US government and major weapons manufacturers.) According to Israeli financial newspaper The Marker, the ongoing missile defense is costing Israel about $285 million a night, though ZeroHedge readers will reasonably brace for the day that American taxpayers are presented with the bill.

          Even ahead of running out of interceptors, Israel is struggling to consistently defend its citizens and assets from Iran's arsenal, and especially its cutting-edge hypersonic missiles. Videos of the missiles repeatedly hammering Israel have been making jaws drop around the world and across social media since Iran began retaliating for Israel's unprovoked launch of a war on Iran.

          Iran's Islamic Revolution Guards Corps (IRGC) said that strikes over Tuesday night used "a new advanced missile." According to state media, the first-generation Fattah hypersonic ballistic missile has a two-stage solid-fuel system, a 1,400-kilometer range, a top speed of Mach 13-15, and a maximum time-to-target of just 336 seconds. Claiming it repeatedly and easily penetrated Israel's defenses, the IRGC boasted that “tonight’s missile strike demonstrated that we have achieved total control over the skies of the occupied territories."

          Of course, there's also the question of how long Iran's inventory of offensive missiles can last -- but it's far from clear how much of the arsenal remains after accounting for missiles already launched and others destroyed by Israeli strikes. Iran's pace of strikes has reportedly eased over the past two nights. “Iran has to make a very, very difficult calculation, because they have a limited amount of missiles, and considering the rate of fire, they cannot replenish in real time,” said International Institute for Strategic Studies analyst Fabian Hinz told the Post. Working to accelerate the math to Iran's detriment, Israel said it struck missile factories on Tuesday, along with a centrifuge production center.

          As Israel runs low on defensive missiles, the Israeli population is already running low on the psychological wherewithal to carry on in the face of a level of bombardment the country hasn't seen in a generation. Dozens have been killed and several hundred wounded, alongside startling destruction of government buildings, apartment towers and power plants. In a quote that echoes the desperation of Palestinian and other populations on the receiving end of IDF destruction, Israeli nurse and mother Ella Keren told the Post, “The fact that you don’t know if the missiles are about to fall on you, that we are now living with this feeling of helplessness, it’s insane.” Weary of the nightly blasts and hours spent in bomb shelters, some Israelis are opting to leave Tel Aviv to seek refuge in the relatively safer suburbs and countryside.

          Source: Zero Hedge

          Risk Warnings and Disclaimers
          You understand and acknowledge that there is a high degree of risk involved in trading. Following any strategies or investment methods may lead to potential losses. The content on the site is provided by our contributors and analysts for information purposes only. You are solely responsible for determining whether any trading assets, securities, strategy, or any other product is suitable for investing based on your own investment objectives and financial situation.
          Add to Favorites
          Share
          FastBull
          Copyright © 2025 FastBull Ltd

          728 RM B 7/F GEE LOK IND BLDG NO 34 HUNG TO RD KWUN TONG KLN HONG KONG

          TelegramInstagramTwitterfacebooklinkedin
          App Store Google Play Google Play
          Products
          Charts

          Chats

          Q&A with Experts
          Screeners
          Economic Calendar
          Data
          Tools
          Membership
          Features
          Function
          Markets
          Copy Trading
          Latest Signals
          Contests
          News
          Analysis
          24/7
          Columns
          Education
          Company
          Careers
          About Us
          Contact Us
          Advertising
          Help Center
          Feedback
          User Agreement
          Privacy Policy
          Business

          White Label

          Data API

          Web Plug-ins

          Poster Maker

          Affiliate Program

          Risk Disclosure

          The risk of loss in trading financial instruments such as stocks, FX, commodities, futures, bonds, ETFs and crypto can be substantial. You may sustain a total loss of the funds that you deposit with your broker. Therefore, you should carefully consider whether such trading is suitable for you in light of your circumstances and financial resources.

          No decision to invest should be made without thoroughly conducting due diligence by yourself or consulting with your financial advisors. Our web content might not suit you since we don't know your financial conditions and investment needs. Our financial information might have latency or contain inaccuracy, so you should be fully responsible for any of your trading and investment decisions. The company will not be responsible for your capital loss.

          Without getting permission from the website, you are not allowed to copy the website's graphics, texts, or trademarks. Intellectual property rights in the content or data incorporated into this website belong to its providers and exchange merchants.

          Not Logged In

          Log in to access more features

          FastBull Membership

          Not yet

          Purchase

          Become a signal provider
          Help Center
          Customer Service
          Dark Mode
          Price Up/Down Colors

          Log In

          Sign Up

          Position
          Layout
          Fullscreen
          Default to Chart
          The chart page opens by default when you visit fastbull.com