• Trade
  • Markets
  • Copy
  • Contests
  • News
  • 24/7
  • Calendar
  • Q&A
  • Chats
Trending
Screeners
SYMBOL
LAST
BID
ASK
HIGH
LOW
NET CHG.
%CHG.
SPREAD
SPX
S&P 500 Index
6827.42
6827.42
6827.42
6899.86
6801.80
-73.58
-1.07%
--
DJI
Dow Jones Industrial Average
48458.04
48458.04
48458.04
48886.86
48334.10
-245.98
-0.51%
--
IXIC
NASDAQ Composite Index
23195.16
23195.16
23195.16
23554.89
23094.51
-398.69
-1.69%
--
USDX
US Dollar Index
97.950
98.030
97.950
98.500
97.950
-0.370
-0.38%
--
EURUSD
Euro / US Dollar
1.17394
1.17409
1.17394
1.17496
1.17192
+0.00011
+ 0.01%
--
GBPUSD
Pound Sterling / US Dollar
1.33707
1.33732
1.33707
1.33997
1.33419
-0.00148
-0.11%
--
XAUUSD
Gold / US Dollar
4299.39
4299.39
4299.39
4353.41
4257.10
+20.10
+ 0.47%
--
WTI
Light Sweet Crude Oil
57.233
57.485
57.233
58.011
56.969
-0.408
-0.71%
--

Community Accounts

Signal Accounts
--
Profit Accounts
--
Loss Accounts
--
View More

Become a signal provider

Sell trading signals to earn additional income

View More

Guide to Copy Trading

Get started with ease and confidence

View More

Signal Accounts for Members

All Signal Accounts

Best Return
  • Best Return
  • Best P/L
  • Best MDD
Past 1W
  • Past 1W
  • Past 1M
  • Past 1Y

All Contests

  • All
  • Trump Updates
  • Recommend
  • Stocks
  • Cryptocurrencies
  • Central Banks
  • Featured News
Top News Only
Share

China's Central Financial And Economic Affairs Commission Deputy Director: Will Expand Export And Increase Import In 2026

Share

Thai Leader Anutin: Landmine Blast That Killed Thai Soldiers 'Not A Roadside Accident'

Share

Thai Leader Anutin: Thailand To Continue Military Action Until 'We Feel No More Harm'

Share

Cambodian Prime Minister Hun Manet Says He Had Phone Calls With Trump And Malaysian Leader Anwar About Ceasefire

Share

Cambodia's Hun Manet Says USA, Malaysia Should Verify 'Which Side Fired First' In Latest Conflict

Share

Cambodia's Hun Manet: Cambodia Maintains Its Stance In Seeking Peaceful Resolution Of Disputes

Share

Nasdaq Companies: Allergan, Ferrovia, Insmed, Monolithic Power Systems, Seagate Technology, And Western Digital Will Be Added To The NASDAQ 100 Index. Biogen, CdW, GlobalFoundries, Lululemon, ON Semiconductor, And Tradedesk Will Be Removed From The NASDAQ 100 Index

Share

Witkoff Headed To Berlin This Weekend To Meet With Zelenskiy, European Leaders -Wsj Reporter On X

Share

Russia Attacks Two Ukrainian Ports, Damaging Three Turkish-Owned Vessels

Share

[Historic Flooding Occurs In At Least Four Rivers In Washington State Due To Days Of Torrential Rains] Multiple Areas In Washington State Have Been Hit By Severe Flooding Due To Days Of Torrential Rains, With At Least Four Rivers Experiencing Historic Flooding. Reporters Learned On The 12th That The Floods Caused By The Torrential Rains In Washington State Have Destroyed Homes And Closed Several Highways. Experts Warn That Even More Severe Flooding May Occur In The Future. A State Of Emergency Has Been Declared In Washington State

Share

Trump Says Proposed Free Economic Zone In Donbas Would Work

Share

Trump: I Think My Voice Should Be Heard

Share

Trump Says Will Be Choosing New Fed Chair In Near Future

Share

Trump Says Proposed Free Economic Zone In Donbas Complex But Would Work

Share

Trump Says Land Strikes In Venezuela Will Start Happening

Share

US President Trump: Thailand And Cambodia Are In A Good Situation

Share

State Media: North Korean Leader Kim Hails Troops Returning From Russia Mission

Share

The 10-year Treasury Yield Rose About 5 Basis Points During The "Fed Rate Cut Week," And The 2/10-year Yield Spread Widened By About 9 Basis Points. On Friday (December 12), In Late New York Trading, The Yield On The Benchmark 10-year US Treasury Note Rose 2.75 Basis Points To 4.1841%, A Cumulative Increase Of 4.90 Basis Points For The Week, Trading Within A Range Of 4.1002%-4.2074%. It Rose Steadily From Monday To Wednesday (before The Fed Announced Its Rate Cut And Treasury Bill Purchase Program), Subsequently Exhibiting A V-shaped Recovery. The 2-year Treasury Yield Fell 1.82 Basis Points To 3.5222%, A Cumulative Decrease Of 3.81 Basis Points For The Week, Trading Within A Range Of 3.6253%-3.4989%

Share

Trump: Lots Of Progress Being Made On Russia-Ukraine

Share

NOPA November US Soybean Crush Estimated At 220.285 Million Bushels

TIME
ACT
FCST
PREV
U.K. Trade Balance Non-EU (SA) (Oct)

A:--

F: --

P: --

U.K. Trade Balance (Oct)

A:--

F: --

P: --

U.K. Services Index MoM

A:--

F: --

P: --

U.K. Construction Output MoM (SA) (Oct)

A:--

F: --

P: --

U.K. Industrial Output YoY (Oct)

A:--

F: --

P: --

U.K. Trade Balance (SA) (Oct)

A:--

F: --

P: --

U.K. Trade Balance EU (SA) (Oct)

A:--

F: --

P: --

U.K. Manufacturing Output YoY (Oct)

A:--

F: --

P: --

U.K. GDP MoM (Oct)

A:--

F: --

P: --

U.K. GDP YoY (SA) (Oct)

A:--

F: --

P: --

U.K. Industrial Output MoM (Oct)

A:--

F: --

P: --

U.K. Construction Output YoY (Oct)

A:--

F: --

P: --

France HICP Final MoM (Nov)

A:--

F: --

P: --

China, Mainland Outstanding Loans Growth YoY (Nov)

A:--

F: --

P: --

China, Mainland M2 Money Supply YoY (Nov)

A:--

F: --

P: --

China, Mainland M0 Money Supply YoY (Nov)

A:--

F: --

P: --

China, Mainland M1 Money Supply YoY (Nov)

A:--

F: --

P: --

India CPI YoY (Nov)

A:--

F: --

P: --

India Deposit Gowth YoY

A:--

F: --

P: --

Brazil Services Growth YoY (Oct)

A:--

F: --

P: --

Mexico Industrial Output YoY (Oct)

A:--

F: --

P: --

Russia Trade Balance (Oct)

A:--

F: --

P: --

Philadelphia Fed President Henry Paulson delivers a speech
Canada Building Permits MoM (SA) (Oct)

A:--

F: --

P: --

Canada Wholesale Sales YoY (Oct)

A:--

F: --

P: --

Canada Wholesale Inventory MoM (Oct)

A:--

F: --

P: --

Canada Wholesale Inventory YoY (Oct)

A:--

F: --

P: --

Canada Wholesale Sales MoM (SA) (Oct)

A:--

F: --

P: --

Germany Current Account (Not SA) (Oct)

A:--

F: --

P: --

U.S. Weekly Total Rig Count

A:--

F: --

P: --

U.S. Weekly Total Oil Rig Count

A:--

F: --

P: --

Japan Tankan Large Non-Manufacturing Diffusion Index (Q4)

--

F: --

P: --

Japan Tankan Small Manufacturing Outlook Index (Q4)

--

F: --

P: --

Japan Tankan Large Non-Manufacturing Outlook Index (Q4)

--

F: --

P: --

Japan Tankan Large Manufacturing Outlook Index (Q4)

--

F: --

P: --

Japan Tankan Small Manufacturing Diffusion Index (Q4)

--

F: --

P: --

Japan Tankan Large Manufacturing Diffusion Index (Q4)

--

F: --

P: --

Japan Tankan Large-Enterprise Capital Expenditure YoY (Q4)

--

F: --

P: --

U.K. Rightmove House Price Index YoY (Dec)

--

F: --

P: --

China, Mainland Industrial Output YoY (YTD) (Nov)

--

F: --

P: --

China, Mainland Urban Area Unemployment Rate (Nov)

--

F: --

P: --

Saudi Arabia CPI YoY (Nov)

--

F: --

P: --

Euro Zone Industrial Output YoY (Oct)

--

F: --

P: --

Euro Zone Industrial Output MoM (Oct)

--

F: --

P: --

Canada Existing Home Sales MoM (Nov)

--

F: --

P: --

Euro Zone Total Reserve Assets (Nov)

--

F: --

P: --

U.K. Inflation Rate Expectations

--

F: --

P: --

Canada National Economic Confidence Index

--

F: --

P: --

Canada New Housing Starts (Nov)

--

F: --

P: --

U.S. NY Fed Manufacturing Employment Index (Dec)

--

F: --

P: --

U.S. NY Fed Manufacturing Index (Dec)

--

F: --

P: --

Canada Core CPI YoY (Nov)

--

F: --

P: --

Canada Manufacturing Unfilled Orders MoM (Oct)

--

F: --

P: --

Canada Manufacturing New Orders MoM (Oct)

--

F: --

P: --

Canada Core CPI MoM (Nov)

--

F: --

P: --

Canada Manufacturing Inventory MoM (Oct)

--

F: --

P: --

Canada CPI YoY (Nov)

--

F: --

P: --

Canada CPI MoM (Nov)

--

F: --

P: --

Canada CPI YoY (SA) (Nov)

--

F: --

P: --

Canada Core CPI MoM (SA) (Nov)

--

F: --

P: --

Q&A with Experts
    • All
    • Chatrooms
    • Groups
    • Friends
    Connecting
    .
    .
    .
    Type here...
    Add Symbol or Code

      No matching data

      All
      Trump Updates
      Recommend
      Stocks
      Cryptocurrencies
      Central Banks
      Featured News
      • All
      • Russia-Ukraine Conflict
      • Middle East Flashpoint
      • All
      • Russia-Ukraine Conflict
      • Middle East Flashpoint
      Search
      Products

      Charts Free Forever

      Chats Q&A with Experts
      Screeners Economic Calendar Data Tools
      Membership Features
      Data Warehouse Market Trends Institutional Data Policy Rates Macro

      Market Trends

      Market Sentiment Order Book Forex Correlations

      Top Indicators

      Charts Free Forever
      Markets

      News

      News Analysis 24/7 Columns Education
      From Institutions From Analysts
      Topics Columnists

      Latest Views

      Latest Views

      Trending Topics

      Top Columnists

      Latest Update

      Signals

      Copy Rankings Latest Signals Become a signal provider AI Rating
      Contests
      Brokers

      Overview Brokers Assessment Rankings Regulators News Claims
      Broker listing Forex Brokers Comparison Tool Live Spread Comparison Scam
      Q&A Complaint Scam Alert Videos Tips to Detect Scam
      More

      Business
      Events
      Careers About Us Advertising Help Center

      White Label

      Data API

      Web Plug-ins

      Affiliate Program

      Awards Institution Evaluation IB Seminar Salon Event Exhibition
      Vietnam Thailand Singapore Dubai
      Fans Party Investment Sharing Session
      FastBull Summit BrokersView Expo
      Recent Searches
        Top Searches
          Markets
          News
          Analysis
          User
          24/7
          Economic Calendar
          Education
          Data
          • Names
          • Latest
          • Prev

          View All

          No data

          Scan to Download

          Faster Charts, Chat Faster!

          Download App
          English
          • English
          • Español
          • العربية
          • Bahasa Indonesia
          • Bahasa Melayu
          • Tiếng Việt
          • ภาษาไทย
          • Français
          • Italiano
          • Türkçe
          • Русский язык
          • 简中
          • 繁中
          Open Account
          Search
          Products
          Charts Free Forever
          Markets
          News
          Signals

          Copy Rankings Latest Signals Become a signal provider AI Rating
          Contests
          Brokers

          Overview Brokers Assessment Rankings Regulators News Claims
          Broker listing Forex Brokers Comparison Tool Live Spread Comparison Scam
          Q&A Complaint Scam Alert Videos Tips to Detect Scam
          More

          Business
          Events
          Careers About Us Advertising Help Center

          White Label

          Data API

          Web Plug-ins

          Affiliate Program

          Awards Institution Evaluation IB Seminar Salon Event Exhibition
          Vietnam Thailand Singapore Dubai
          Fans Party Investment Sharing Session
          FastBull Summit BrokersView Expo

          Stocks at Record Highs: How Much Higher Can They Go?

          Adam

          Stocks

          Summary:

          Stocks hit record highs as the S&P 500 and Nasdaq 100 extend gains amid easing geopolitical tensions and tariff optimism. Despite overbought signals, no bearish patterns suggest an imminent reversal.

          The stock market extended its gains on Thursday, with the S&P 500 closing 0.80% higher and coming within reach of its February 19 record high of 6,147.43. Investor sentiment remained bullish, supported by the de-escalation of Middle East tensions and optimism surrounding potential new tariff-related agreements.
          This morning, the S&P 500 is expected to open 0.3% higher, potentially breaking into new all-time high territory.
          Investor sentiment has slightly improved, as reflected in the Wednesday’s AAII Investor Sentiment Survey, which reported that 35.1% of individual investors are bullish, while 40.3% are bearish.
          The S&P 500 continues its uptrend, as the daily chart indicates.
          Stocks at Record Highs: How Much Higher Can They Go?_1

          Nasdaq 100 Hits New Records

          The Nasdaq 100 led Thursday’s gains, rising 0.94% to a new record high of 22,466.99. Key support is now around the 22,220 level. While no immediate technical sell signals are evident, the index may be entering overbought territory, suggesting the potential for short-term consolidation.
          Stocks at Record Highs: How Much Higher Can They Go?_2

          Volatility Drops Further

          The Volatility Index (VIX) fell to a local low of 16.11 on Thursday – the lowest level since February 21 – confirming the recent equity rally and signaling calmer market conditions.
          Historically, a dropping VIX indicates less fear in the market, and rising VIX accompanies stock market downturns. However, the lower the VIX, the higher the probability of the market’s downward reversal. Conversely, the higher the VIX, the higher the probability of the market’s upward reversal.
          Stocks at Record Highs: How Much Higher Can They Go?_3
          S&P 500 Futures Contract: Above 6,200
          This morning, the S&P 500 futures contract is trading higher this morning, extending the market’s uptrend and reaching new all-time highs above the 6,200 level. Support is now around 6,150, marked by the recent consolidation area.
          Markets remain highly sensitive to geopolitical developments and could stay volatile in the near term.
          Stocks at Record Highs: How Much Higher Can They Go?_4

          Conclusion

          The S&P 500 is set to open 0.3% higher today, likely breaking its February 19 record and fully recovering from the earlier tariff-related sell-off.
          I think that in the short term, overbought technical conditions may lead to a period of consolidation or a mild pullback. However, no clear bearish signals are currently evident.

          Source: fxempire

          Risk Warnings and Disclaimers
          You understand and acknowledge that there is a high degree of risk involved in trading. Following any strategies or investment methods may lead to potential losses. The content on the site is provided by our contributors and analysts for information purposes only. You are solely responsible for determining whether any trading assets, securities, strategy, or any other product is suitable for investing based on your own investment objectives and financial situation.
          Add to Favorites
          Share

          Ethereum Chart Signals ‘Altseason’ as Analysts Predict $10K ETH Price Top

          Warren Takunda

          Cryptocurrency

          Key takeaways:
          Ether’s technical breakouts suggest ETH price may hit $10,000 this cycle.
          Altcoin Season Index says it’s prime time to accumulate “lagging” altcoins.
          Bitcoin dominance nearing 70% could trigger a full-blown altseason soon.
          Ether’s technical setup suggests that the altcoin is poised for sharp price gains that could mark the start of an “altseason” over the next few weeks or months.

          ETH price could top $10,000 this cycle - Analyst

          Technical analysis using the Wyckoff method points to a potential Ethereum price breakout to the $3,200 mark, according to crypto analyst Mikybull.
          “Ethereum is done with ‘test’ on Wycoff reaccumulation schematic,” the analyst wrote in a June 26 post on X, adding:Ethereum Chart Signals ‘Altseason’ as Analysts Predict $10K ETH Price Top_1

          “Big rally incoming.”ETH/USD daily chart. Source: Mickybull Crypto

          Fellow XForceGlobal shared a similar bullish outlook for ETH, pointing out that Ethereum was “looking to shoot” to all-time highs this cycle.
          The recent move to $2,800 was “objectively bullish,” backed with real-time data, the analyst said in a Thursday post on X.
          An accompanying chart showed an Elliott Wave analysis projecting a possible breakout to $9,400.
          “ETH is still looking to shoot for new ATHs this cycle and should end around $9,000-$10,000, give or take.”

          Ethereum Chart Signals ‘Altseason’ as Analysts Predict $10K ETH Price Top_2ETH/USD weekly chart. Source: XForceGlobal

          Several analysts have made similar projections, targeting $10,000 and above per ETH, citing historical fractals, increased institutional demand via Ethereum ETFs, and other factors.

          Prepare for altseason: Analyst

          The Altcoin Season Index, a metric used to measure the performance of non-Bitcoin cryptocurrencies (ie, altcoins) in the cryptocurrency market, suggests now is the time to get into altcoins.
          “The Altcoin Season Index is flashing signs of opportunity,” founder and CEO of Alphractal, Joao Wedson, said in a June 26 post on X, adding, “Make sure you are prepared.”
          Bitcoin has outperformed altcoins over the last 60 days, with the altcoin season index in the green zone below 20%.
          Wedson explained that this is not “necessarily bad,” arguing that “it could be a great chance to accumulate altcoins while they’re still lagging.”
          The chart below shows that every time the index rose above 20%, it rose sharply over a short time, topping 80% as “lagging” altcoins started to outperform Bitcoin. Ethereum Chart Signals ‘Altseason’ as Analysts Predict $10K ETH Price Top_3

          Altcoin season index vs. Bitcoin. Source: Alphractal

          Wedson said:
          “History shows these cycles repeat — a reaction may be coming soon.”

          ”Wen altseason?”

          Bitcoin dominance—a metric measuring Bitcoin’s market share relative to the overall crypto market—is one of the indicators commonly used to indicate whether the altseason has begun. It can provide traders with the overall investor sentiment and risk appetite in the market.
          At the time of publication, BTC dominance is at 65.77% maintaining the uptrend, indicating that it is still “Bitcoin season.”
          Historically, a “full-blown altseason” comes once Bitcoin dominance hits areas above 70% and then drops significantly, as highlighted by Mikybull Crypto.

          “A full-blown altseason probably begins from this point.”Ethereum Chart Signals ‘Altseason’ as Analysts Predict $10K ETH Price Top_4Bitcoin Market Dominance. Source: Mikybull Crypto

          Popular crypto analyst Rekt Capital says BTC dominance is 5.5% away from revisiting the 71% level for the first time since January 2021, a move that has historically taken one to two months “after a successful retest of 64% as support.”
          Ethereum Chart Signals ‘Altseason’ as Analysts Predict $10K ETH Price Top_5

          Source: Rekt Capital

          “Bitcoin dominance about to fall over the coming weeks,” said pseudonymous analyst The Chart Degen in a June 27 post on X, adding:
          “Pick the right altcoins and make a disgusting amount of money over the coming months.”

          Source: Cointelegraph

          Risk Warnings and Disclaimers
          You understand and acknowledge that there is a high degree of risk involved in trading. Following any strategies or investment methods may lead to potential losses. The content on the site is provided by our contributors and analysts for information purposes only. You are solely responsible for determining whether any trading assets, securities, strategy, or any other product is suitable for investing based on your own investment objectives and financial situation.
          Add to Favorites
          Share

          XAU/USD: Gold Loses Ground On Fading Safe Haven Demand

          Golden Gleam

          Commodity

          Economic

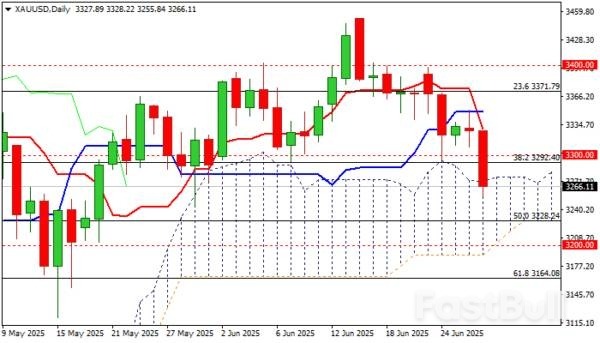
          Gold accelerated lower (down almost 2%) on Friday after losing solid supports at $3300 zone, which previously contained several attacks.

          The metal lost ground on sharply fading geopolitical tensions, as well as growing positive signs of final US-China trade deal that significantly deflated safe haven demand.

          Gold is on track for the second consecutive weekly loss with formation of inverted hammer candle on monthly chart adding to concerns that larger bulls may be running out of steam.

          The notion is supported by still strongly overbought monthly RSI and stochastic already out of overbought territory, with weekly indicators being in steep decline and significantly weaker daily studies (14-d momentum is diving deeper into negative territory / daily Tenkan/Kijun-sen created bear cross / price penetrated through the top of daily Ichimoku cloud).

          Gold hit one-month low on Friday, with close within the cloud today, to confirm signal and keep the downside exposed, as the latest fall pushed the price into lower zone of larger consolidation range ($3500/$3120)

          Bears eye targets at $3228 (50% retracement of $2956/$3500 rally) and $3203/00 (daily cloud base / psychological).

          Meanwhile, corrective upticks (Friday partial profit taking) are likely to be limited, with cloud top ($3276) offering immediate resistance and $3000 to ideally cap and keep fresh bears intact.

          Only return and weekly close above $3300 would question bears (scenario of false break lower and bear-trap formation).

          Res: 3276; 3300; 3329; 3350.Sup: 3250; 3228; 3200; 3164.

          Source: ACTIONFOREX

          To stay updated on all economic events of today, please check out our Economic calendar
          Risk Warnings and Disclaimers
          You understand and acknowledge that there is a high degree of risk involved in trading. Following any strategies or investment methods may lead to potential losses. The content on the site is provided by our contributors and analysts for information purposes only. You are solely responsible for determining whether any trading assets, securities, strategy, or any other product is suitable for investing based on your own investment objectives and financial situation.
          Add to Favorites
          Share

          EU, US Confident They’ll Reach Tariff Deal By July Deadline

          James Whitman

          Economic

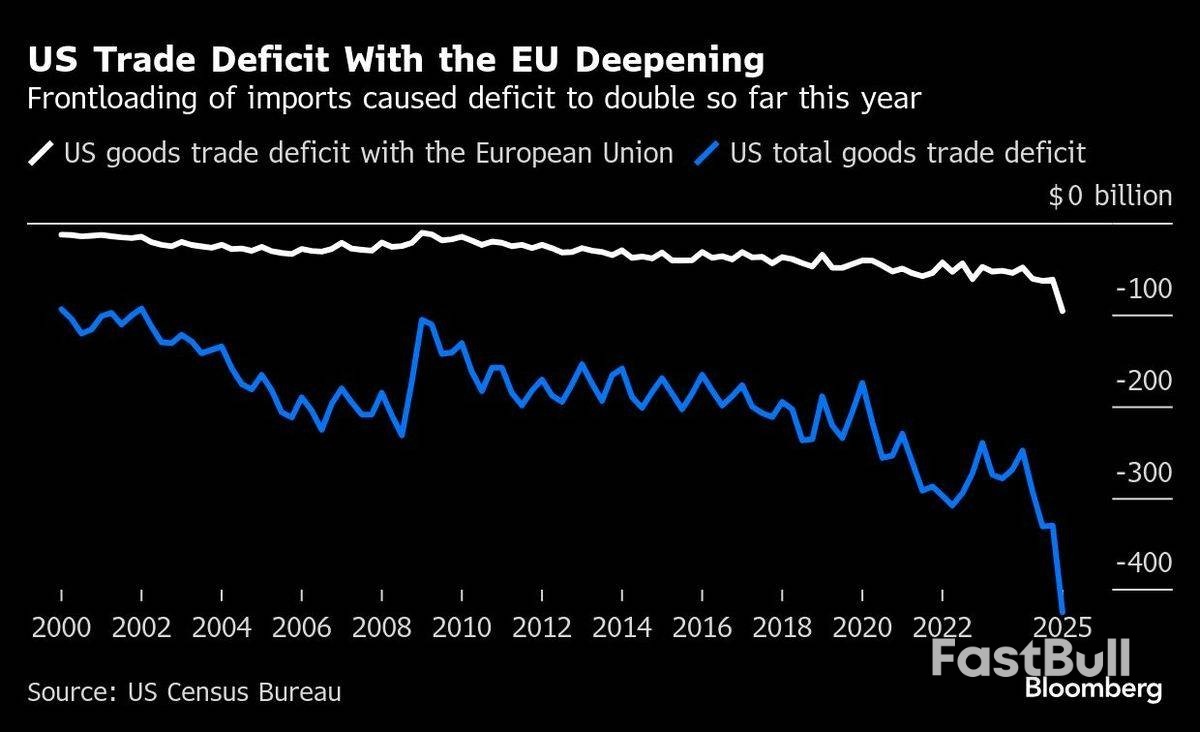
          The European Union and the US believe they can clinch some form of a trade agreement before a July 9 deadline, when Washington is set to impose a 50% tariff on nearly all EU products and the bloc plans to unleash its own series of countermeasures.

          European Commission President Ursula von der Leyen told EU leaders behind closed doors at a Thursday summit that she was confident a deal could be reached before the deadline to avoid an economically damaging escalation, according to people familiar with the matter.

          Von der Leyen said that the Trump administration had shared a new proposal this week. During the discussion, there was a shift in tone among the leaders, many of whom said they were ready to accept some degree of imbalance in a trade deal to avoid an escalation, said the people, who spoke on the condition of anonymity.

          US Commerce Secretary Howard Lutnick echoed von der Leyen’s comments in a Thursday interview with Bloomberg TV, saying that the EU had picked up the pace of the negotiations in recent weeks, laying out the groundwork for an accord.

          A spokesperson for the commission, which handles trade matters for the EU, didn’t immediately reply to a request for comment.

          “Europe has done an excellent job, they’re working hard,” Lutnick said. “I’m optimistic — I think we can get a deal now.”

          European stocks extended their gains after the news, with the Stoxx Europe 600 Index up 1%. The benchmark was up 0.7% before the news. German bonds extended a small drop, sending the yield on the two-year to 1.87%.

          Lutnick added that it made sense for a deal with the EU to come at the end of the process since the bloc is the US’s largest trade partner, and as such the two have a deep and complex relationship.

          President Donald Trump in April announced a raft of so-called reciprocal tariffs on nearly all US commercial partners, targeting trade barriers American companies face abroad, such as duties, domestic regulations and taxes. Those 50% tariffs are set to be imposed July 9.

          In addition to the universal levy, Trump has introduced a 25% tariff on cars and a 50% duty on steel and aluminium. He’s also working to expand tariffs on other sectors, including pharmaceuticals, semiconductors and commercial aircraft.

          The US president has often blasted the EU – which he has said was created to “screw” the US – over its goods surplus and perceived barriers to American trade.

          The EU estimates that US duties now cover €380 billion (US$445 billion or RM1.88 trillion), or about 70%, of its exports to the US.

          EU officials believe that the best-case scenario from the negotiations remains an agreement in principle that would allow the talks to continue beyond the July deadline, Bloomberg previously reported.

          Since intensifying negotiations, the US and EU have been conducting in-depth discussions on critical sectors – such as steel and aluminium, automobiles, pharmaceuticals, semiconductors and civilian aircraft – as well as on tariff and non-tariff barriers, in addition to strategic purchases and economic security.

          Thursday’s leaders’ debate didn’t reveal the extent of the imbalances the bloc’s capitals are prepared to stomach, according to the people. The EU, which has been seeking a mutually beneficial deal, will assess any end result and at that stage decide what level of asymmetry it’s willing to accept.

          Because of that, in parallel to the negotiations, the bloc continues to prepare countermeasures should talks yield unsatisfactory outcomes and may need to rebalance the agreement targeting some key sectors.

          The EU has approved tariffs on €21 billion of US goods that can be quickly implemented in response to Trump’s metals levies. They target politically sensitive American states and include products such as soybeans from Louisiana, home to House Speaker Mike Johnson, as well as agricultural products, poultry, and motorcycles.

          The bloc has also prepared an additional list of tariffs on €95 billion of American products in response to Trump’s so-called reciprocal levies and automotive duties. They would target industrial goods including Boeing Co aircraft, US-made cars, and bourbon. The EU is also consulting member states to identify strategic areas where the US relies on the bloc, as well as potential measures that go beyond tariffs.

          “We are ready for a deal — at the same time we are preparing for the possibility that no satisfactory agreement is reached,” von der Leyen told reporters after Thursday’s summit. “In short, all options remain on the table.”

          Source: Theedgemarkets

          To stay updated on all economic events of today, please check out our Economic calendar
          Risk Warnings and Disclaimers
          You understand and acknowledge that there is a high degree of risk involved in trading. Following any strategies or investment methods may lead to potential losses. The content on the site is provided by our contributors and analysts for information purposes only. You are solely responsible for determining whether any trading assets, securities, strategy, or any other product is suitable for investing based on your own investment objectives and financial situation.
          Add to Favorites
          Share

          Fed's Preferred Inflation Gauge Shows Price Increases Accelerated in May

          Warren Takunda

          Economic

          The latest reading of the Federal Reserve's preferred inflation gauge showed price increases accelerated in May as inflation remained above the Fed's 2% target. The release comes as investors have been closely watching data releases for signs of when, or if, the Federal Reserve will cut interest rates this year.
          The "core" Personal Consumption Expenditures (PCE) index, which strips out food and energy costs and is closely watched by the central bank, rose 2.7% on an annual basis, above the 2.6% economists had expected and higher than the 2.6% seen in April. The April reading was revised higher to 2.6% from an originally reported 2.5% increase.
          Core prices rose 0.2% in May from the prior month, above the 0.1% economists had expected, which would have been in line with April's increase.
          On a yearly basis, overall PCE increased by 2.3%, above the 2.2% increase from the month prior.Fed's Preferred Inflation Gauge Shows Price Increases Accelerated in May_1
          Elsewhere in the release, data showed signs of slowing economic growth activity. Real personal spending, which adjusts for inflation, decreased 0.3% in May after increasing 0.1% in April. Meanwhile, personal income fell 0.4% in May, well below the 0.7% increase seen in April and the 0.3% increase economists had expected.
          "The trend in parts of discretionary spending has weakened, and we expect a further slowdown in the coming months as tariffs begin to weigh on real disposable incomes," Oxford Economics deputy chief US economist Michael Pearce wrote in a note to clients.
          The data's release comes after Federal Reserve Chair Jerome Powell testified in front of House lawmakers, stressing that the central bank is "well-positioned to wait" before moving interest rates.
          But debate over when the central bank will cut interest rates has been heating up. After Friday's release, markets were pricing in a 22.7% chance the central bank cuts interest rates at its next meeting in late July, up from a 14.5% chance seen last week, per the CME FedWatch Tool. Odds of a cut by the end of September had also surged, with markets now pricing in a 92% chance the central bank will have lowered rates by then, up from a 70% chance seen just a week ago.

          Source: Yahoofinance

          To stay updated on all economic events of today, please check out our Economic calendar
          Risk Warnings and Disclaimers
          You understand and acknowledge that there is a high degree of risk involved in trading. Following any strategies or investment methods may lead to potential losses. The content on the site is provided by our contributors and analysts for information purposes only. You are solely responsible for determining whether any trading assets, securities, strategy, or any other product is suitable for investing based on your own investment objectives and financial situation.
          Add to Favorites
          Share

          US equity funds suffer sixth weekly outflows in a row

          Adam

          Stocks

          U.S. equity funds suffered outflows for a sixth straight week through June 25 as investors took profits near record highs and stayed on edge ahead of key growth and inflation data.
          According to LSEG Lipper data, investors withdrew a net $20.48 billion from U.S. equity funds during the week, posting their largest weekly net sales since March 19.
          The S&P 500 index has gained approximately 2.9% so far this week and is hovering near a record 6147.43 hit on February 19, as a ceasefire between Israel and Iran bolstered sentiment.
          Investors ditched U.S. multi-cap, small-cap and mid-cap funds worth $5.65 billion, $2.34 billion and $1.39 billion, respectively during the week. Large-cap funds, however, saw a net $1.3 billion in weekly purchases.
          U.S. sectoral funds logged a net $1.98 billion weekly outflow following four weeks of net inflows.
          The tech, gold and precious metals equity sectoral funds saw $1.8 billion and $443 million worth of weekly net disposals.
          Money market funds, meanwhile, witnessed renewed buying interest following two weeks of outflows as they received about $10.95 billion in net investments.
          U.S. bond funds saw the strongest buying interest in four weeks as investors added a net $6.83 billion in weekly inflows to these funds.
          The general domestic taxable fixed income funds, short-to-intermediate investment-grade funds and inflation-protected funds stood out with $1.55 billion, $1.18 billion and $680 million, respectively, in net purchases.

          source : Reuters

          Risk Warnings and Disclaimers
          You understand and acknowledge that there is a high degree of risk involved in trading. Following any strategies or investment methods may lead to potential losses. The content on the site is provided by our contributors and analysts for information purposes only. You are solely responsible for determining whether any trading assets, securities, strategy, or any other product is suitable for investing based on your own investment objectives and financial situation.
          Add to Favorites
          Share

          The Fed's "Transitory" Mistake Is Affecting Its Outlook

          Jason

          Central Bank

          In 2023 and 2024, the Fed was under intense public and media scrutiny for calling the post-pandemic surge in inflation “transitory.” Critics argued that the Fed’s failure to anticipate the persistence and severity of rising prices undermined its credibility. Yet, with the benefit of hindsight and historical context, the Fed’s position wasn’t entirely misguided. Inflation proved temporary in a broader economic sense, and by 2025, the data confirmed a significant cooling of price pressures.

          However, the Fed’s mistake wasn’t the “transitory” label—it was the Fed’s late response to raising interest rates and halting quantitative easing. As shown, the combined impact of the massive surge in the Government’s deficit spending (stimulus checks and infrastructure bills) and the Fed’s $120 billion monthly “quantitative easing” campaign caused a massive jump in economic growth and inflation. However, instead of cutting back on stimulus when the economy rebounded, the Fed’s mistake was keeping its “foot on the gas” for too long. These delays allowed the inflationary fire to burn hotter and longer than necessary, exacerbated by an overlooked driver: excessive government spending.

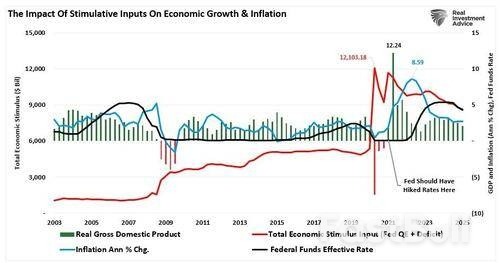
          Despite the elevated levels of total economic stimulus, inflation and economic growth have subsided as the economy continues normalizing. However, to understand the Fed’s current policy risks, particularly in light of its recent warnings about tariffs, it’s essential to look back at past inflation spikes

          Historical Inflation Spikes and Their Resolution

          U.S. economic history offers several instructive examples of inflationary episodes and how they eventually resolved.

          • Post-WWII Inflation (1946–1948): After World War II, inflation surged to nearly 20% as price controls ended and pent-up consumer demand met constrained supply. But this spike was short-lived. As production normalized and demand stabilized, inflation quickly receded. The Fed did not need any drastic monetary tightening.

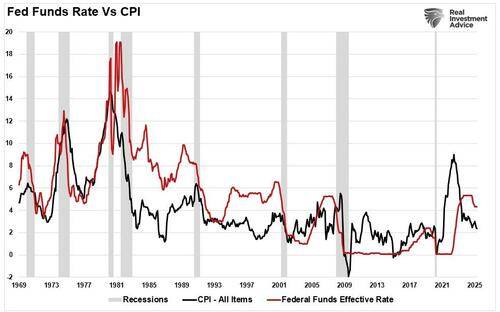
          • The 1970s Stagflation: The most notorious inflation era came during the 1970s, driven by oil shocks, wage-price spirals, and loose monetary policy. Inflation remained high for nearly a decade. It wasn’t until Paul Volcker’s aggressive interest rate hikes in the early 1980s, pushing the federal funds rate above 15%, that inflation fell, though at the cost of a deep recession.

          • Greenspan’s “Inflation Boogyman:” In the late 90s, Alan Greenspan worried that an inflation surge was coming and aggressively began to hike rates into that anticipation. The further tightening of money policy contributed to the blowup of numerous “dot.com” companies that were heavily leveraged with no revenues. Instead of rising, inflation collapsed as the “Dot.com” crash devastated the economy.

          • Post-GFC Disinflation: After the 2008 Global Financial Crisis, many feared stimulus and Fed intervention would trigger inflation. Instead, the opposite occurred. Inflation remained stubbornly low for over a decade, highlighting how debt overhangs and weak demand can suppress prices even amid central bank easing.

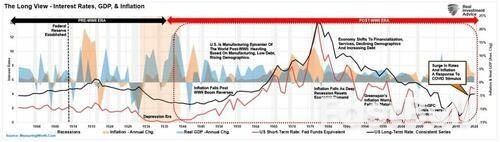
          Compared to these episodes, the COVID-driven inflation surge stands out for its rapid onset and similarly swift decline. Prices surged due to supply chain disruptions, labor shortages, and historic stimulus. But by 2025, inflation is back to near-target levels. The duration of elevated inflation, from early 2021 through late 2023, was short by historical standards, and it faded as supply chains normalized and stimulus effects waned.

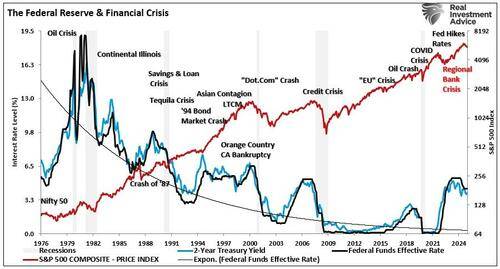
          The historical shortcomings of the Fed’s actions, repeated policy mistakes, and flawed outlooks are clearly evident. The Fed hikes rates, creates an economic or credit-related event, and then cuts rates to fix it.

          As such, investors should ask themselves why they are confident in the Fed’s current assessment of tariff-induced inflation risks.

          The Fed’s Tariff Fears: Misreading the Present Through the Lens of the Past?

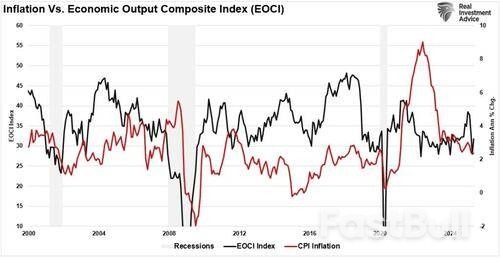
          At the June 18, 2025, press conference, Fed Chair Jerome Powell expressed concern that rising tariffs could reignite inflation. With trade policy becoming increasingly protectionist, particularly toward China and Mexico, the Fed is wary that tariffs could push up import prices and thus overall inflation. However, there’s an important distinction: inflation data from the last four months has shown no measurable impact from recent tariff actions. The Consumer Price Index (CPI) has remained stable or declined, while core inflation has softened. Meanwhile, job growth has slowed, and wage gains have moderated. All classic signs of a cooling economy.

          This link between the economy and inflation is evident from the Economic Composite Index, which comprises nearly 100 hard and soft data points. Following the spike in economic activity post-pandemic, economic growth continues to decline. Given that inflation is solely a function of economic supply and demand, it is unsurprising that it continues to cool.

          This raises a critical policy question: Is the Fed now over-compensating on the cautious side because of its past missteps with “transitory” inflation?

          If so, the risk is that the Fed may once again make another policy mistake, as has repeatedly been the case in the past. After keeping rates too low for too long post-pandemic, policymakers might be too hesitant to cut rates, fearing another inflation flare-up that may never materialize. This fear-based approach risks undermining an already slowing economy.

          The Risk of Being Wrong Again: What If Tariff Inflation Never Arrives

          Tariffs are designed to make foreign goods more expensive. However, supply chains and pricing are far more flexible in today’s globalized economy. If importers can shift production to tariff-free countries, renegotiate supplier contracts, or absorb costs to maintain market share, the inflationary effects of tariffs can be muted or even nonexistent. They are already doing this.

          “The bonded warehouse route takes the opposite approach. Rather than mess with a good’s contents or move production elsewhere, businesses can import products from across the world without paying any tariffs when they enter the US — as long as they remain locked up in a special customs-regulated warehouse. Businesses can keep goods in these warehouses for up to five years without paying a tariff. They only pay the current tariff rate when they take goods out of storage. It’s a bet that tariff rates will go down in the short or medium term.”

          Furthermore, companies are “reclassifying and redesigning” products to get lower tariff treatments.

          “In other words, companies try to say their article or their good is something that gets low tariff treatment relative to what it might be, in essence. For example, Marvel successfully argued in court in 2003 that X-Men action figures are non-human toys (despite the premise of the franchise) rather than dolls, nearly halving their tax rate.”

          Lastly, as discussed in “Tariff Risk Isn’t Inflation,” economists always forget the importance of consumer choice. The only payee of tariffs is the producers. Consumers can purchase less, delay, or exclude certain products from their consumption. To wit:

          “Today, globalization and technology give consumers vast choices in the products they buy. While instituting a tariff on a set of products from China may indeed raise the prices of those specific products, consumers have easy choices for substitution. A recent survey by Civic Science showed an excellent example of why tariffs won’t increase prices (always a function of supply and demand).”

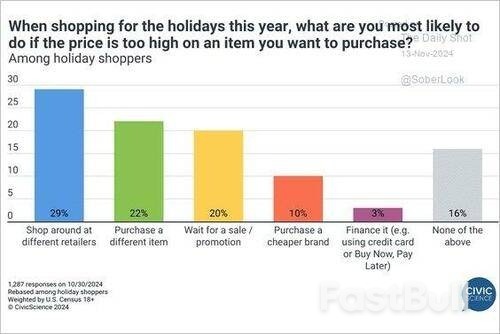
          Of course, if demand drops for products with tariffs, prices will fall, reducing inflationary pressures.

          Recent economic data suggests exactly that. Despite new levies on Chinese electric vehicles and Mexican steel, consumer durables and core goods prices have not moved materially higher. Businesses appear to be adapting quickly, with many shifting sourcing to Vietnam, India, or reshoring certain elements of production.

          This raises the danger of a policy mismatch: If the Fed waits for inflation that doesn’t arrive, it may keep real interest rates excessively high for too long, just as it kept them too low following the pandemic. The consequences could be severe:

          • Slower Economic Growth: Elevated rates in a disinflationary environment slow investment and consumption, slowing GDP growth.

          • Labor Market Weakness: As rate-sensitive sectors (like housing and manufacturing) continue to weaken, layoffs may rise, further pressuring employment.

          • Financial Instability: Prolonged tight monetary policy increases the risk of credit defaults, especially among small businesses and lower-income households with floating-rate debt.

          If the Fed is fighting a phantom threat, as Alan Greenspan did in the late 90s, and tariff-driven inflation never arrives, it could inadvertently engineer a downturn. And much like in 2021 and 2022, this would be a policy failure driven not by bad data, but by misjudging the economic environment.,

          Conclusion: Learning the Right Lesson from “Transitory”

          The Fed’s credibility rests not on never being wrong, but on being adaptive and forward-looking. Inflation has cooled, wage growth has moderated, and economic momentum is slowing. Now is the time for the Fed to focus not on headline fears, but on real-time data.

          If tariffs have not yet translated into price increases, and employment indicators suggest slack is growing, the Fed should not delay necessary rate cuts to defend its credibility. Doing so risks repeating the mistake it made during the pandemic: ignoring the lagging effects of previous decisions.

          Cutting rates too late would be just as damaging as hiking them too slowly.

          The media mocked the Fed’s “transitory” narrative, but inflation was short-lived in the grand scheme. What mattered more was how long the Fed waited to act. With tariffs yet to trigger a real inflationary response and the economy showing signs of deceleration, the greater risk may be inaction, not inflation.

          Investors should be alert to the Fed’s tendency to overcorrect past mistakes. Just as policy stayed too loose after COVID, it may now stay too tight for too long in 2025. Recognizing that monetary policy must adapt, not just react, will be key for policymakers and market participants navigating the road ahead.

          Source: Zero Hedge

          Risk Warnings and Disclaimers
          You understand and acknowledge that there is a high degree of risk involved in trading. Following any strategies or investment methods may lead to potential losses. The content on the site is provided by our contributors and analysts for information purposes only. You are solely responsible for determining whether any trading assets, securities, strategy, or any other product is suitable for investing based on your own investment objectives and financial situation.
          Add to Favorites
          Share
          FastBull
          Copyright © 2025 FastBull Ltd

          728 RM B 7/F GEE LOK IND BLDG NO 34 HUNG TO RD KWUN TONG KLN HONG KONG

          TelegramInstagramTwitterfacebooklinkedin
          App Store Google Play Google Play
          Products
          Charts

          Chats

          Q&A with Experts
          Screeners
          Economic Calendar
          Data
          Tools
          Membership
          Features
          Function
          Markets
          Copy Trading
          Latest Signals
          Contests
          News
          Analysis
          24/7
          Columns
          Education
          Company
          Careers
          About Us
          Contact Us
          Advertising
          Help Center
          Feedback
          User Agreement
          Privacy Policy
          Business

          White Label

          Data API

          Web Plug-ins

          Poster Maker

          Affiliate Program

          Risk Disclosure

          The risk of loss in trading financial instruments such as stocks, FX, commodities, futures, bonds, ETFs and crypto can be substantial. You may sustain a total loss of the funds that you deposit with your broker. Therefore, you should carefully consider whether such trading is suitable for you in light of your circumstances and financial resources.

          No decision to invest should be made without thoroughly conducting due diligence by yourself or consulting with your financial advisors. Our web content might not suit you since we don't know your financial conditions and investment needs. Our financial information might have latency or contain inaccuracy, so you should be fully responsible for any of your trading and investment decisions. The company will not be responsible for your capital loss.

          Without getting permission from the website, you are not allowed to copy the website's graphics, texts, or trademarks. Intellectual property rights in the content or data incorporated into this website belong to its providers and exchange merchants.

          Not Logged In

          Log in to access more features

          FastBull Membership

          Not yet

          Purchase

          Become a signal provider
          Help Center
          Customer Service
          Dark Mode
          Price Up/Down Colors

          Log In

          Sign Up

          Position
          Layout
          Fullscreen
          Default to Chart
          The chart page opens by default when you visit fastbull.com