

Markets
News
Analysis
User
24/7
Economic Calendar
Education
Data
- Names
- Latest
- Prev


Signal Accounts for Members
All Signal Accounts
All Contests
 Turkey Trade Balance
A:--
F: --
P: --
 Germany Construction PMI (SA) (Nov)
A:--
F: --
P: --
 Euro Zone IHS Markit Construction PMI (Nov)
A:--
F: --
P: --
 Italy IHS Markit Construction PMI (Nov)
A:--
F: --
P: --
 U.K. Markit/CIPS Construction PMI (Nov)
A:--
F: --
P: --
 France 10-Year OAT Auction Avg. Yield
A:--
F: --
P: --
Euro Zone Retail Sales MoM (Oct)A:--
F: --
P: --
Euro Zone Retail Sales YoY (Oct)A:--
F: --
P: --
 Brazil GDP YoY (Q3)
A:--
F: --
P: --
 U.S. Challenger Job Cuts (Nov)
A:--
F: --
P: --
U.S. Challenger Job Cuts MoM (Nov)A:--
F: --
P: --
U.S. Challenger Job Cuts YoY (Nov)A:--
F: --
P: --
U.S. Initial Jobless Claims 4-Week Avg. (SA)A:--
F: --
P: --
U.S. Weekly Initial Jobless Claims (SA)A:--
F: --
P: --
U.S. Weekly Continued Jobless Claims (SA)A:--
F: --
P: --
 Canada Ivey PMI (SA) (Nov)
A:--
F: --
P: --
Canada Ivey PMI (Not SA) (Nov)A:--
F: --
P: --
U.S. Non-Defense Capital Durable Goods Orders Revised MoM (Excl. Aircraft) (SA) (Sept)A:--
F: --
U.S. Factory Orders MoM (Excl. Transport) (Sept)A:--
F: --
P: --
U.S. Factory Orders MoM (Sept)A:--
F: --
P: --
U.S. Factory Orders MoM (Excl. Defense) (Sept)A:--
F: --
P: --
U.S. EIA Weekly Natural Gas Stocks ChangeA:--
F: --
P: --
Saudi Arabia Crude Oil ProductionA:--
F: --
P: --
U.S. Weekly Treasuries Held by Foreign Central BanksA:--
F: --
P: --
 Japan Foreign Exchange Reserves (Nov)
A:--
F: --
P: --
 India Repo Rate
A:--
F: --
P: --
India Benchmark Interest RateA:--
F: --
P: --
India Reverse Repo RateA:--
F: --
P: --
India Cash Reserve RatioA:--
F: --
P: --
Japan Leading Indicators Prelim (Oct)A:--
F: --
P: --
U.K. Halifax House Price Index YoY (SA) (Nov)--
F: --
P: --
U.K. Halifax House Price Index MoM (SA) (Nov)--
F: --
P: --
France Current Account (Not SA) (Oct)--
F: --
P: --
France Trade Balance (SA) (Oct)--
F: --
P: --
France Industrial Output MoM (SA) (Oct)--
F: --
P: --
Italy Retail Sales MoM (SA) (Oct)--
F: --
P: --
Euro Zone Employment YoY (SA) (Q3)--
F: --
P: --
Euro Zone GDP Final YoY (Q3)--
F: --
P: --
Euro Zone GDP Final QoQ (Q3)--
F: --
P: --
Euro Zone Employment Final QoQ (SA) (Q3)--
F: --
P: --
Euro Zone Employment Final (SA) (Q3)--
F: --
Brazil PPI MoM (Oct)--
F: --
P: --
 Mexico Consumer Confidence Index (Nov)
--
F: --
P: --
Canada Unemployment Rate (SA) (Nov)--
F: --
P: --
Canada Labor Force Participation Rate (SA) (Nov)--
F: --
P: --
Canada Employment (SA) (Nov)--
F: --
P: --
Canada Part-Time Employment (SA) (Nov)--
F: --
P: --
Canada Full-time Employment (SA) (Nov)--
F: --
P: --
U.S. Dallas Fed PCE Price Index YoY (Sept)--
F: --
P: --
U.S. PCE Price Index YoY (SA) (Sept)--
F: --
P: --
U.S. PCE Price Index MoM (Sept)--
F: --
P: --
U.S. Personal Outlays MoM (SA) (Sept)--
F: --
P: --
U.S. Core PCE Price Index MoM (Sept)--
F: --
P: --
U.S. UMich 5-Year-Ahead Inflation Expectations Prelim YoY (Dec)--
F: --
P: --
U.S. Core PCE Price Index YoY (Sept)--
F: --
P: --
U.S. 5-10 Year-Ahead Inflation Expectations (Dec)--
F: --
P: --
U.S. UMich Current Economic Conditions Index Prelim (Dec)--
F: --
P: --
U.S. UMich Consumer Sentiment Index Prelim (Dec)--
F: --
P: --
U.S. UMich 1-Year-Ahead Inflation Expectations Prelim (Dec)--
F: --
P: --
U.S. UMich Consumer Expectations Index Prelim (Dec)--
F: --
P: --

No matching data
Latest Views
Latest Views
Trending Topics
Top Columnists
Latest Update
White Label
Data API
Web Plug-ins
Affiliate Program
View All
No data
Russian President Vladimir Putin declared on Tuesday that Russia is prepared for war with European powers if they seek conflict, while emphasizing that Moscow does not want such an outcome.
Russian President Vladimir Putin declared on Tuesday that Russia is prepared for war with European powers if they seek conflict, while emphasizing that Moscow does not want such an outcome.
During his address, Putin stated that European nations have made "absolutely unacceptable" demands regarding a potential peace settlement for Ukraine.
"If Europe wants to fight war, we are ready now," Putin said, escalating his rhetoric against European nations.
The Russian leader claimed that Europeans have "detached themselves" from peace talks and are hindering the U.S. administration and President Trump's efforts to achieve peace through negotiations.
"Europeans do not have peaceful agenda, they are on the side of war," Putin asserted.
Putin highlighted the strategic importance of Pokrovsk in Ukraine, describing it as "a great base for fulfilling goals" and reiterating that it is now "fully in Russia's army control," a statement Ukrainian officials have rebuffed.


The world's biggest weapons-producing companies saw a 5.9% increase in revenue from sales of arms and military services last year as demand was fed by the wars in Ukraine and Gaza as well as countries' rising military spending, according to a report released Monday.
The Stockholm International Peace Research Institute, or SIPRI, said the revenues of the 100 largest arms makers grew to $679 billion in 2024, the highest figure it has recorded.
The bulk of the increase was down to companies based in Europe and the United States, but there were increases around the world — except in Asia and Oceania, where problems in the Chinese arms industry led to a slight fall.
Thirty of the 39 U.S. companies in the top 100 — including Lockheed Martin, Northrop Grumman and General Dynamics — posted increases. Their combined revenue was up 3.8% at $334 billion. But SIPRI noted that "widespread delays and budget overruns continue to plague development and production" in major U.S.-led programs, including the F-35 fighter jet.
Twenty-three of the 26 companies in Europe, excluding Russia, saw their arms revenue increase as the continent boosted spending. Their aggregate income rose by 13% to $151 billion, fueled by demand linked to the war in Ukraine and the perceived threat from Russia.
There were notably big gains for the Czech Republic's Czechoslovak Group, whose revenue soared by 193% thanks in part to a government-led project to source artillery shells for Ukraine; and for Ukraine's JSC Ukrainian Defense Industry, which had a 41% gain.
European firms are investing in new production capacity to meet greater demand, but SIPRI researcher Jade Guiberteau Ricard cautioned in a statement that "sourcing materials could pose a growing challenge," with restructuring of supply chains for critical minerals a potential complication in light of Chinese export restrictions.
The two Russian companies in SIPRI's list, Rostec and United Shipbuilding Corporation, saw arms revenues rise 23% to a combined $31.2 billion, despite sanctions leading to a shortage of components. SIPRI said that domestic demand was more than enough to offset falling arms exports, though a skilled labor shortage is a challenge.
Arms revenue also grew in the Middle East, and the three Israeli companies in the ranking had a 16% increase to $16.2 billion. In 2024, the backlash over Israeli actions in Gaza "seems to have had little impact on interest in Israeli weapons,' SIPRI researcher Zubaida Karim said, and many countries continued to place new orders.
A 1.2% drop in revenue in Asia and Oceania to $130 billion was led by a 10% drop in the income of the eight Chinese companies in the index. That came as multiple corruption allegations in Chinese arms procurement led to major contracts being delayed or canceled last year, SIPRI said.
This morning's survey data on the US manufacturing economy comes as the post-shutdown slump in 'soft' data has dominated desk conversations amid the vacuum of hard macro data...
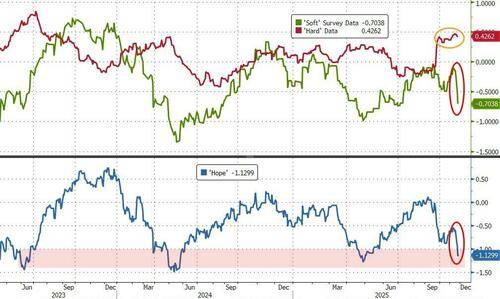
But the picture remains mixed:
●S&P Global's US Manufacturing PMI BEAT expectations in November but dipped on a MoM basis from 52.5 to 52.2 (still in expansion territory and up from the 51.9 flash print).
●ISM's Manufacturing PMI MISSED expectations, dropping from 48.7 to 48.2 (well below the 49.0 expectation) and in contraction for the ninth month in a row.
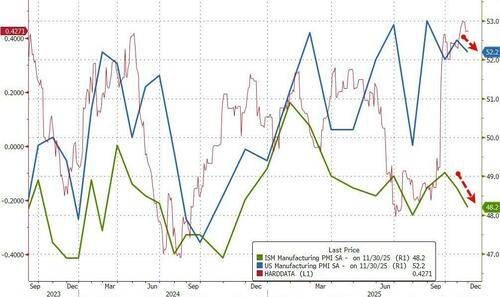
Although the headline PMI signalled a further expansion of factory activity in November, "the health of the US manufacturing sector gets more worrying the more you scratch under the surface," according to Chris Williamson, Chief Business Economist at S&P Global Market Intelligence.
"The main impetus came from a strong rise in factory production, but growth in new order inflows slowed sharply, hinting at a marked weakening of demand growth."
Under the hood, ISM shows Price Paid higher, and new orders and employment worsening...
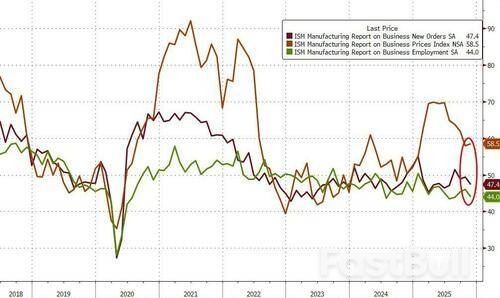
For two successive months now, warehouses have filled with unsold stock to a degree not previously seen since comparable data were available in 2007. This unplanned accumulation of stock is usually a precursor to reduced production in the coming months.
"Profit margins are meanwhile coming under pressure from a combination of disappointing sales, stiff competition and rising input costs, the latter widely linked to tariffs.
In short, Williamson notes that manufacturers are making more goods but often not finding buyers for these products.
"This combination of sustained robust production growth alongside weaker than expected sales led to a worryingly steep rise in unsold inventories.
However, there is hope, as manufacturers have grown more optimistic about the year ahead, with the ending of the government shutdown helping lift confidence from the sharp drop suffered in October.
"Optimism is being fueled by hopes of improved policy support, including lower interest rates, as well as greater political stability, though it is clear that uncertainty remains elevated and a drag on business growth in many firms, holding confidence well below levels seen at the start of the year."
India's current account deficit widened in the July–to-September quarter as US President Donald Trump's 50% tariff hurt the country's exports.
The shortfall in the broadest measure of trade in goods and services was $12.3 billion, or 1.3% of gross domestic product in the three months, according to Reserve Bank of India data released Monday. The gap was smaller than the median forecast of a $15.4 billion gap in a Bloomberg survey on strong remittances and services exports. It stood at $2.7 billion in the April-to-June period.
Gold prices surged, pushing up import costs, while exports remained under pressure from the 50% tariff imposed by Trump, partly in response to India's Russian oil purchases. The wider current account gap may put additional pressure on the rupee, which slid to a record low of 89.64 per dollar on Monday.
"Looking ahead, the spike in gold imports in October 2025 is likely to bloat the ongoing quarter's current account deficit considerably to above 2.5% of GDP," said Aditi Nayar, chief economist at ICRA Ltd.
The merchandise trade gap in the quarter narrowed slightly to $87.4 billion, from $88.5 billion a year ago, the RBI data showed. Services exports climbed to $50.9 billion, from $44.5 billion a year earlier mainly because of computer services, the central bank said.
Private transfer receipts, mainly representing remittances by Indians employed overseas, amounted to $38.2 billion, up from $34.4 billion from the corresponding period a year earlier.
Net foreign direct investment recorded a net inflow of $2.9 billion, compared with a net outflow of $2.8 billion a year ago. Foreign portfolio investment recorded net outflow of $5.7 billion against a net inflow of $19.9 billion in the year-ago quarter.
New facility is set to be South Korea's most advanced automated hub for clinical logistics and sourcing, reinforcing the nation's position as a leader in clinical research innovation
Gyeonggi-do, South Korea Zuellig Pharma, a leading healthcare solutions company in Asia, today announced the grand opening of its new state-of-the-art Clinical Trial Support (CTS) Innovation Center in South Korea.
The opening of this facility underscores Zuellig Pharma's continued investment and commitment to advancing healthcare, reinforcing its position as a trusted regional partner in driving meaningful outcomes for patients, partners, and communities across the region.
Strategically located near the Gyeongbu Expressway in Gyeonggi-do province, the new 3,800-square-meter facility is set to redefine standards in clinical trial logistics through automation, digitalization, and stringent Good Practice (GxP) compliance. It is designed to enhance operational efficiency, scalability, and reliability across diverse therapeutic areas.
"As part of an integrated healthcare solutions company, this milestone marks a significant step forward for Zuellig Pharma in remaining agile and responsive to the evolving clinical trial landscape. It also reflects Zuellig Pharma's continued commitment to advancing healthcare through innovation and sustainable infrastructure, creating greater access to treatments and delivering meaningful outcomes for partners and communities we serve," said John Graham, CEO of Zuellig Pharma.
The facility is equipped with advanced capabilities that set new standards for clinical trial logistics. It features a fully automated order fulfillment system that enhances the speed, accuracy, and reliability of clinical supply delivery. Its flexible and scalable architecture ensures uninterrupted operations, while robust cybersecurity measures safeguard sensitive clinical trial data.
In addition, the facility provides comprehensive temperature-zone support, enabling Zuellig Pharma to manage thousands of unique clinical trial SKUs under strict ambient, cold, frozen, deep frozen, cryogenic and return storage conditions. This ensures that temperature-sensitive products are handled with the highest level of precision throughout the entire supply chain.
Designed with precision, the facility's specialized repackaging infrastructure is built to accommodate controlled environments tailored to ambient, cold, frozen, and amber light repackaging specifications. These environments meet stringent clinical and regulatory standards, ensuring product integrity is maintained throughout the clinical trial lifecycle. Furthermore, an integrated end-to-end tracking and monitoring system provides full chain-of-custody, complete traceability, and adherence to GxP requirements, reinforcing quality and compliance at every stage.
"As of 2025, South Korea ranks among the world's top 10 clinical trials markets and holds the third-largest number of R&D pipelines globally. Our new facility has been built to meet this rising demand, redefining how investigational products are stored, managed, and distributed. With precision in mind, we aim to enable the reliable delivery of critical therapies to improve patient access and outcomes worldwide," added Giuseppe Leo, SVP, Clinical Trial Support Business Unit Lead, Zuellig Pharma.
Over the past year, the center has supported over 3,000 cumulative studies in collaboration with more than 100 clients, managing an annual volume of approximately 13,000 outbound shipments, including chemical, biologics, medical devices and cellular and gene therapies. Its extensive track record includes partnerships with 14 of the world's top 20 pharmaceutical companies and 8 of the top 10 global CROs, underscoring its position as a trusted partner in global clinical trial research.
The latest data from the Society of Motor Manufacturers and Traders (SMMT) has revealed that the October 2025 UK car production dropped by 23.8% compared to the previous year.
The reduction followed a temporary halt at one of the country's largest automotive employers, which had paused operations due to a cyber incident before gradually resuming output.
In October, UK factories produced 59,010 cars, which is 18,474 fewer than in the same month of the previous year. Of these vehicles, nearly half (46.2%) were battery electric, plug-in hybrid or hybrid models.
This segment saw a volume increase of 10.4% year-on-year, reaching 27,287 units.
Cars manufactured for the domestic market declined by 10.6% to 13,785 units.
Production of commercial vehicles continued to decrease for the seventh consecutive month, falling by 74.9% to 3,106 units.
This trend followed a consolidation of manufacturing operations in the North West by a large producer.
Overall car and van output combined was down by 30.9% in October with a total of 62,116 vehicles leaving assembly lines.
This update came shortly after the Chancellor's recent Budget announcement. Among the measures outlined were an additional £1.5bn ($1.98bn) for automotive transformation projects and a postponement of regulations that would end certain car ownership schemes for employees until the next parliament.
Other market policies included an extra £1.3bn allocated to the Electric Car Grant and adjustments to the VED [vehicle excise duty] expensive car supplement intended to reduce tax on some electric vehicles.
So far this year, UK manufacturers have produced 644,366 cars and vans—a drop of 17% compared with the same period last year.
According to independent forecasts cited by SMMT, production is expected to rise again in 2026 when new electric vehicle models are introduced and annual output is predicted to reach around 828,000 cars and vans.
SMMT chief executive Mike Hawes said: "Another difficult month for UK vehicle production as the impact of the earlier cyber attack continued to be felt.
"Growth is on the horizon, however, and the [UK] government has recognised the automotive industry as a pillar of national strategic importance, backing it with an industrial strategy and additional £1.5bn to drive manufacturing competitiveness."
The SMMT also announced leadership changes with Kia UK president and CEO Paul Philpott becoming its 84th president effective from 1 January 2026.
He will succeed Adient vice-president Mick Flanagan, who steps down after completing his two-year tenure.
A previous SMMT report revealed that registrations of new heavy goods vehicles (HGVs) in the UK decreased by 14.5% during Q3 2025 with 9,272 new trucks entering service over that period.
"UK car production drops 23.8% in October 2025: SMMT" was originally created and published by Motor Finance Online, a GlobalData owned brand.
728 RM B 7/F GEE LOK IND BLDG NO 34 HUNG TO RD KWUN TONG KLN HONG KONG


White Label
Data API
Web Plug-ins
Poster Maker
Affiliate Program
The risk of loss in trading financial instruments such as stocks, FX, commodities, futures, bonds, ETFs and crypto can be substantial. You may sustain a total loss of the funds that you deposit with your broker. Therefore, you should carefully consider whether such trading is suitable for you in light of your circumstances and financial resources.
No decision to invest should be made without thoroughly conducting due diligence by yourself or consulting with your financial advisors. Our web content might not suit you since we don't know your financial conditions and investment needs. Our financial information might have latency or contain inaccuracy, so you should be fully responsible for any of your trading and investment decisions. The company will not be responsible for your capital loss.
Without getting permission from the website, you are not allowed to copy the website's graphics, texts, or trademarks. Intellectual property rights in the content or data incorporated into this website belong to its providers and exchange merchants.
Not Logged In
Log in to access more features

FastBull Membership
Not yet
Purchase


Log In
Sign Up


