

Markets
News
Analysis
User
24/7
Economic Calendar
Education
Data
- Names
- Latest
- Prev


Signal Accounts for Members
All Signal Accounts
All Contests
 France 10-Year OAT Auction Avg. Yield
A:--
F: --
P: --
 Euro Zone Retail Sales YoY (Oct)
A:--
F: --
P: --
 Brazil GDP YoY (Q3)
A:--
F: --
P: --
 U.S. Challenger Job Cuts (Nov)
A:--
F: --
P: --
U.S. Challenger Job Cuts MoM (Nov)A:--
F: --
P: --
U.S. Challenger Job Cuts YoY (Nov)A:--
F: --
P: --
U.S. Initial Jobless Claims 4-Week Avg. (SA)A:--
F: --
P: --
U.S. Weekly Initial Jobless Claims (SA)A:--
F: --
P: --
U.S. Weekly Continued Jobless Claims (SA)A:--
F: --
P: --
 Canada Ivey PMI (SA) (Nov)
A:--
F: --
P: --
Canada Ivey PMI (Not SA) (Nov)A:--
F: --
P: --
U.S. Non-Defense Capital Durable Goods Orders Revised MoM (Excl. Aircraft) (SA) (Sept)A:--
F: --
U.S. Factory Orders MoM (Excl. Transport) (Sept)A:--
F: --
P: --
U.S. Factory Orders MoM (Sept)A:--
F: --
P: --
U.S. Factory Orders MoM (Excl. Defense) (Sept)A:--
F: --
P: --
U.S. EIA Weekly Natural Gas Stocks ChangeA:--
F: --
P: --
Saudi Arabia Crude Oil ProductionA:--
F: --
P: --
U.S. Weekly Treasuries Held by Foreign Central BanksA:--
F: --
P: --
 Japan Foreign Exchange Reserves (Nov)
A:--
F: --
P: --
 India Repo Rate
A:--
F: --
P: --
India Benchmark Interest RateA:--
F: --
P: --
India Reverse Repo RateA:--
F: --
P: --
India Cash Reserve RatioA:--
F: --
P: --
Japan Leading Indicators Prelim (Oct)A:--
F: --
P: --
 U.K. Halifax House Price Index YoY (SA) (Nov)
A:--
F: --
P: --
U.K. Halifax House Price Index MoM (SA) (Nov)A:--
F: --
P: --
France Current Account (Not SA) (Oct)A:--
F: --
P: --
France Trade Balance (SA) (Oct)A:--
F: --
P: --
France Industrial Output MoM (SA) (Oct)A:--
F: --
P: --
 Italy Retail Sales MoM (SA) (Oct)
A:--
F: --
P: --
Euro Zone Employment YoY (SA) (Q3)--
F: --
P: --
Euro Zone GDP Final YoY (Q3)--
F: --
P: --
Euro Zone GDP Final QoQ (Q3)--
F: --
P: --
Euro Zone Employment Final QoQ (SA) (Q3)--
F: --
P: --
Euro Zone Employment Final (SA) (Q3)--
F: --
Brazil PPI MoM (Oct)--
F: --
P: --
 Mexico Consumer Confidence Index (Nov)
--
F: --
P: --
Canada Unemployment Rate (SA) (Nov)--
F: --
P: --
Canada Labor Force Participation Rate (SA) (Nov)--
F: --
P: --
Canada Employment (SA) (Nov)--
F: --
P: --
Canada Part-Time Employment (SA) (Nov)--
F: --
P: --
Canada Full-time Employment (SA) (Nov)--
F: --
P: --
U.S. Personal Income MoM (Sept)--
F: --
P: --
U.S. Dallas Fed PCE Price Index YoY (Sept)--
F: --
P: --
U.S. PCE Price Index YoY (SA) (Sept)--
F: --
P: --
U.S. PCE Price Index MoM (Sept)--
F: --
P: --
U.S. Personal Outlays MoM (SA) (Sept)--
F: --
P: --
U.S. Core PCE Price Index MoM (Sept)--
F: --
P: --
U.S. UMich 5-Year-Ahead Inflation Expectations Prelim YoY (Dec)--
F: --
P: --
U.S. Core PCE Price Index YoY (Sept)--
F: --
P: --
U.S. Real Personal Consumption Expenditures MoM (Sept)--
F: --
P: --
U.S. 5-10 Year-Ahead Inflation Expectations (Dec)--
F: --
P: --
U.S. UMich Current Economic Conditions Index Prelim (Dec)--
F: --
P: --
U.S. UMich Consumer Sentiment Index Prelim (Dec)--
F: --
P: --
U.S. UMich 1-Year-Ahead Inflation Expectations Prelim (Dec)--
F: --
P: --
U.S. UMich Consumer Expectations Index Prelim (Dec)--
F: --
P: --
U.S. Weekly Total Rig Count--
F: --
P: --
U.S. Weekly Total Oil Rig Count--
F: --
P: --
U.S. Consumer Credit (SA) (Oct)--
F: --
P: --
 China, Mainland Foreign Exchange Reserves (Nov)
--
F: --
P: --

No matching data
Latest Views
Latest Views
Trending Topics
Top Columnists
Latest Update
White Label
Data API
Web Plug-ins
Affiliate Program
View All
No data
Oil was little changed after a four-day decline as investors assess the potential impact of moves by western nations to curtail Russian energy exports.
Oil was little changed after a four-day decline as investors assess the potential impact of moves by western nations to curtail Russian energy exports.
West Texas Intermediate’s November contract traded near $62 a barrel after falling almost 3% over the previous four sessions, while Brent settled below $67. Canadian Prime Minister Mark Carney said he wants to see western allies impose secondary sanctions on Russia quickly in order to dramatically ramp up pressure on President Vladimir Putin.
The latest threat to the OPEC+ member’s supply comes after President Donald Trump urged European countries to stop buying Russian energy as he seeks to stem the biggest source of funds for the war in Ukraine. However, the US has so far spared China — the biggest buyer of Moscow’s barrels — from additional tariffs after slapping a 50% rate on India for its purchases last month.
The lack of concrete new measures has left oil in limbo — with prices stuck in a narrow $5 a barrel band since early August as traders also assess forecasts for a surplus later in the year. Breaking out of that range would likely require western nations to align on harsher measures against buyers of Russian oil, said Dennis Kissler, senior vice president for trading at BOK Financial.
Longtime readers might have noticed that I rarely spend much time writing about macroeconomic issues. One of my core beliefs is that it’s almost impossible to predict the future direction of interest rates, economic growth, currency movements, and inflation, not to mention how those factors might impact investment performance.As Peter Lynch famously said, “If you spend 13 minutes a year on economics, you’ve wasted 10 minutes.”
That said, it can be helpful to zoom out and take a big-picture view from time to time. To do so, I updated a chart included in Morningstar’s Markets Observer that depicts seven key metrics and where each one stands relative to its range over the past 20 years. I like this chart because it packs in so much information; even without reading all the details, you can glean that six of these seven metrics currently stand at pretty high levels relative to their historical ranges. Writ large, that suggests some caution may be warranted.
The chart shows where each indicator sits relative to its maximum and minimum over the past 20 years.

Current level: Very high
What it means: Gold has been on a tear but be wary of chasing performance.
As I wrote in a recent article, gold has been the top-performing major asset class over the past 20 years, and also gained more than 31% for the year to date through Aug. 31, 2025. This performance has partly been driven by central banks around the world buying up gold as they “de-dollarize” their reserve assets, as well as other investors seeking a safe haven amid macroeconomic turmoil and geopolitical uncertainty.
Those trends could continue, but there’s also additional risk now that gold is trading at such a pricey level. Academic researchers Campbell Harvey and Claude Erb have found that, over time, gold prices tend to revert to the mean. When gold is trading at elevated prices in inflation-adjusted terms, prices have often declined in subsequent periods. That happened in 1980, when steep prices were followed by a long period of sluggish returns during most of the following decade. The same pattern showed up when the real price of gold reached a peak in August 2011, which was followed by a sharp downturn from 2013 through 2015.
In short, the recent runup in gold means potential risk is even higher than usual. In my opinion, it’s prudent to limit any gold exposure to 5% of the total portfolio (or less). And it’s important to keep in mind that the current bull run probably won’t last forever.
Current level: Relatively high
What it means: Even after a rate cut, yields on cash are still higher than inflation, making fixed-income securities relatively attractive.
The midpoint of the target range for the federal-funds rate stood at 4.33% as of Aug. 31 (the date for all of the data above) but has since declined to about 4.15%. However, the fed-funds rate remains significantly higher than its low of 0.04% as of late 2011, when the Federal Reserve’s zero interest rate policy reached its nadir. In the wake of the global financial crisis, the Fed aggressively dropped short-term rates to near zero to stabilize the economy. It also purchased US Treasuries and agency mortgages as another way to keep bond yields low. ZIRP and successive rounds of quantitative easing led to a nearly 15-year period of low borrowing costs.
Fast forward to March 2022, and ZIRP became a distant memory as the Fed embarked on a series of aggressive interest-rate hikes to tamp down inflation. But even now that rates have once again been moving lower, yields on cash and short-term securities remain relatively attractive. For example, the three-month Treasury bill yield of about 3.98% as of Sept. 19, 2025, remained well above the most recent annual inflation rate of 2.90%. As a result, investors saving for short-term goals don’t need to worry about the value of their savings eroding over time, at least for the moment.
More broadly, yields on high-quality fixed-income securities remain significantly higher than they were a few years ago. When rates were extremely low, there was nowhere for yields to go but higher and nowhere for bond prices to go but lower. Now we’re clearly in a different environment, making bonds more attractive than they were a decade ago.
Current level: High
What it means: Domestic stocks are priced at steep levels, making international diversification even more important than usual.
US stocks have been the second-best-performing major asset class over the past 20 years (falling just slightly short of gold over that period). Aside from a couple of brief downturns in 2018, early 2020, and 2022, domestic equities have continued to power ahead, with price gains driven by growth in corporate earnings as well as multiple expansion. As a result, the overall price/earnings ratio for the Morningstar US Market Index has more than doubled from its low of 10.19 in the wake of the global financial crisis. The benchmark’s P/E as of Aug. 31 was down slightly from a peak of 28.61 but still on the high end of the range over the past 20 years.
Equity valuations could remain elevated if corporate earnings continue to deliver, but high prices also mean stocks have more room to fall if growth falls short of expectations. And now that valuations have already climbed higher, there’s not as much room for future multiple expansion as a driver of equity market returns.While the US market as a whole isn’t in the bargain bin, there are still some pockets of value available for price-conscious investors. Smaller-cap stocks, as well as sectors such as energy, healthcare, and real estate, look more attractive based on Morningstar’s estimates of their underlying fair value. And valuations on international stocks remain lower than those of their domestic counterparts, despite the strong gains in non-US stocks so far this year.
Current level: Relatively low
What it means: Consider adding a small position in a broad-based commodity fund that includes energy exposure for inflation protection.
The price of oil has been subject to dramatic highs and lows over the past 20 years. At the beginning of the period, prices surged, driven by growing demand from China and other emerging markets, combined with limited supply. As a result, prices reached a peak of about $146 per barrel in July 2008. That was followed by a precipitous drop during the global financial crisis, when the price dropped by more than 50%. Prices partially recovered over the next few years, only to suffer sharp losses in 2014, and 2015 as the OPEC group of major oil-exporting countries kept production levels high, leading to a glut in supply. Fast forward to the pandemic, and oil prices reached a low of $19.33 per barrel in April 2020.
Since then, oil prices have partially recovered but have mostly been in a downtrend over the past few years. Concerns about economic weakness in China and the shift toward renewable energy have weighed on returns. Geopolitical issues such as ongoing wars in the Middle East and Ukraine have also added to uncertainty.Many of these headwinds could continue, and a potential economic slowdown in the United States would be another negative. But for investors who can tolerate risk, a small stake in a broad-based commodities fund that includes exposure to energy could help improve portfolio diversification and hedge against inflation.
Current level: High
What it means: If you don’t already hold bitcoin or other digital assets, beware of buying into the hype.Bitcoin is a newer entrant on the scene and didn’t exist until relatively recently. The pseudonymous Satoshi Nakamoto mined the initial genesis block on the bitcoin blockchain in early 2009, but most buyers couldn’t purchase bitcoin until later in the year. Initial purchases could be made for pennies on the dollar, with a low price of $0.05 per bitcoin in July 2010. Early buyers have racked up spectacular gains since then, and bitcoin’s annualized return of 86.2% over the trailing 10 years ended Aug. 31, 2025, made it by far the best-performing asset class over that period.
However, potential buyers should be aware of bitcoin’s extreme price volatility. In addition to its eye-popping gains, bitcoin has been subject to extreme drawdowns. The price dropped by about 75% between December 2017 and January 2019, and similar amounts during another “crypto winter” between October 2021 and December 2022.
Because bitcoin doesn’t generate cash flows, it’s tough to pin down what its value should be. And while the digital asset has started to gain more credibility among institutional investors, it remains a speculative asset with price swings often driven by fear of missing out. It’s now trading within about 10% of its peak of about $123,000 per bitcoin, making caution even more warranted.
Current level: Relatively high
What it means: The dollar could weaken further over the next several years.
For years, the US dollar seemed unstoppable. The Nominal Broad U.S. Dollar Index hit a low of 85.47 in July 2011 and mostly continued marching upward until the beginning of this year. Toward the start of the dollar’s long climb, it benefited from turmoil in other markets. As countries such as Greece, Italy, Portugal, and Spain grappled with unsustainable debt levels, investors fled euro-denominated assets and took refuge in the dollar instead.Generally strong economic growth and rising corporate earnings in the US also bolstered the dollar, as did the greenback’s undisputed position as the world’s leading reserve currency.
That narrative has started to change. For the year to date through Aug. 31, 2025, the Nominal Broad U.S. Dollar Index dropped about 7%. However, the current index value of 119.83 remains on the high end compared with the dollar’s range over the past 20 years. Central banks around the world have been “de-dollarizing” their reserves by purchasing both gold and other currencies. The rising federal debt, which is equivalent to 119% of gross domestic product, could also weaken investor confidence and further decrease demand for dollar-based assets. Additional rate cuts by the US Federal Reserve later this year would be another factor depressing demand for dollar-based assets.
All of this makes it especially important to make sure your portfolio has some exposure to non-dollar-denominated assets. In addition to domestic equity exposure, most portfolios should include an international-stock fund that doesn’t hedge its currency exposure.
Current level: Very high
What it means: Retirees may have an opportunity to tap into home equity to help cover spending needs, while younger people may be priced out of home buying.After dropping for a few years in the wake of the global financial crisis, US home prices have mostly climbed higher in inflation-adjusted terms. Our customized benchmark of real (inflation-adjusted) housing prices hit a low of 53.33 in early 2012 and is now close to its peak of 94.24.
While housing prices vary by location, many retirees may be sitting on hundreds of thousands of dollars in housing wealth. In the Chicago metropolitan area, for example, the average home is now priced at about $362,000, compared with as low as $160,000 in 2012. Retirees who don’t mind downsizing could sell an existing residence and move into a smaller condo, townhouse, or single-family home. Proceeds from selling a house could also be used to cover part of the costs for moving into a continuing-care retirement community.
Retirees who don’t want to relocate could also consider a home equity loan or home equity conversion mortgage, although both options can be pricey and complex.On the other end of the spectrum, younger people might find themselves priced out of buying a home. They might need to settle for a smaller fixer-upper or continue renting for a few more years while building up savings.
Gold clinched a fresh all-time high, with traders shrugging off cautious commentary from Federal Reserve officials about the outlook for monetary policy after the US central bank cut interest rates last week.
Bullion edged up to hit $3,749.27 on ounce in Asia on Tuesday, following gains in the previous two sessions which included record highs. Investors have piled into exchange-traded funds — with holdings expanding at the fastest pace in more than three years on Friday — following a brief dip in prices last week as Fed Chair Jerome Powell curbed expectations for rapid easing, after the central bank reduced rates on Wednesday. Lower rates benefit typically benefit non-interest bearing precious metals.
“After pulling back the day after the Fed’s 25 basis-point rate cut — potentially on some perceived caution in Powell’s FOMC comments — new upward momentum has taken root with ETF inflows still the driving force,” BMO Capital Markets analysts including Helen Amos and George Heppel said in a note late Monday. “With a rate-cutting cycle firmly on the table we think risk-reward remains positive for prices into” the fourth quarter.
Powell is due to give a highly anticipated speech on the economic outlook later on Tuesday, after the quarterly rate forecasts that accompanied last week’s rate decision — known as the dot plot — showed a wide dispersion of views. Meanwhile, several Fed officials on Monday reiterated the need for taking a cautious approach to rate decisions moving forward, including St. Louis Fed President Alberto Musalem who said that he sees limited room for more reductions amid elevated price pressures.
Silver, meanwhile, held a three-day rally near $44 an ounce. The cheaper precious metal has seen possible support from bullish options trades, with the daily volume of IShares Silver Trust options surging to 1.2 million on Friday — the highest since April 2024, with call options also spiking.
Gold and silver have been among the year’s best-performing major commodities on a broad confluence of supportive factors, as the Fed eases monetary policy, central banks bolster their reserve holdings, and lingering geopolitical tensions sustain a bid for havens. Major banks including Goldman Sachs Group Inc. have flagged their expectations for further gains.
Looking ahead, traders will parse incoming data this week, including Friday’s US personal consumption expenditures price index. The Fed’s preferred measure of underlying inflation likely grew at a slower pace last month, which would boost the argument for rate cuts.
“Investment managers and traders can — and are — offsetting their US core equity with long exposures in gold,” Chris Weston, head of research at Pepperstone Group Ltd., said in a Tuesday note. “The diversifier of choice is the yellow metal, and this makes sense given its low correlation to other major asset classes and the fact everyone can see it ripping higher.”
Key Points:
On September 23, 2025, major U.S. stock indices soared to new record highs, driven by Nvidia's significant $100 billion investment in OpenAI for AI datacenters.This illustrates a tech-driven market upswing, impacting both traditional finance and the cryptocurrency market with notable liquidations as risk capital shifted towards equities.
Nvidia's $100 billion investment in OpenAI, announced on September 23, 2025, spurred record highs for major U.S. stock indices. Key industry leaders, including Jensen Huang of Nvidia and Sam Altman of OpenAI, emphasized the importance of this collaboration for AI development. Nvidia's commitment to AI infrastructure alongside prominent firms propelled tech stocks significantly higher, with Apple's robust rise linked to anticipated iPhone demand.Jensen Huang, CEO of Nvidia, stated, “Nvidia’s investment in OpenAI marks the next leap for AI infrastructure, empowering developers worldwide.”
Crypto markets reacted with notable volatility. In contrast to tech sector gains, Bitcoin saw massive liquidations as its price fell below $115,000, with over $1.5 billion in bullish crypto positions liquidated. Financial analyst Raoul Pal described this as "classic late-cycle action," highlighting sector rotations.
Did you know? Nvidia's $100 billion AI investment is among the largest in tech history, echoing the 2023 Microsoft-OpenAI partnership that similarly boosted tech stocks and strained crypto markets.
As per CoinMarketCap, Bitcoin (BTC) currently trades at $112,675.71, reflecting a 24-hour decline of 2.36%. The circulating supply is 19,924,828 out of a maximum of 21 million BTC, commanding a market dominance of 57.70%. Recent trends show minor decreases across shorter timelines but an overall upward swing in 90 days.
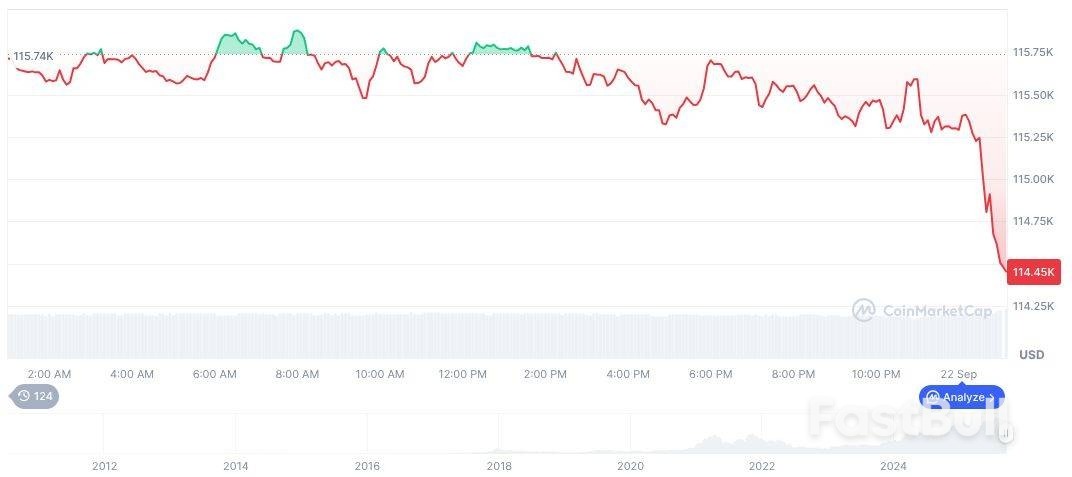 Bitcoin(BTC), daily chart, screenshot on CoinMarketCap at 00:06 UTC on September 23, 2025. Source: CoinMarketCap
Insights from the Coincu research team suggest that Nvidia's bold move may usher in significant technological advances in AI, potentially redirecting investment flows while regulators might increase oversight on both sectors. Historical patterns of tech announcements attracting traditional capital could continue affecting cryptocurrency volatility.
Hong Kong hunkered down for Super Typhoon Ragasa on Tuesday, one of the strongest storms in years, shutting schools and some businesses, while most passenger flights from the city's airport are to be suspended later in the day until early on Thursday.Ragasa, packing hurricane-force winds of up to 220km/h (137 mph) is edging closer to the coast of neighbouring southern Guangdong province in China, the Hong Kong Observatory said.Authorities in the financial hub are set to raise the typhoon signal to 8, its third highest, on Tuesday afternoon, which will prompt most businesses and transport services to shut down. About 700 flights have been disrupted.
The observatory said it will assess if it needs to issue a higher warning later on Tuesday or early Wednesday.Ragasa swept through the northern Philippines on Monday, prompting President Ferdinand Marcos Jr to order the country's disaster response agency to go on full alert and mobilise all government agencies.The Hong Kong Observatory said hurricane force winds offshore and on high grounds were likely in Hong Kong on Wednesday, with heavy rain expected to lead to a significant storm and sea surge in the densely packed city.
It warned of rising sea levels, which it said would be similar to that seen during Typhoon Hato in 2017 and Typhoon Mangkhut in 2018, both of which caused billions of dollars in damage.Water levels will rise about 2 metres (yards) over Hong Kong's coastal areas and maximum water levels could reach up to 4-5 metres in some areas, the observatory said, urging residents to take appropriate precautions.Local authorities handed out sandbags on Monday for residents to bolster their homes in low-lying areas, while many people stockpiled daily necessities.
Long queues formed at supermarkets, milk sold out and vegetable prices at fresh-produce markets tripled, according to Reuters witnesses on Monday.Hong Kong's Stock Exchange will remain open. It changed its policy late last year to continue trading whatever the weather.Chinese authorities have activated flood control measures in several southern provinces, warning of heavy rain from late on Tuesday.Residents in the world's largest gambling hub of Macau are also bracing for significant impact, with school closures and evacuation plans under way.
U.S. President Donald Trump's "border czar" Tom Homan speaks during a press briefing at the White House in Washington, D.C., U.S., April 28, 2025. REUTERS/Evelyn Hockstein/ File Photo
WASHINGTON, Sept 22 (Reuters) - The White House said on Monday that President Donald Trump fully stands by border czar Tom Homan, after Reuters and other media reported Homan accepted a $50,000 payment from an undercover FBI agent last year in a bribery string operation.
Speaking to reporters at a press briefing, White House spokeswoman Karoline Leavitt rejected the reports that Homan had accepted such a payment.
"The White House and the president stand by Tom Homan 100% because he did absolutely nothing wrong," Leavitt said. She said that FBI agents and prosecutors found no evidence of illegal activity or criminal wrongdoing by Homan.
On Sunday, two sources familiar with the matter told Reuters that Homan accepted a $50,000 bag of cash from an undercover FBI agent last year in a since-closed U.S. Justice Department bribery investigation.
In the alleged scheme, Homan promised immigration-related government contracts when he joined the Trump administration in exchange for the money, the sources said, speaking anonymously to discuss nonpublic investigations.
The Trump administration plans to allocate the roughly $2.4 billion that was stripped from California’s embattled high-speed rail to other transit projects.
US Department of Transportation Secretary Sean Duffy said Monday that the funds are a part of a $5 billion package for the National Railroad Partnership Program, which would provide money to intercity passenger rail projects that emphasize safety and critical infrastructure upgrades.
The announcement comes after the federal government moved to slash roughly $4 billion of aid from the state’s high-speed rail project, which has been plagued with significant cost overruns and delays since its approval in 2008. President Donald Trump and Duffy have been long-time critics of that project, arguing that the effort has wasted taxpayer dollars.
“Our new National Railroad Partnership Program will emphasize safety – our number one priority,” said Duffy in a press release.
States, public transit agencies and national passenger railroad Amtrak are among eligible applicants to compete for the aid, according to the press release. The funds would be directed to projects that align with the administration’s “focus on the American family and ensuring a more seamless travel experience,” the release said.
The redirecting of money from California comes as Duffy sharpens his nationwide crackdown on crime in transit systems. He’s threatened to pull funding from agencies that fail to comply and show that they have taken actions to reduce crime.
Earlier this month, the DOT launched an investigation of North Carolina’s light rail system following the Aug. 22 stabbing of Iryna Zarutska, a 23-year-old Ukrainian refugee, on the Lynx Blue Line light rail in Charlotte.
The administration has been targeting Democratic strongholds since Trump took office, deploying the National Guard to Los Angeles and Washington, DC, while threatening to send troops to Chicago and Baltimore.
Duffy has sent letters to the Washington Metropolitan Area Transit Authority, New York’s Metropolitan Transportation Authority and the Los Angeles County Metropolitan Transportation Authority outlining concerns about safety and security on those systems earlier this year.
Last week, Duffy called on the Chicago Transit Authority and Massachusetts Bay Transportation Authority to summarize all sources of funds for fiscal years 2025 and 2026 related to security, safety, funds from federal agencies and the Department of Homeland Security or risk losing government support.
728 RM B 7/F GEE LOK IND BLDG NO 34 HUNG TO RD KWUN TONG KLN HONG KONG


White Label
Data API
Web Plug-ins
Poster Maker
Affiliate Program
The risk of loss in trading financial instruments such as stocks, FX, commodities, futures, bonds, ETFs and crypto can be substantial. You may sustain a total loss of the funds that you deposit with your broker. Therefore, you should carefully consider whether such trading is suitable for you in light of your circumstances and financial resources.
No decision to invest should be made without thoroughly conducting due diligence by yourself or consulting with your financial advisors. Our web content might not suit you since we don't know your financial conditions and investment needs. Our financial information might have latency or contain inaccuracy, so you should be fully responsible for any of your trading and investment decisions. The company will not be responsible for your capital loss.
Without getting permission from the website, you are not allowed to copy the website's graphics, texts, or trademarks. Intellectual property rights in the content or data incorporated into this website belong to its providers and exchange merchants.
Not Logged In
Log in to access more features

FastBull Membership
Not yet
Purchase


Log In
Sign Up


