• Trade
  • Markets
  • Copy
  • Contests
  • News
  • 24/7
  • Calendar
  • Q&A
  • Chats
Trending
Screeners
SYMBOL
LAST
BID
ASK
HIGH
LOW
NET CHG.
%CHG.
SPREAD
SPX
S&P 500 Index
6827.42
6827.42
6827.42
6899.86
6801.80
-73.58
-1.07%
--
DJI
Dow Jones Industrial Average
48458.04
48458.04
48458.04
48886.86
48334.10
-245.98
-0.51%
--
IXIC
NASDAQ Composite Index
23195.16
23195.16
23195.16
23554.89
23094.51
-398.69
-1.69%
--
USDX
US Dollar Index
97.950
98.030
97.950
98.500
97.950
-0.370
-0.38%
--
EURUSD
Euro / US Dollar
1.17394
1.17409
1.17394
1.17496
1.17192
+0.00011
+ 0.01%
--
GBPUSD
Pound Sterling / US Dollar
1.33707
1.33732
1.33707
1.33997
1.33419
-0.00148
-0.11%
--
XAUUSD
Gold / US Dollar
4299.39
4299.39
4299.39
4353.41
4257.10
+20.10
+ 0.47%
--
WTI
Light Sweet Crude Oil
57.233
57.485
57.233
58.011
56.969
-0.408
-0.71%
--

Community Accounts

Signal Accounts
--
Profit Accounts
--
Loss Accounts
--
View More

Become a signal provider

Sell trading signals to earn additional income

View More

Guide to Copy Trading

Get started with ease and confidence

View More

Signal Accounts for Members

All Signal Accounts

Best Return
  • Best Return
  • Best P/L
  • Best MDD
Past 1W
  • Past 1W
  • Past 1M
  • Past 1Y

All Contests

  • All
  • Trump Updates
  • Recommend
  • Stocks
  • Cryptocurrencies
  • Central Banks
  • Featured News
Top News Only
Share

Kuwait's Oil Minister Says Searching For Partner In Petrochemical Project In Oman's Duqm But Ready To Move Ahead With Oman If No Investor Found

Share

Kuwait's Oil Minister Says: We Expected Prices To Remain At Least As They Were, If Not Better, But We Were Surprised By Their Drop

Share

Kuwait Sees Fair Oil Price At $60-$68 A Barrel Under Current Conditions

Share

Syria Produces About 100000 Barrels/Day And Aims To Boost Output If Issues East Of The Euphrates Are Resolved

Share

Australia Intelligence Official: National Terrorism Threat Level Remains At Probable

Share

Australia Intelligence Official: We're Looking To See If There Are Anyone In The Community That Has Similar Intent

Share

Australia Intelligence Official: We Are Looking At The Identities Of The Attackers

Share

Australia Prime Minister: Tells Jews We Will Dedicate Every Resource Required To Making Sure You Are Safe And Protected

Share

Australia Prime Minister: Police And Security Agencies Are Working To Determine Anyone Associated With This Outrage

Share

Australia Police: Police Bomb Disposal Unit Currently Working On Several Suspected Improvised Explosive Devices

Share

Syria's Oil Ministry Forecasts Country's Gas Production To Increase To 15 Million Cubic Meters By End Of 2026

Share

His Office: Ukraine's President Zelenskiy Landed In Germany

Share

Australia Police: This Is Not A Time For Retribution. This Is A Time To Allow The Police To Do Their Duty

Share

Australia Police: We Know That We Have Two Definite Offenders, But We Want To Make Sure The Community Is Safe

Share

Australia Police: Our Counter-Terrorism Command Will Lead This Investigation With Investigators From The State Crime Command. No Stone Will Be Left Unturned

Share

Australia Police: This Is A Terrorist Incident

Share

Ukraine President Zelenskiy: Ukraine-Russia Ceasefire Along The Current Frontlines Would Be A Fair Option

Share

New South Wales Premier Chris Minns: This Is A Massive, Complex And Just Beginning Investigation

Share

New South Wales Premier Chris Minns: 12 Killed In Bondi Shooting

Share

Ukraine President Zelenskiy: Security Guarantees Should Be Legally Binding

TIME
ACT
FCST
PREV
U.K. Trade Balance (Oct)

A:--

F: --

P: --

U.K. Services Index MoM

A:--

F: --

P: --

U.K. Construction Output MoM (SA) (Oct)

A:--

F: --

P: --

U.K. Industrial Output YoY (Oct)

A:--

F: --

P: --

U.K. Trade Balance (SA) (Oct)

A:--

F: --

P: --

U.K. Trade Balance EU (SA) (Oct)

A:--

F: --

P: --

U.K. Manufacturing Output YoY (Oct)

A:--

F: --

P: --

U.K. GDP MoM (Oct)

A:--

F: --

P: --

U.K. GDP YoY (SA) (Oct)

A:--

F: --

P: --

U.K. Industrial Output MoM (Oct)

A:--

F: --

P: --

U.K. Construction Output YoY (Oct)

A:--

F: --

P: --

France HICP Final MoM (Nov)

A:--

F: --

P: --

China, Mainland Outstanding Loans Growth YoY (Nov)

A:--

F: --

P: --

China, Mainland M2 Money Supply YoY (Nov)

A:--

F: --

P: --

China, Mainland M0 Money Supply YoY (Nov)

A:--

F: --

P: --

China, Mainland M1 Money Supply YoY (Nov)

A:--

F: --

P: --

India CPI YoY (Nov)

A:--

F: --

P: --

India Deposit Gowth YoY

A:--

F: --

P: --

Brazil Services Growth YoY (Oct)

A:--

F: --

P: --

Mexico Industrial Output YoY (Oct)

A:--

F: --

P: --

Russia Trade Balance (Oct)

A:--

F: --

P: --

Philadelphia Fed President Henry Paulson delivers a speech
Canada Building Permits MoM (SA) (Oct)

A:--

F: --

P: --

Canada Wholesale Sales YoY (Oct)

A:--

F: --

P: --

Canada Wholesale Inventory MoM (Oct)

A:--

F: --

P: --

Canada Wholesale Inventory YoY (Oct)

A:--

F: --

P: --

Canada Wholesale Sales MoM (SA) (Oct)

A:--

F: --

P: --

Germany Current Account (Not SA) (Oct)

A:--

F: --

P: --

U.S. Weekly Total Rig Count

A:--

F: --

P: --

U.S. Weekly Total Oil Rig Count

A:--

F: --

P: --

Japan Tankan Large Non-Manufacturing Diffusion Index (Q4)

--

F: --

P: --

Japan Tankan Small Manufacturing Outlook Index (Q4)

--

F: --

P: --

Japan Tankan Large Non-Manufacturing Outlook Index (Q4)

--

F: --

P: --

Japan Tankan Large Manufacturing Outlook Index (Q4)

--

F: --

P: --

Japan Tankan Small Manufacturing Diffusion Index (Q4)

--

F: --

P: --

Japan Tankan Large Manufacturing Diffusion Index (Q4)

--

F: --

P: --

Japan Tankan Large-Enterprise Capital Expenditure YoY (Q4)

--

F: --

P: --

U.K. Rightmove House Price Index YoY (Dec)

--

F: --

P: --

China, Mainland Industrial Output YoY (YTD) (Nov)

--

F: --

P: --

China, Mainland Urban Area Unemployment Rate (Nov)

--

F: --

P: --

Saudi Arabia CPI YoY (Nov)

--

F: --

P: --

Euro Zone Industrial Output YoY (Oct)

--

F: --

P: --

Euro Zone Industrial Output MoM (Oct)

--

F: --

P: --

Canada Existing Home Sales MoM (Nov)

--

F: --

P: --

Euro Zone Total Reserve Assets (Nov)

--

F: --

P: --

U.K. Inflation Rate Expectations

--

F: --

P: --

Canada National Economic Confidence Index

--

F: --

P: --

Canada New Housing Starts (Nov)

--

F: --

P: --

U.S. NY Fed Manufacturing Employment Index (Dec)

--

F: --

P: --

U.S. NY Fed Manufacturing Index (Dec)

--

F: --

P: --

Canada Core CPI YoY (Nov)

--

F: --

P: --

Canada Manufacturing Unfilled Orders MoM (Oct)

--

F: --

P: --

Canada Manufacturing New Orders MoM (Oct)

--

F: --

P: --

Canada Core CPI MoM (Nov)

--

F: --

P: --

Canada Manufacturing Inventory MoM (Oct)

--

F: --

P: --

Canada CPI YoY (Nov)

--

F: --

P: --

Canada CPI MoM (Nov)

--

F: --

P: --

Canada CPI YoY (SA) (Nov)

--

F: --

P: --

Canada Core CPI MoM (SA) (Nov)

--

F: --

P: --

Canada CPI MoM (SA) (Nov)

--

F: --

P: --

Q&A with Experts
    • All
    • Chatrooms
    • Groups
    • Friends
    Connecting
    .
    .
    .
    Type here...
    Add Symbol or Code

      No matching data

      All
      Trump Updates
      Recommend
      Stocks
      Cryptocurrencies
      Central Banks
      Featured News
      • All
      • Russia-Ukraine Conflict
      • Middle East Flashpoint
      • All
      • Russia-Ukraine Conflict
      • Middle East Flashpoint
      Search
      Products

      Charts Free Forever

      Chats Q&A with Experts
      Screeners Economic Calendar Data Tools
      Membership Features
      Data Warehouse Market Trends Institutional Data Policy Rates Macro

      Market Trends

      Market Sentiment Order Book Forex Correlations

      Top Indicators

      Charts Free Forever
      Markets

      News

      News Analysis 24/7 Columns Education
      From Institutions From Analysts
      Topics Columnists

      Latest Views

      Latest Views

      Trending Topics

      Top Columnists

      Latest Update

      Signals

      Copy Rankings Latest Signals Become a signal provider AI Rating
      Contests
      Brokers

      Overview Brokers Assessment Rankings Regulators News Claims
      Broker listing Forex Brokers Comparison Tool Live Spread Comparison Scam
      Q&A Complaint Scam Alert Videos Tips to Detect Scam
      More

      Business
      Events
      Careers About Us Advertising Help Center

      White Label

      Data API

      Web Plug-ins

      Affiliate Program

      Awards Institution Evaluation IB Seminar Salon Event Exhibition
      Vietnam Thailand Singapore Dubai
      Fans Party Investment Sharing Session
      FastBull Summit BrokersView Expo
      Recent Searches
        Top Searches
          Markets
          News
          Analysis
          User
          24/7
          Economic Calendar
          Education
          Data
          • Names
          • Latest
          • Prev

          View All

          No data

          Scan to Download

          Faster Charts, Chat Faster!

          Download App
          English
          • English
          • Español
          • العربية
          • Bahasa Indonesia
          • Bahasa Melayu
          • Tiếng Việt
          • ภาษาไทย
          • Français
          • Italiano
          • Türkçe
          • Русский язык
          • 简中
          • 繁中
          Open Account
          Search
          Products
          Charts Free Forever
          Markets
          News
          Signals

          Copy Rankings Latest Signals Become a signal provider AI Rating
          Contests
          Brokers

          Overview Brokers Assessment Rankings Regulators News Claims
          Broker listing Forex Brokers Comparison Tool Live Spread Comparison Scam
          Q&A Complaint Scam Alert Videos Tips to Detect Scam
          More

          Business
          Events
          Careers About Us Advertising Help Center

          White Label

          Data API

          Web Plug-ins

          Affiliate Program

          Awards Institution Evaluation IB Seminar Salon Event Exhibition
          Vietnam Thailand Singapore Dubai
          Fans Party Investment Sharing Session
          FastBull Summit BrokersView Expo

          Oil Prices Fall Amid Middle East Peace Talks and Rising US Inventories

          Gerik

          Economic

          Commodity

          Summary:

          Oil prices saw a slight dip as traders shifted their focus to the easing of tensions in the Middle East and the growing stockpiles in the United States. Brent crude dropped below $66 per barrel after a previous rise of over 1%, while West Texas Intermediate hovered around $62. ...

          The latest developments in the Middle East, including an agreement between Israel and Hamas for the release of hostages, brought a sense of optimism, signaling a potential reduction in the region's geopolitical risks. US President Donald Trump mentioned that a visit to Israel could be imminent, further supporting the peace process.

          Middle East Peace Plan and US Crude Inventories

          The breakthrough in the peace talks, mediated by the US and Qatar, has sparked hopes of calming the two-year war between Israel and Hamas. However, concerns remain as crude prices are still under pressure due to factors outside the Middle East.
          In the US, crude stockpiles increased for the second consecutive week, adding more supply to the market. Despite this, the levels of oil stored in Cushing, Oklahoma, declined, alongside a drop in refined product inventories, signaling a possible shift in the supply chain dynamics.
          Geopolitical and Supply Factors Impacting the Oil Market
          While the Middle East conflict is a major concern for global oil supply, the increasing supply from OPEC and other producing nations such as those in the Americas is adding to the pressure. Geopolitical factors outside the Middle East, particularly Ukrainian attacks on Russian oil infrastructure, are also influencing global oil flows.
          Despite the expectations for a surplus in the oil market in the coming months, analysts are divided on how deeply prices will fall. Goldman Sachs, among others, predicts a future average price of $56 per barrel for Brent crude next year as global production is expected to outpace demand. Citigroup, however, suggests that the oil market's outlook could be tempered by non-OPEC+ growth and risks from large producers like Russia and Iran.
          Overall, the oil market remains under significant pressure, with a potential surplus of global supply set to keep prices subdued. However, geopolitical risks, such as the situation in Russia and Iran, continue to complicate the forecast. While some analysts expect a downturn in prices, others believe the pace of decline may be slower due to these uncertainties.

          Source: Bloomberg

          To stay updated on all economic events of today, please check out our Economic calendar
          Risk Warnings and Disclaimers
          You understand and acknowledge that there is a high degree of risk involved in trading. Following any strategies or investment methods may lead to potential losses. The content on the site is provided by our contributors and analysts for information purposes only. You are solely responsible for determining whether any trading assets, securities, strategy, or any other product is suitable for investing based on your own investment objectives and financial situation.
          Add to Favorites
          Share

          U.S. Government Shutdown Stalemate Persists, Gaza Ceasefire Talks Show Signs of Progress

          FastBull Featured

          Daily News

          [Quick Facts]

          1. U.S. Senate fails again to pass Government Funding Bill to end shutdown.
          2. Gaza Ceasefire Talks continue, Hamas demands "International Guarantees" for implementation.
          3. German government raises 2025 economic growth forecast, expects faster growth next year.
          4. Trump claims Israel and Hamas have agreed to the "first phase" of a peace deal.
          5. Fed Minutes: Further rate cuts expected this year, tariffs to keep inflation high.
          6. Canadian rents fall for the 12th consecutive month.

          [News Details]

          U.S. Senate fails again to pass Government Funding Bill to end shutdown
          The U.S. Senate failed to pass government funding bills, pushing the Trump administration's shutdown into its second week. Around 12:50 p.m. Eastern Time, a Democrat-backed bill failed with a vote of 47-52. Shortly afterward, a Republican version was put to a vote. In the previous five votes, these closely contested stopgap measures had all failed. Democrats are pushing for any funding bill to include health care provisions, particularly an extension of Obamacare subsidies set to expire at the end of the year.
          Gaza Ceasefire Talks continue, Hamas demands "International Guarantees" for implementation
          On the 8th, a new round of Gaza ceasefire negotiations between the Palestinian Islamic Resistance Movement (Hamas) and Israel continued in Sharm El-Sheikh, Egypt. According to media outlets such as Al Jazeera, Hamas presented several demands during the previous day's talks: first, Israel must completely end its occupation of Gaza, which must be guaranteed internationally; second, the release of Israeli hostages must be tied to the full withdrawal of Israeli forces. The Israeli government has not yet commented on the progress of the negotiations.
          The day before, Hamas chief negotiator Khalil al-Hayya said in an interview with Cairo News Channel that the Hamas delegation’s goal in coming to Egypt was clear: to immediately stop the conflict, ensure Israel’s withdrawal from Gaza, and reach a deal for the exchange of hostages. He emphasized that Israel must completely end its occupation of Gaza, which must be "genuinely guaranteed" by the ceasefire mediators.
          German government raises 2025 economic growth forecast, expects faster growth next year
          According to updated government projections, Germany's economy is expected to grow modestly by 0.2% this year, but with hundreds of billions of euros in fiscal stimulus, growth is forecast to accelerate to 1.3% in 2026. The latest semi-annual forecast released by German Economy Minister Katherina Reiche on Wednesday is slightly more optimistic than the previous government's April outlook and aligns with projections from major German economic research institutes. Reiche acknowledged that much of the growth in the coming years will come from a surge in government spending, but she warned that the effectiveness of stimulus measures "depends on whether investments can be quickly implemented."
          Trump claims Israel and Hamas have agreed to the "first phase" of a peace deal
          U.S. President Donald Trump announced on social media on the evening of the 8th that Israel and Hamas have agreed to the "first phase" of a peace deal. "This means that ALL of the Hostages will be released very soon, and Israel will withdraw their Troops to an agreed upon line as the first steps toward a Strong, Durable, and Everlasting Peace," Trump wrote on social media.
          "Everybody will be treated fairly," said Trump. He also thanked Qatar, Egypt, and Turkey as mediators, saying their representatives worked with the U.S. to make this historic event possible. Cairo News Channel later reported that Egyptian, Qatari, and other mediator representatives announced that a new round of Gaza ceasefire negotiations had reached an agreement covering all terms and implementation mechanisms of the first phase of the ceasefire, confirming that the final version of the agreement is currently being drafted.
          Hamas and the Israeli Prime Minister's Office each issued statements confirming the agreement. According to earlier reports from The Times of Israel, citing multiple negotiation insiders, the main hurdles in Gaza ceasefire talks have been resolved, with only procedural matters remaining. Israel and Hamas are expected to sign the agreement on the 9th, with Israeli hostages likely to be released on the 11th.
          Fed Minutes: Further rate cuts expected this year, tariffs to keep inflation high
          On October 8th, the Federal Reserve released the minutes of its September meeting, showing that the decision to cut the benchmark interest rate by 25 basis points was supported by the vast majority of committee members. The sole dissent came from new Governor Stephen Miran, who advocated for a larger 50-basis-point cut, citing "labor market conditions had softened", and core inflation is now significantly close to its "2 percent objective."
          Participants noted that, in these circumstances, if policy were eased too much or too soon and inflation continued to be elevated, then longer-term inflation expectations could become unanchored and make restoring price stability even more challenging. By contrast, if policy rates were kept too high for too long, then unemployment could rise unnecessarily, and the economy could slow sharply.
          Tariff increases were still expected to raise inflation this year and to provide some further upward pressure on inflation in 2026. Inflation was projected to decline in 2026, to reach 2 percent in 2027. However, the staff continued to view the uncertainty around the projection as elevated, primarily reflecting uncertainty regarding changes to economic policies, including those for trade, immigration, fiscal spending, and regulation, and their associated economic effects.
          Participants noted that the low level of estimated job gains over recent months likely reflected declines in growth of both labor supply and labor demand. With regard to the outlook for the labor market, participants generally expected that, under appropriate monetary policy, labor market conditions would be little changed or would soften modestly.
          Canadian rents fall for the 12th consecutive month
          Canadian rents declined year-over-year in September, partly due to a weakening job market. Detailed data from real estate firm Urbanation showed that upward pressure on inflation is easing, providing some relief to the Bank of Canada, which may consider further rate cuts. Urbanation reported that asking rents fell 3.2% in September, marking the 12th consecutive month of year-over-year declines. The drop in September was attributed to increased rental supply, immigration restrictions, and a weak labor market. Data showed that Canadian rents are 1.2% lower than they were two years ago. However, Urbanation noted that average rents over the past three months have remained relatively flat.

          [Today's Focus]

          UTC+8 15:00 Speech by ECB Governing Council Member François Villeroy de Galhau
          UTC+8 16:30 Speech by BOE Monetary Policy Committee Member Catherine Mann
          UTC+8 18:00 Speech by ECB Governing Council Member José Luis Escrivá
          UTC+8 19:30 September Monetary Policy Meeting Minutes from the ECB
          UTC+8 20:30 Speech by Federal Reserve Chair Jerome Powell
          UTC+8 20:35 Speech by Federal Reserve Governor Michelle Bowman
          UTC+8 (The Next Day) 00:45 Speech by Federal Reserve Governor Michael Barr on the Economic Outlook
          Risk Warnings and Disclaimers
          You understand and acknowledge that there is a high degree of risk involved in trading. Following any strategies or investment methods may lead to potential losses. The content on the site is provided by our contributors and analysts for information purposes only. You are solely responsible for determining whether any trading assets, securities, strategy, or any other product is suitable for investing based on your own investment objectives and financial situation.
          Add to Favorites
          Share

          SOL’s Next Stop Could Be $300: 3 Forces Shaping Solana’s Next Major Rally

          Samantha Luan

          Cryptocurrency

          Forex

          Economic

          Key takeaways:

          ● Solana ETFs and ETPs recorded $706 million in weekly inflows, outpacing XRP’s $219 million, per CoinShares.

          ● SOL funding rates stayed below the 6% neutral level, signaling reduced appetite for leveraged bullish positions among traders.

          Solana’s native token, SOL, climbed back to $229 on Tuesday after briefly dipping to $218. The move came as investors responded positively to the US Federal Reserve’s release of minutes from its Sept. 17 meeting, which reaffirmed expectations of additional interest rate cuts in 2025.Traders remain optimistic that SOL could advance toward the $300 mark, a target that appears realistic given the strong bullish sentiment reflected in derivatives metrics and onchain data.

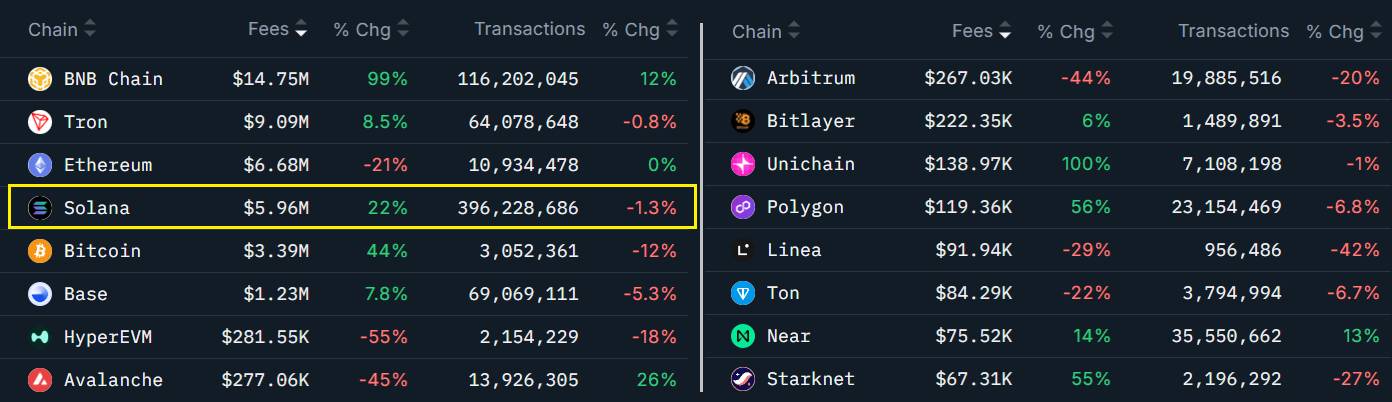
          Blockchains ranked by 7-day fees. Source: Nansen

          Solana recorded a 22% increase in seven-day network fees, driven by rising activity across decentralized exchanges (DEXs). Meanwhile, its main rival by deposits, Ethereum, saw the opposite trend, with network revenue falling 21% during the same period. Solana continues to dominate in transaction count, surpassing the combined total of Ethereum and its layer-2 ecosystem.

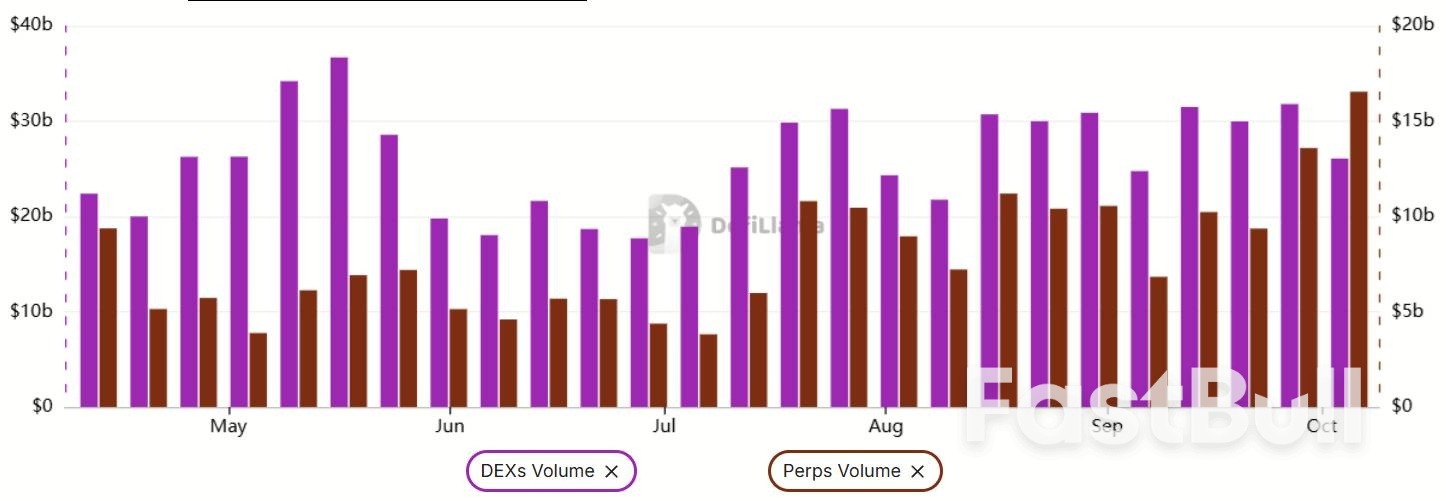
          Weekly Solana DEX (left) and perpetual (right) volumes, USD. Source: DefiLlama

          DEX volumes on Pump rose 78% over the past seven days, followed by a 73% increase on Meteora and a 46% rise on Raydium. Solana regained its leading position in decentralized exchange activity, posting $129 billion in 30-day volume and surpassing Ethereum’s $114 billion, according to DefiLlama data. Notably, the fastest-growing rival, Hyperliquid, has stalled at around $31 billion.

          Solana network activity increases

          Network fees remain a key element for any blockchain focused on decentralized applications, particularly when the revenue helps offset inflationary pressures. Unless the system is centralized, maintaining validators incurs costs, and staking participants expect a reasonable return. In short, weak network activity discourages holding the native token and can trigger sell pressure.

          Solana’s total value locked (TVL) rose 8% in 30 days, supporting further growth in network fees. Standout performers included a 20% rise in Kamino deposits, 12% in Drift, and 12% in Orca. By comparison, Ethereum’s TVL increased 3% over the same period, while Tron deposits grew 6%. As a result, Solana has solidified its position as the second-largest network, with $14.2 billion in TVL, representing an 8% market share.

          The rapid surge in activity on the perpetual futures trading platform Aster has redirected traders’ focus toward BNB Chain, following a wave of memecoins that soared 150% or more within seven days. As a result, even though SOL’s price rose 3% during the same period, BNB’s remarkable 28% rally weighed on sentiment among Solana ecosystem investors.

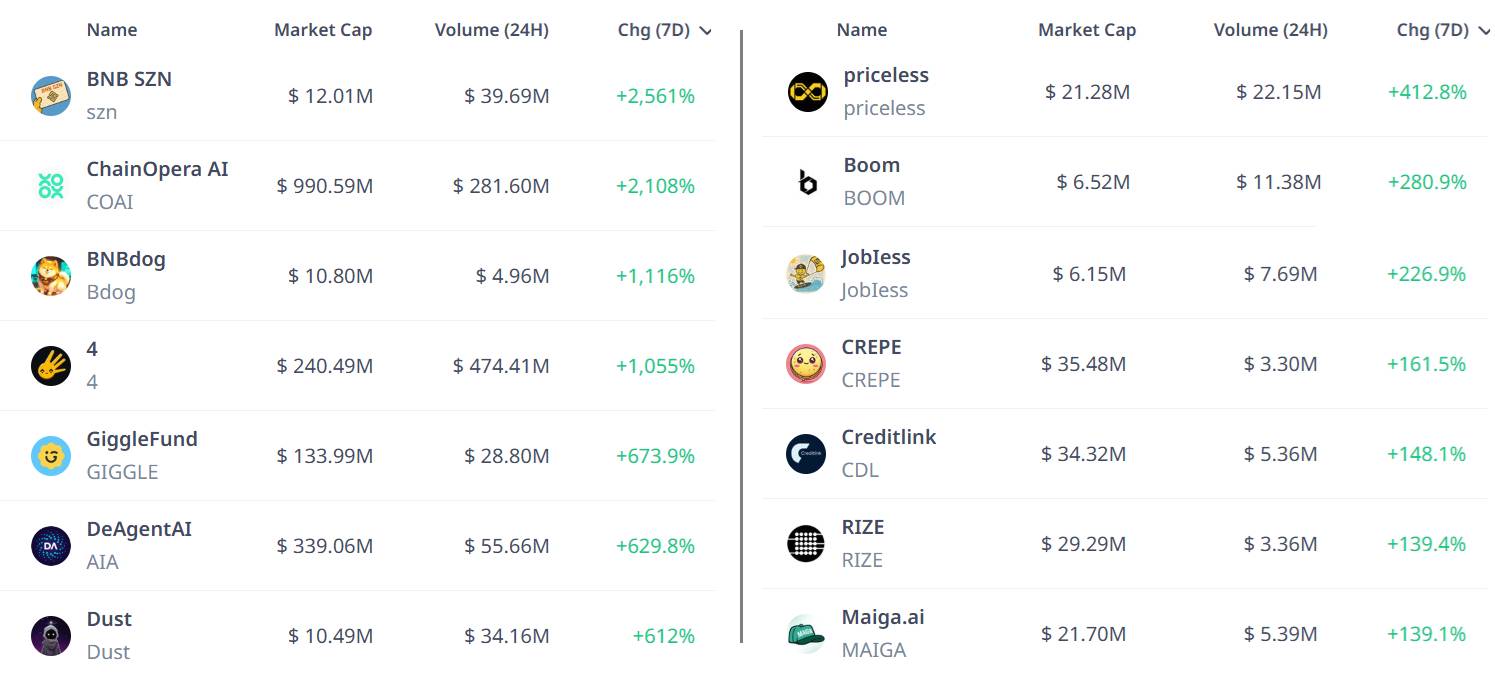
          Top 7-day performances of BNB Chain tokens, USD. Source: Cryptorank.io

          Rising inflows to SOL ETPs signal increasing institutional demand

          Data from SOL perpetual futures provides insight into whether traders have lost confidence after the failed attempt to break above $250 on Sept. 18. Many SOL holders are likely frustrated, especially as some rival tokens have recently reached new all-time highs, including BNB at $1,357 on Tuesday and Mantle at $2.81 on Wednesday.

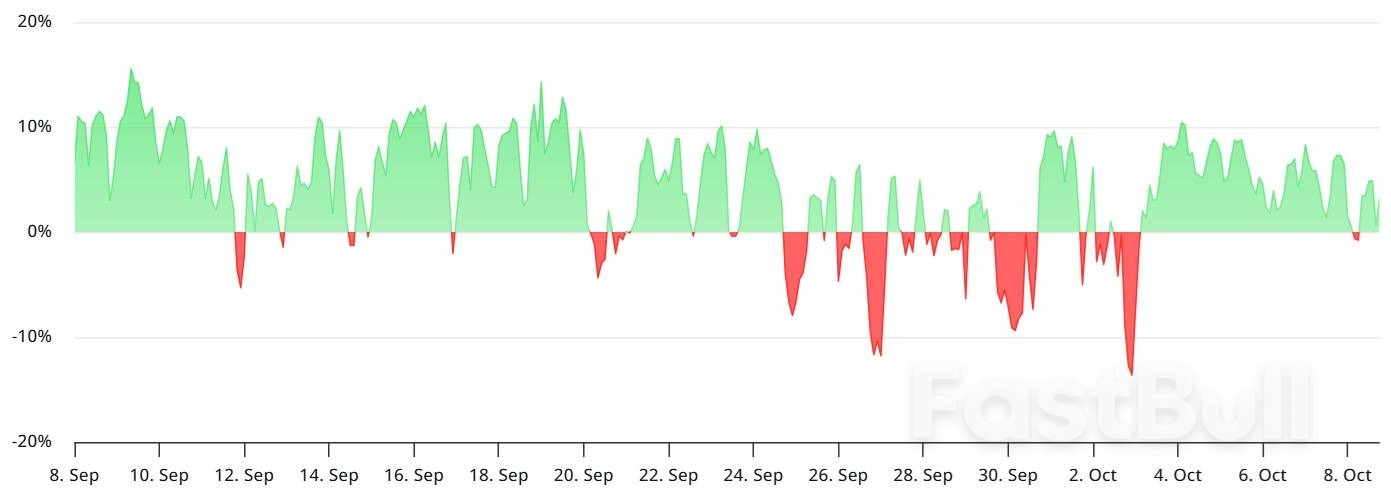
          SOL perpetual futures funding rate, annualized. Source: laevitas.ch

          The funding rate on SOL perpetual futures has remained below the 6% neutral threshold, signaling weak demand for bullish leveraged positions. This cautious stance among traders may be partly attributed to the growing traction of competing blockchains, which have drawn attention away from Solana despite record weekly inflows into its exchange-traded products.

          CoinShares reported that Solana ETFs and ETPs attracted $706 million in inflows during the seven days ending Sept. 5, far surpassing the $219 million recorded by XRP instruments. Investors now anticipate that the US Securities and Exchange Commission will approve multiple spot Solana ETFs on Friday, a development that could drive additional institutional inflows and potentially push SOL’s price beyond $300.

          Source: CryptoSlate

          To stay updated on all economic events of today, please check out our Economic calendar
          Risk Warnings and Disclaimers
          You understand and acknowledge that there is a high degree of risk involved in trading. Following any strategies or investment methods may lead to potential losses. The content on the site is provided by our contributors and analysts for information purposes only. You are solely responsible for determining whether any trading assets, securities, strategy, or any other product is suitable for investing based on your own investment objectives and financial situation.
          Add to Favorites
          Share

          Gold's Record-Breaking Rally: Forecasts and Analysis for Continued Gains

          Gerik

          Economic

          Commodity

          As of now, gold is on track for its best year since 1979, when runaway inflation drove investors toward safe-haven assets. Despite its remarkable rally, analysts are divided on how much further it can climb, with some forecasting even higher prices in the short-term.

          Goldman Sachs: A Continued Surge with 22% Growth Expected by 2026

          Goldman Sachs has set a bullish outlook for gold, raising its price target to $4,900 per ounce by December 2026. This would represent a 20% increase over the next year. The investment bank's optimistic view is driven by strong central bank demand, with purchases expected to average 80 metric tons in 2025 and 70 metric tons in 2026.
          Additionally, the bank predicts that Western investors will continue driving inflows into gold ETFs, bolstered by the Federal Reserve's anticipated rate cuts. These factors are expected to support gold's upward trajectory for the foreseeable future.

          HSBC: Limited Upside with Potential for a Moderation in 2026

          HSBC’s forecast is more conservative. The bank sees gold trading within a range of $3,600 to $4,400 per ounce in 2026, implying an 8% increase from its current levels. Geopolitical uncertainties and concerns over the Fed’s independence are expected to maintain upward pressure on prices in the near term.
          However, HSBC analysts caution that as the rally matures, factors such as increased supply and reduced physical demand could lead to price moderation in the second half of 2026. In the long term, the bank projects prices will ease slightly to around $3,950 in 2026 and further decline to $3,600 by 2027.

          Bank of America: Potential Resistance at $4,000, But $5,000 Is Still Within Reach

          Bank of America has pointed out signs that gold's momentum might be weakening, noting that the metal has been up for seven consecutive weeks and is currently trading 21% above its 200-day moving average.
          Historical patterns suggest that gold might face resistance around the $4,000 mark, but there is also the possibility of a surge to $5,000 before encountering further challenges. The bank draws comparisons to the 2015-2020 period when gold experienced a dramatic 85% rally before correcting.
          Ed Yardeni: Long-Term Bullish Outlook with a Potential $10,000 Price Target by 2030
          Ed Yardeni, president of Yardeni Research, presents a highly optimistic view of gold’s future, predicting that the metal could reach $5,000 by the end of 2026 and potentially surge to $10,000 by the end of the decade. This represents a 146% gain over the next five years. Yardeni’s bullishness is rooted in ongoing economic uncertainty, central bank buying, and the "Gold Put" provided by central banks diversifying their reserves into gold.
          In conclusion, while there are varying opinions on how much further gold can rise, the consensus is that economic uncertainties and central bank demand will continue to fuel its price appreciation. The forecasts range from moderate increases to a potential massive surge over the next few years, with analysts continuing to closely monitor inflation trends, geopolitical developments, and the broader financial landscape.

          Source: Business Insider

          To stay updated on all economic events of today, please check out our Economic calendar
          Risk Warnings and Disclaimers
          You understand and acknowledge that there is a high degree of risk involved in trading. Following any strategies or investment methods may lead to potential losses. The content on the site is provided by our contributors and analysts for information purposes only. You are solely responsible for determining whether any trading assets, securities, strategy, or any other product is suitable for investing based on your own investment objectives and financial situation.
          Add to Favorites
          Share

          China Stocks Rise as AI Enthusiasm Outshines Tepid Spending Data

          Gerik

          Economic

          Stocks

          The CSI 300 Index gained 0.6% after opening, while Chinese stocks listed in Hong Kong saw a slight decline of 0.3%. Despite signs of economic weakness, such as weak holiday consumption and disappointing box office earnings, investors remained buoyed by the positive global sentiment around AI advancements, particularly driven by companies like OpenAI. The rally in Chinese equities has been notably fueled by chip stocks after major announcements from DeepSeek and Huawei Technologies.

          AI-Driven Optimism vs. Weak Consumer Spending

          The recent Golden Week spending data revealed a consumer shift towards more budget-conscious behavior, with weak performance in movie ticket sales and airline bookings, as reported by major financial institutions like Morgan Stanley. This was reflected in declines in entertainment stocks, such as Maoyan Entertainment, as well as a shift from air and rail to highway travel. Although overall passenger traffic increased by almost 7%, this growth marked a decline compared to previous holiday periods. Analysts from Julius Baer noted that consumer-related stocks might experience profit-taking due to these signs of ongoing consumption weakness.
          Nevertheless, the global AI trend has continued to fuel market optimism. AI developments such as the launch of DeepSeek's new AI model and Huawei's plans to double AI chip production have driven investment interest in Chinese stocks, particularly in the tech and chip sectors. Despite the ongoing challenges in consumer sentiment, the broader enthusiasm for AI technology has kept many investors hopeful for a rebound in China’s tech sector.

          Policy and Market Expectations

          As investors look forward to the upcoming Communist Party meeting, attention is shifting to potential policy signals that could address domestic demand weakness. In late September, China introduced a $70 billion capital injection aimed at boosting investment, and the market expects further policy interventions to stimulate domestic consumption. Analysts anticipate that policy measures could focus on addressing deflationary pressures and unlocking excess savings to reinvigorate consumption, which could offer a much-needed boost for China’s economy in the coming months.

          Yuan’s Resilience and Market Sentiment

          Despite a slight dip in the offshore yuan during the holiday period, it remains stronger by over 2% year-to-date, as demand for Chinese assets grows. The market is closely monitoring the People’s Bank of China’s reference rate for further policy guidance, as stability in the yuan will likely serve as a stabilizing factor for regional currencies. Analysts expect the yuan to strengthen further to around 7.07 per dollar by the end of the year, driven by resilient export performance and anticipated demand-side stimulus.
          China’s stock market surged on AI-driven optimism despite weak holiday spending, with investors hopeful that global AI momentum will spill over into the Chinese market. Consumer sentiment remains sluggish, as evidenced by Golden Week data, but expectations of policy measures to stimulate domestic demand may provide support for the market. The yuan remains resilient, with analysts forecasting further strength by year-end.

          Source: Bloomberg

          To stay updated on all economic events of today, please check out our Economic calendar
          Risk Warnings and Disclaimers
          You understand and acknowledge that there is a high degree of risk involved in trading. Following any strategies or investment methods may lead to potential losses. The content on the site is provided by our contributors and analysts for information purposes only. You are solely responsible for determining whether any trading assets, securities, strategy, or any other product is suitable for investing based on your own investment objectives and financial situation.
          Add to Favorites
          Share

          Oil Tankers Jam Seas as Global Glut Builds: A Detailed Analysis

          Gerik

          Economic

          Commodity

          According to data from Vortexa cited by Bloomberg, there are currently 1.2 billion barrels of crude oil being moved across the seas, with some of these barrels stored in floating storage, bringing the total to the highest level since 2020. This suggests a looming imbalance in the oil market, with production rates far exceeding consumption rates.

          Oversupply and the Challenges it Brings

          This surge in oil at sea raises alarms, as it reflects a situation where oil is being moved from one location to another, searching for buyers rather than being transported between already-secured buyers and sellers. Essentially, the oil appears to be moving without the usual demand backing it up. Oil producers are facing pressure as the market becomes oversaturated, with diminishing returns on their investments.
          However, despite this oversupply, the situation is not entirely bleak for oil-consuming nations, especially China. The country has absorbed much of the excess oil, hoarding barrels since the start of 2025. Chinese state-owned energy companies are responding by investing in new storage capacities, further accelerating the stockpiling of crude oil. In 2025 and 2026, China plans to build 11 new storage sites, with a capacity of approximately 169 million barrels. This strategy is part of China's broader plan to take advantage of low oil prices while they last, positioning itself as a key player in the global oil market.

          China's Strategic Hoarding and the Broader Market Implications

          China's oil imports have been higher than its domestic refinery needs, with stockpiling rates reaching nearly 1 million barrels daily. This behavior has raised questions about China's long-term strategy, especially as global oil supply is expected to increase further, and prices are predicted to remain low. The uncertainty of future oil production trends, including slowing U.S. shale production and diminishing spare capacity from OPEC+, likely influences China’s decision to continue its aggressive stockpiling.
          This move by China could also signal a cautious outlook on the future stability of the oil market. While U.S. shale production remains a key factor in keeping oil prices low, its growth slows as prices drop. Moreover, OPEC+ has struggled to meet its production targets, depleting its spare capacity and leaving the global market more vulnerable to fluctuations in demand. If a demand surge occurs, OPEC+ may not be able to respond as robustly as it once could.

          A Complex Oil Market: Tensions Between Supply and Demand

          Despite the substantial glut in the oil market, there remains significant market sensitivity surrounding supply disruptions. Any mention of new sanctions against Russia, for example, pushes oil prices higher, illustrating that concerns over supply security still influence traders' decisions. This dynamic reflects a market that is not entirely certain of a stable oversupply, despite the apparent glut.
          In conclusion, while the oil market seems oversupplied at the moment, the dynamics of supply and demand remain complex. China’s oil hoarding strategy, alongside the challenges facing U.S. shale and OPEC+, suggest that the oil market is not as stable as it might seem. The tension between oversupply and market sensitivity to potential disruptions in supply will continue to shape the global oil landscape for the foreseeable future.
          The current global oil glut, with 1.2 billion barrels of oil in transit, indicates an oversupply, with demand failing to keep pace. However, China is absorbing much of this surplus through aggressive stockpiling, raising questions about its long-term strategy. Despite the glut, oil prices remain sensitive to geopolitical tensions, particularly sanctions against Russia, suggesting that the oil market remains unpredictable.

          Source: OilPrice

          To stay updated on all economic events of today, please check out our Economic calendar
          Risk Warnings and Disclaimers
          You understand and acknowledge that there is a high degree of risk involved in trading. Following any strategies or investment methods may lead to potential losses. The content on the site is provided by our contributors and analysts for information purposes only. You are solely responsible for determining whether any trading assets, securities, strategy, or any other product is suitable for investing based on your own investment objectives and financial situation.
          Add to Favorites
          Share

          Gold Retreats from Record High as Profit-Taking Follows Rally

          Gerik

          Economic

          Commodity

          Gold Retreats from Record High as Profit-Taking Follows a Torrid Rally

          Gold prices pulled back from their record high above $4,000 an ounce reached on Wednesday, as profit-taking followed a torrid rally that had sent the precious metal soaring. On Thursday, gold dropped by as much as 1%, after having closed 1.4% higher in the previous session. This decline comes after a period where gold had been in overbought territory, with technical indicators suggesting that the rally had become unsustainable and leading investors to lock in gains.
          Despite the pullback, gold remains up more than 50% this year, continuing to be buoyed by a combination of global economic uncertainties and geopolitical tensions. The sharp rally has been fueled by various factors, including concerns about the U.S. Federal Reserve’s independence, U.S. fiscal stability, and the growing unease surrounding global trade. Additionally, central banks worldwide have remained active buyers of gold, further contributing to its upward trajectory.

          Geopolitical Developments and U.S. Optimism

          However, some of gold’s haven appeal weakened after U.S. President Donald Trump indicated that a peace deal in the Middle East could be "very close." His remarks followed cautious optimism from Israeli and Hamas officials about the prospects of peace talks underway in Egypt, which could lead to an end to the two-year-long war in Gaza. As discussions surrounding a potential resolution gained traction, it somewhat dampened the demand for gold as a safe-haven asset, which had been rising amid the ongoing geopolitical instability.
          While gold’s price has seen a retreat, it is still up significantly from the start of the year, highlighting its role as a preferred store of value amid uncertainty. This year’s price increase has been a result of several factors, including the continuing instability in global markets and escalating geopolitical tensions. The flight to gold has been especially pronounced as investors have sought a refuge from economic and fiscal concerns, particularly in the U.S.

          Gold Price Movement and Market Trends

          As of 9:48 a.m. in Singapore on Thursday, spot gold had dipped 0.3% to $4,031.21 an ounce, following the record high of $4,059.31 reached on Wednesday. The Bloomberg Dollar Spot Index also dipped 0.1%, reflecting some weakness in the greenback. Despite this retreat, gold remains firmly elevated, having gained more than 50% this year, largely due to persistent global risks and central bank activity in the gold market.
          In addition to gold, other precious metals also saw some movement. Platinum edged lower after strong gains in previous sessions, while palladium held steady. The metals have continued to benefit from market tightness and significant inflows into exchange-traded funds (ETFs) that are backed by the metals, helping to support prices even as gold took a breather.
          Silver, although slightly down on Thursday, remained close to its record high levels according to Bloomberg’s intraday data, which dates back to 1993. The continued interest in precious metals, particularly as an alternative to traditional financial assets, has been a defining feature of the market this year, with silver benefiting from a broader shift towards commodities seen as a hedge against inflation and instability.
          In summary, while gold’s price correction might have dampened the euphoria around the record-breaking rally, its long-term upward trend is still supported by the same factors that have propelled it to its high levels, including ongoing global uncertainty and central bank demand. The coming weeks will likely provide further insight into how markets react to both economic developments and geopolitical resolutions.

          Source: Bloomberg

          To stay updated on all economic events of today, please check out our Economic calendar
          Risk Warnings and Disclaimers
          You understand and acknowledge that there is a high degree of risk involved in trading. Following any strategies or investment methods may lead to potential losses. The content on the site is provided by our contributors and analysts for information purposes only. You are solely responsible for determining whether any trading assets, securities, strategy, or any other product is suitable for investing based on your own investment objectives and financial situation.
          Add to Favorites
          Share
          FastBull
          Copyright © 2025 FastBull Ltd

          728 RM B 7/F GEE LOK IND BLDG NO 34 HUNG TO RD KWUN TONG KLN HONG KONG

          TelegramInstagramTwitterfacebooklinkedin
          App Store Google Play Google Play
          Products
          Charts

          Chats

          Q&A with Experts
          Screeners
          Economic Calendar
          Data
          Tools
          Membership
          Features
          Function
          Markets
          Copy Trading
          Latest Signals
          Contests
          News
          Analysis
          24/7
          Columns
          Education
          Company
          Careers
          About Us
          Contact Us
          Advertising
          Help Center
          Feedback
          User Agreement
          Privacy Policy
          Business

          White Label

          Data API

          Web Plug-ins

          Poster Maker

          Affiliate Program

          Risk Disclosure

          The risk of loss in trading financial instruments such as stocks, FX, commodities, futures, bonds, ETFs and crypto can be substantial. You may sustain a total loss of the funds that you deposit with your broker. Therefore, you should carefully consider whether such trading is suitable for you in light of your circumstances and financial resources.

          No decision to invest should be made without thoroughly conducting due diligence by yourself or consulting with your financial advisors. Our web content might not suit you since we don't know your financial conditions and investment needs. Our financial information might have latency or contain inaccuracy, so you should be fully responsible for any of your trading and investment decisions. The company will not be responsible for your capital loss.

          Without getting permission from the website, you are not allowed to copy the website's graphics, texts, or trademarks. Intellectual property rights in the content or data incorporated into this website belong to its providers and exchange merchants.

          Not Logged In

          Log in to access more features

          FastBull Membership

          Not yet

          Purchase

          Become a signal provider
          Help Center
          Customer Service
          Dark Mode
          Price Up/Down Colors

          Log In

          Sign Up

          Position
          Layout
          Fullscreen
          Default to Chart
          The chart page opens by default when you visit fastbull.com