Markets
News
Analysis
User
24/7
Economic Calendar
Education
Data
- Names
- Latest
- Prev


Ever since OPEC+ started ramping up supplies in April, the group has drawn reassurance from one key oil indicator: the price curve. As it prepares to meet this weekend, that gauge is faltering.
Ever since OPEC+ started ramping up supplies in April, the group has drawn reassurance from one key oil indicator: the price curve. As it prepares to meet this weekend, that gauge is faltering.
OPEC officials pay close attention to the premium that Brent crude futures for more immediate supply command over later contracts. The positive spread — known as backwardation — has held up for months, even as Saudi Arabia and its allies fast-tracked the return of 2.2 million barrels a day. It means traders saw the oil market as tight.
But as the Organization of the Petroleum Exporting Countries and its partners ponder their next steps, the metric is deteriorating. The difference between the second and third months shrank to the weakest level since November on Thursday, at 18 cents a barrel. Similar gauges for the Middle Eastern market, representing barrels key OPEC producers pump, have also come under pressure.
Inventories remain tight in the US, but oil supplies are starting to accumulate at sea, including a flotilla of unsold cargoes from the Middle East. Morgan Stanley expects the forward curve will flip into the reverse structure where prompt barrels trade at a discount — known as contango — as stockpiles eventually pile up in the West. That’s normally a bearish signal.
“We are all waiting for these ballooning global stocks to finally show up in Atlantic Basin crude,” said Martijn Rats, the bank’s global oil strategist said at the Argus Global Markets conference this week. “At some point they’re going to build and then we’re going to go to contango.”
The group is still striving for consensus on what to do next. The options under preliminary discussion include another marginal increase of 137,000 barrels a day like this month’s, or multiples of that, according to delegates.
Earlier this week, one delegate said the group would discuss whether to fast-track its latest round of supply hikes in three monthly instalments of about 500,000 barrels a day. OPEC said it didn’t have plans in place to increase output by that amount.
The decline of oil’s forward curve suggests they have good reason to be cautious.
728 RM B 7/F GEE LOK IND BLDG NO 34 HUNG TO RD KWUN TONG KLN HONG KONG


The risk of loss in trading financial instruments such as stocks, FX, commodities, futures, bonds, ETFs and crypto can be substantial. You may sustain a total loss of the funds that you deposit with your broker. Therefore, you should carefully consider whether such trading is suitable for you in light of your circumstances and financial resources.
No decision to invest should be made without thoroughly conducting due diligence by yourself or consulting with your financial advisors. Our web content might not suit you since we don't know your financial conditions and investment needs. Our financial information might have latency or contain inaccuracy, so you should be fully responsible for any of your trading and investment decisions. The company will not be responsible for your capital loss.
Without getting permission from the website, you are not allowed to copy the website's graphics, texts, or trademarks. Intellectual property rights in the content or data incorporated into this website belong to its providers and exchange merchants.
Not Logged In
Log in to access more features

FastBull Membership
Not yet
Purchase


Log In
Sign Up


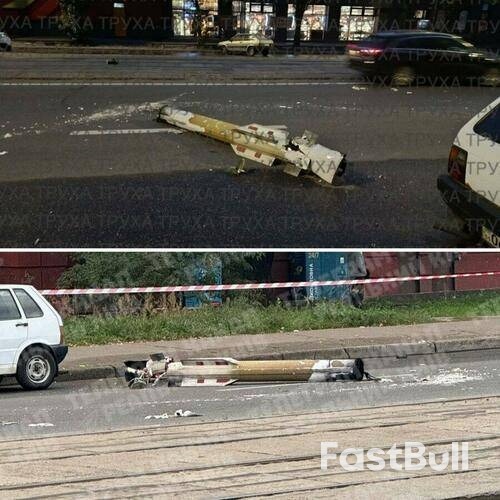
 Russian MoD/TASS