• Trade
  • Markets
  • Copy
  • Contests
  • News
  • 24/7
  • Calendar
  • Q&A
  • Chats
Trending
Screeners
SYMBOL
LAST
BID
ASK
HIGH
LOW
NET CHG.
%CHG.
SPREAD
SPX
S&P 500 Index
6827.42
6827.42
6827.42
6899.86
6801.80
-73.58
-1.07%
--
DJI
Dow Jones Industrial Average
48458.04
48458.04
48458.04
48886.86
48334.10
-245.98
-0.51%
--
IXIC
NASDAQ Composite Index
23195.16
23195.16
23195.16
23554.89
23094.51
-398.69
-1.69%
--
USDX
US Dollar Index
97.950
98.030
97.950
98.500
97.950
-0.370
-0.38%
--
EURUSD
Euro / US Dollar
1.17394
1.17409
1.17394
1.17496
1.17192
+0.00011
+ 0.01%
--
GBPUSD
Pound Sterling / US Dollar
1.33707
1.33732
1.33707
1.33997
1.33419
-0.00148
-0.11%
--
XAUUSD
Gold / US Dollar
4299.39
4299.39
4299.39
4353.41
4257.10
+20.10
+ 0.47%
--
WTI
Light Sweet Crude Oil
57.233
57.485
57.233
58.011
56.969
-0.408
-0.71%
--

Community Accounts

Signal Accounts
--
Profit Accounts
--
Loss Accounts
--
View More

Become a signal provider

Sell trading signals to earn additional income

View More

Guide to Copy Trading

Get started with ease and confidence

View More

Signal Accounts for Members

All Signal Accounts

Best Return
  • Best Return
  • Best P/L
  • Best MDD
Past 1W
  • Past 1W
  • Past 1M
  • Past 1Y

All Contests

  • All
  • Trump Updates
  • Recommend
  • Stocks
  • Cryptocurrencies
  • Central Banks
  • Featured News
Top News Only
Share

USA Embassy In Lithuania: Maria Kalesnikava Is Not Going To Vilnius

Share

USA Embassy In Lithuania: Other Prisoners Are Being Sent From Belarus To Ukraine

Share

Ukraine President Zelenskiy: Five Ukrainians Released By Belarus In US-Brokered Deal

Share

USA Vilnius Embassy: USA Stands Ready For "Additional Engagement With Belarus That Advances USA Interests"

Share

USA Vilnius Embassy: Belarus, USA, Other Citizens Among The Prisoners Released Into Lithuania

Share

USA Vilnius Embassy: USA Will Continue Diplomatic Efforts To Free The Remaining Political Prisoners In Belarus

Share

USA Vilnius Embassy: Belarus Releases 123 Prisoners Following Meeting Of President Trump's Envoy Coale And Belarus President Lukashenko

Share

USA Vilnius Embassy: Masatoshi Nakanishi, Aliaksandr Syrytsa Are Among The Prisoners Released By Belarus

Share

USA Vilnius Embassy: Maria Kalesnikava And Viktor Babaryka Are Among The Prisoners Released By Belarus

Share

USA Vilnius Embassy: Nobel Peace Prize Laureate Ales Bialiatski Is Among The Prisoners Released By Belarus

Share

Belarusian Presidential Administration Telegram Channel: Lukashenko Has Pardoned 123 Prisoners As Part Of Deal With US

Share

Two Local Syrian Officials: Joint US-Syrian Military Patrol In Central Syria Came Under Fire From Unknown Assailants

Share

Israeli Military Says It Targeted 'Key Hamas Terrorist' In Gaza City

Share

Rwanda's Actions In Eastern Drc Are A Clear Violation Of Washington Accords Signed By President Trump - Secretary Of State Rubio

Share

Israeli Military Issues Evacuation Warning In Southern Lebanon Village Ahead Of Strike - Spokesperson On X

Share

Belarusian State Media Cites US Envoy Coale As Saying He Discussed Ukraine And Venezuela With Lukashenko

Share

Belarusian State Media Cites US Envoy Coale As Saying That US Removes Sanctions On Belarusian Potassium

Share

Thai Prime Minister: No Ceasefire Agreement With Cambodia

Share

US, Ukraine To Discuss Ceasefire In Berlin Ahead Of European Summit

Share

Incoming Czech Prime Minister Babis: Czech Republic Will Not Take On Guarantees For Ukraine Financing, European Commission Must Find Alternatives

TIME
ACT
FCST
PREV
U.K. Trade Balance Non-EU (SA) (Oct)

A:--

F: --

P: --

U.K. Trade Balance (Oct)

A:--

F: --

P: --

U.K. Services Index MoM

A:--

F: --

P: --

U.K. Construction Output MoM (SA) (Oct)

A:--

F: --

P: --

U.K. Industrial Output YoY (Oct)

A:--

F: --

P: --

U.K. Trade Balance (SA) (Oct)

A:--

F: --

P: --

U.K. Trade Balance EU (SA) (Oct)

A:--

F: --

P: --

U.K. Manufacturing Output YoY (Oct)

A:--

F: --

P: --

U.K. GDP MoM (Oct)

A:--

F: --

P: --

U.K. GDP YoY (SA) (Oct)

A:--

F: --

P: --

U.K. Industrial Output MoM (Oct)

A:--

F: --

P: --

U.K. Construction Output YoY (Oct)

A:--

F: --

P: --

France HICP Final MoM (Nov)

A:--

F: --

P: --

China, Mainland Outstanding Loans Growth YoY (Nov)

A:--

F: --

P: --

China, Mainland M2 Money Supply YoY (Nov)

A:--

F: --

P: --

China, Mainland M0 Money Supply YoY (Nov)

A:--

F: --

P: --

China, Mainland M1 Money Supply YoY (Nov)

A:--

F: --

P: --

India CPI YoY (Nov)

A:--

F: --

P: --

India Deposit Gowth YoY

A:--

F: --

P: --

Brazil Services Growth YoY (Oct)

A:--

F: --

P: --

Mexico Industrial Output YoY (Oct)

A:--

F: --

P: --

Russia Trade Balance (Oct)

A:--

F: --

P: --

Philadelphia Fed President Henry Paulson delivers a speech
Canada Building Permits MoM (SA) (Oct)

A:--

F: --

P: --

Canada Wholesale Sales YoY (Oct)

A:--

F: --

P: --

Canada Wholesale Inventory MoM (Oct)

A:--

F: --

P: --

Canada Wholesale Inventory YoY (Oct)

A:--

F: --

P: --

Canada Wholesale Sales MoM (SA) (Oct)

A:--

F: --

P: --

Germany Current Account (Not SA) (Oct)

A:--

F: --

P: --

U.S. Weekly Total Rig Count

A:--

F: --

P: --

U.S. Weekly Total Oil Rig Count

A:--

F: --

P: --

Japan Tankan Large Non-Manufacturing Diffusion Index (Q4)

--

F: --

P: --

Japan Tankan Small Manufacturing Outlook Index (Q4)

--

F: --

P: --

Japan Tankan Large Non-Manufacturing Outlook Index (Q4)

--

F: --

P: --

Japan Tankan Large Manufacturing Outlook Index (Q4)

--

F: --

P: --

Japan Tankan Small Manufacturing Diffusion Index (Q4)

--

F: --

P: --

Japan Tankan Large Manufacturing Diffusion Index (Q4)

--

F: --

P: --

Japan Tankan Large-Enterprise Capital Expenditure YoY (Q4)

--

F: --

P: --

U.K. Rightmove House Price Index YoY (Dec)

--

F: --

P: --

China, Mainland Industrial Output YoY (YTD) (Nov)

--

F: --

P: --

China, Mainland Urban Area Unemployment Rate (Nov)

--

F: --

P: --

Saudi Arabia CPI YoY (Nov)

--

F: --

P: --

Euro Zone Industrial Output YoY (Oct)

--

F: --

P: --

Euro Zone Industrial Output MoM (Oct)

--

F: --

P: --

Canada Existing Home Sales MoM (Nov)

--

F: --

P: --

Euro Zone Total Reserve Assets (Nov)

--

F: --

P: --

U.K. Inflation Rate Expectations

--

F: --

P: --

Canada National Economic Confidence Index

--

F: --

P: --

Canada New Housing Starts (Nov)

--

F: --

P: --

U.S. NY Fed Manufacturing Employment Index (Dec)

--

F: --

P: --

U.S. NY Fed Manufacturing Index (Dec)

--

F: --

P: --

Canada Core CPI YoY (Nov)

--

F: --

P: --

Canada Manufacturing Unfilled Orders MoM (Oct)

--

F: --

P: --

Canada Manufacturing New Orders MoM (Oct)

--

F: --

P: --

Canada Core CPI MoM (Nov)

--

F: --

P: --

Canada Manufacturing Inventory MoM (Oct)

--

F: --

P: --

Canada CPI YoY (Nov)

--

F: --

P: --

Canada CPI MoM (Nov)

--

F: --

P: --

Canada CPI YoY (SA) (Nov)

--

F: --

P: --

Canada Core CPI MoM (SA) (Nov)

--

F: --

P: --

Q&A with Experts
    • All
    • Chatrooms
    • Groups
    • Friends
    Connecting
    .
    .
    .
    Type here...
    Add Symbol or Code

      No matching data

      All
      Trump Updates
      Recommend
      Stocks
      Cryptocurrencies
      Central Banks
      Featured News
      • All
      • Russia-Ukraine Conflict
      • Middle East Flashpoint
      • All
      • Russia-Ukraine Conflict
      • Middle East Flashpoint
      Search
      Products

      Charts Free Forever

      Chats Q&A with Experts
      Screeners Economic Calendar Data Tools
      Membership Features
      Data Warehouse Market Trends Institutional Data Policy Rates Macro

      Market Trends

      Market Sentiment Order Book Forex Correlations

      Top Indicators

      Charts Free Forever
      Markets

      News

      News Analysis 24/7 Columns Education
      From Institutions From Analysts
      Topics Columnists

      Latest Views

      Latest Views

      Trending Topics

      Top Columnists

      Latest Update

      Signals

      Copy Rankings Latest Signals Become a signal provider AI Rating
      Contests
      Brokers

      Overview Brokers Assessment Rankings Regulators News Claims
      Broker listing Forex Brokers Comparison Tool Live Spread Comparison Scam
      Q&A Complaint Scam Alert Videos Tips to Detect Scam
      More

      Business
      Events
      Careers About Us Advertising Help Center

      White Label

      Data API

      Web Plug-ins

      Affiliate Program

      Awards Institution Evaluation IB Seminar Salon Event Exhibition
      Vietnam Thailand Singapore Dubai
      Fans Party Investment Sharing Session
      FastBull Summit BrokersView Expo
      Recent Searches
        Top Searches
          Markets
          News
          Analysis
          User
          24/7
          Economic Calendar
          Education
          Data
          • Names
          • Latest
          • Prev

          View All

          No data

          Scan to Download

          Faster Charts, Chat Faster!

          Download App
          English
          • English
          • Español
          • العربية
          • Bahasa Indonesia
          • Bahasa Melayu
          • Tiếng Việt
          • ภาษาไทย
          • Français
          • Italiano
          • Türkçe
          • Русский язык
          • 简中
          • 繁中
          Open Account
          Search
          Products
          Charts Free Forever
          Markets
          News
          Signals

          Copy Rankings Latest Signals Become a signal provider AI Rating
          Contests
          Brokers

          Overview Brokers Assessment Rankings Regulators News Claims
          Broker listing Forex Brokers Comparison Tool Live Spread Comparison Scam
          Q&A Complaint Scam Alert Videos Tips to Detect Scam
          More

          Business
          Events
          Careers About Us Advertising Help Center

          White Label

          Data API

          Web Plug-ins

          Affiliate Program

          Awards Institution Evaluation IB Seminar Salon Event Exhibition
          Vietnam Thailand Singapore Dubai
          Fans Party Investment Sharing Session
          FastBull Summit BrokersView Expo

          Natural Gas Outlook – Natural Gas Continues to See $4 as Barrier

          Adam

          Commodity

          Summary:

          Natural gas spiked briefly after U.S. strikes on Iran but quickly retreated, with $4 remaining strong resistance. Weak demand and easing weather pressures suggest continued downside toward $3.50 if support breaks.

          The natural gas market initially gapped higher on Monday, in reaction to the Americans bombing the Iranian nuclear sites. However, the market fell almost immediately, as we are still looking at the $4 level as a ceiling.

          Natural Gas Technical Analysis

          The natural gas market gapped higher to kick off the trading session, which makes a certain amount of sense considering that the Americans bombed three nuclear sites in Iran over the weekend. And of course, people, the first instinct with them is going to be to start buying oil and gas. That being said, the market didn’t even bother going higher. It just fell from there and this to me signifies that the area right around the $4 level will be a massive barrier still.
          If that’s the case, you pay attention to the massive shooting star on Friday, this tells me that we are now looking at this $3.85 region to see whether or not we can break below it. If we do, then the 50 day EMA is followed by the $3.50 level. Underneath there, then you have the 200 day EMA. Ultimately though, we could bounce on some type of negative headline as far as risk is concerned, whatever, but I still think that a lack of demand is going to be an issue sooner or later.
          We’re in the midst of a heat wave here in the eastern part of the United States. And that of course has a certain amount of demand being shown in the market, but we’ve already seen that play out a bit. In fact, by the beginning of next week, temperatures should be closer to the norm. So, I still think the market is trying to get ahead of the next plunge and start selling.

          Source:fxempire

          Risk Warnings and Disclaimers
          You understand and acknowledge that there is a high degree of risk involved in trading. Following any strategies or investment methods may lead to potential losses. The content on the site is provided by our contributors and analysts for information purposes only. You are solely responsible for determining whether any trading assets, securities, strategy, or any other product is suitable for investing based on your own investment objectives and financial situation.
          Add to Favorites
          Share

          JUST IN: Iran Allegedly Attacks US Bases In Qatar – Bitcoin Falls Below $100,000 Again, Experiencing A Sudden Drop

          Devin

          Political

          Iran fired six missiles at US military bases in Qatar, an Israeli official told Axios. The same source previously told Axios that Iran was preparing for the attack.

          A succession of explosions were heard over Doha, according to Reuters reporters on the ground.

          Qatar is home to Al Udeid Air Base, the largest U.S. base in the Middle East. The base, which houses about 10,000 American troops, serves as the forward headquarters of U.S. Central Command (CENTCOM). The base directs U.S. military operations in a vast area stretching from Egypt to Kazakhstan.

          Last week, Reuters reported that the US Department of Defense had withdrawn some of its aircraft from the base due to the risk of a possible attack from Iran.

          Following the developments, Bitcoin experienced a sudden drop in price and was briefly seen below $100,000.

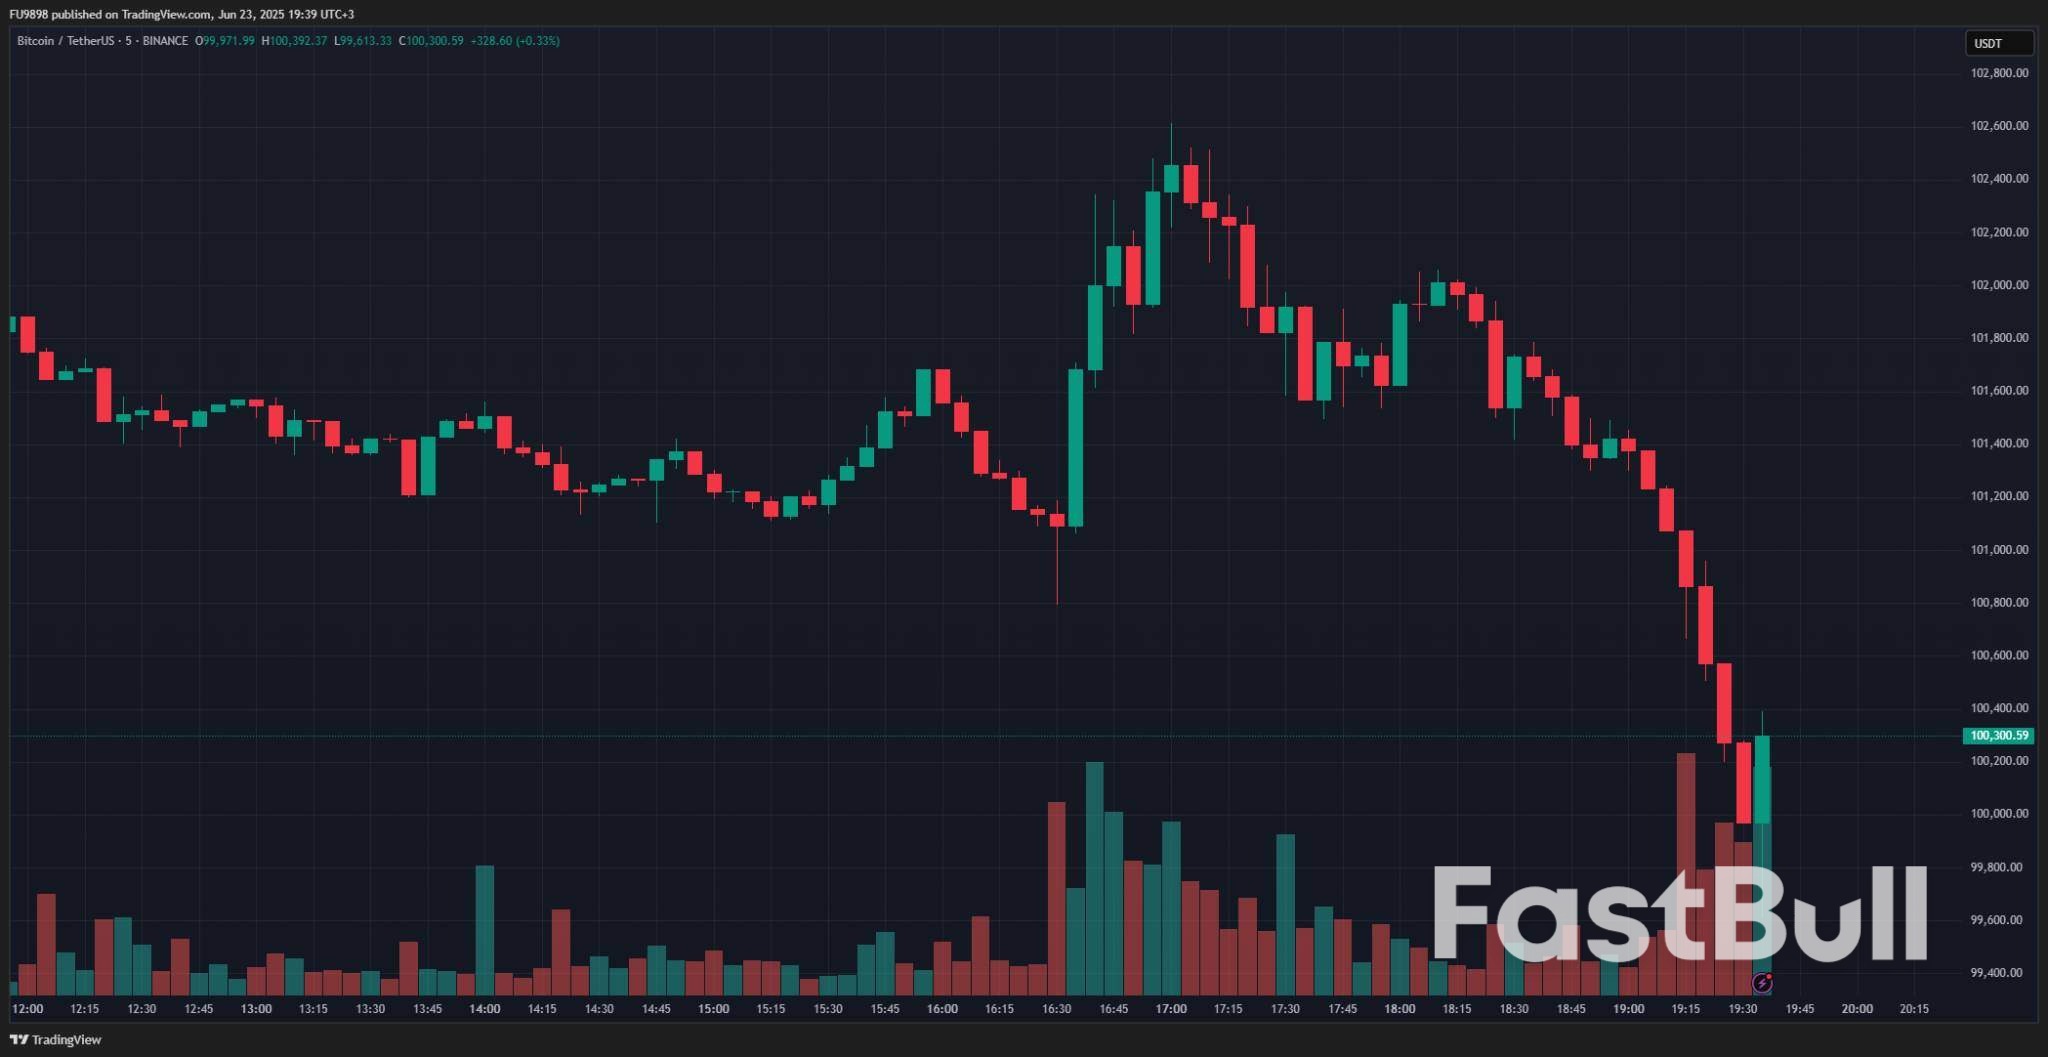
          Chart showing the decline in BTC price.

          Source: CryptoSlate

          Risk Warnings and Disclaimers
          You understand and acknowledge that there is a high degree of risk involved in trading. Following any strategies or investment methods may lead to potential losses. The content on the site is provided by our contributors and analysts for information purposes only. You are solely responsible for determining whether any trading assets, securities, strategy, or any other product is suitable for investing based on your own investment objectives and financial situation.
          Add to Favorites
          Share

          China’s support for Tehran grows more restrained as U.S. enters war between Israel and Iran

          Adam

          Economic

          Middle East Situation


          As the U.S. rained bombs and missiles on Iran’s nuclear sites on Saturday — entering the war between Israel and Iran — Beijing appears to be standing firm in its support of its long-standing ally in Tehran.
          However, its support will likely be tempered by its limited heft as a peace broker in the region, and the perceived upside if oil chokepoints squeeze the U.S. more than it hurts Beijing, experts said.
          Beijing has drawn closer to Iran in recent years, with the two countries cooperating regularly on military exercises and signing a 25-year strategic partnership in economic, military and security cooperation in 2021.
          Iran’s population of nearly 91 million, far more than Israel’s 9.8 million people, coupled with its abundant crude oil reserves, made it a natural partner in China’s Belt and Road initiative, which the Global Times, a Beijing government mouthpiece, described as a way to “counter U.S. hegemony.”
          China’s primary economic interest, however, lies in its access to Iranian oil and the Strait of Hormuz, one of the most pivotal routes for global crude oil flows.
          Some 20 million barrels per day of crude oil, or a fifth of global consumption, flowed through the strait in 2024, according to the U.S. Energy Information Administration. About half of Beijing’s oil imports moved through the key route — using a system of workarounds to bypass Western banks, shipping services and yuan-denominated transactions to avoid triggering sanctions.
          That said, China will likely keep its “hands off Iran in any case,” said Neo Wang, lead China economist and strategist at Evercore ISI, due to its limited influence over Israel and its strategic calculus on Washington’s involvement in the conflict.
          Beijing, embroiled in a trade war with the U.S., may find value in any chaos in the Middle East, as they would pose “a bigger distraction to Washington,” Wang added.
          China had pledged to support Iran shortly after Israel’s attack on June 12, which Beijing condemned as a “violation of Iran’s sovereignty, security and territorial integrity.”
          But despite that initial show of support for Iran, Beijing’s rhetoric has shifted to become more measured, short of denouncing Israel’s military actions but focused on brokering dialogue and a ceasefire.
          Chinese foreign minister Wang Yi told his Israeli counterpart in a phone call that Israel’s strikes were “unacceptable,” but refrained from remarks of “condemning” them in the call.
          Beijing has largely avoided “direct condemnation of Israel while remaining diplomatically aligned with Iran,” analysts at political risk consultancy firm Eurasia Group said, as it seeks to “contain the tensions and prevent spillover of the conflict to the wider region — which could affect its economic and strategic interests.”
          The U.S. strikes on Iran “handed China an important talking point: It’s America, not China, that threatens the global order and peace,” said Shehzad Qazi, managing director of China Beige Book.
          A battle of endurance?
          U.S. Secretary of State Marco Rubio on Sunday called for China to dissuade Iran from closing the Strait of Hormuz.
          While many expect Beijing to do just that, some suggested a blockade of the chokepoint could be favorable for China, as it stands better prepared to absorb the blow than the U.S. and European Union, and that China could easily turn to other alternative oil sources.
          According to the Energy Information Administration, China’s primary oil sources are Russia, Saudi Arabia, Malaysia, Iraq and Oman, although a sizable portion of Malaysia’s exports are actually relabeled or transferred from Iran.
          Robin Brooks, senior fellow at the Brookings Institution, said “China will be happy to see a big spike in oil prices if that destabilizes the U.S. and Europe.”
          Echoing that view, Andrew Bishop, global head of policy research at Signum Global Advisors, said: “China may not be that irate at paying more for oil from other sources, if it means the U.S. suffers even more.”
          Answering a question on Iran’s potential closure of the strait, a Chinese Foreign Ministry spokesperson told reporters at a regular briefing Monday that it is in the international community’s shared interest to maintain stability in the Persian Gulf and surrounding waterways.
          Iran’s parliament Sunday backed the decision to close the strait, pending the final approval by its national security council.
          Opportunity in crisis
          China may have hopes of acting as a peacemaker, building on its mediation of a peace deal between Iran and Saudi Arabia in 2023. But Israel will likely be skeptical of China’s neutrality as a mediator, analysts said, citing Beijing’s close ties with Iran and concerns about of provoking the Trump administration.
          China’s U.N. Ambassador Cong Fu took aim at the U.S. at a U.N. Security Council meeting on Sunday, saying that the country “strongly condemns” the U.S. attacks on Iran and the bombing of nuclear facilities.
          Fu also singled out Israel and called for efforts to bring an end to the hostilities. “The parties to the conflict, Israel in particular, should reach an immediate ceasefire to prevent a spiraling escalation,” Fu said, according to the readout.
          Andy Rothman, founder of advisory firm Sinology LLC, said he doubted that Beijing would attempt to broker a peace deal between the U.S. and Iran, but it may still be “discouraging Iran from retaliating militarily against the U.S.”
          “Because that would destabilize the region and weaken the global economy, neither of which are in China’s interest,” he added.
          Source: cnbc
          To stay updated on all economic events of today, please check out our Economic calendar
          Risk Warnings and Disclaimers
          You understand and acknowledge that there is a high degree of risk involved in trading. Following any strategies or investment methods may lead to potential losses. The content on the site is provided by our contributors and analysts for information purposes only. You are solely responsible for determining whether any trading assets, securities, strategy, or any other product is suitable for investing based on your own investment objectives and financial situation.
          Add to Favorites
          Share

          Strait of Hormuz saber-rattling ramps up following US attack. Whether the key waterway will close is less clear.

          Adam

          Economic

          Middle East Situation

          Iran's parliament has pushed the nation to close the Strait of Hormuz, according to state media, but left the final decision to choke off the key waterway to Iran’s Supreme National Security Council.
          Vice President JD Vance shot back Sunday that such an action "would be suicidal" for Iran as "their entire economy runs through the Strait of Hormuz."
          Yet the Islamic Republic appears to be a step closer to the unprecedented action that could spike prices around the world, with about 20% of global oil and gas flowing through the narrow passageway connecting the Persian Gulf to the rest of the globe.
          It was just one front — but perhaps one with the greatest economic consequences — after President Trump ordered an attack on three of Iran's nuclear sites and drew the US into the ongoing war.
          Some experts are skeptical Iran will ever follow through, as the country has threatened the strait multiple times over the years but has historically opted for less disruptive measures.
          Trump described the move as a means to bring Iran to the negotiating table in comments Saturday night. But it immediately set off fears of additional violence and retaliation in the days ahead, with Trump's hint at the possibility of "regime change" a further spur.
          For their part, Iranian leaders say any talks are on hold but haven't outlined exactly how they are going to respond.
          "The US is not diplomatic and only understands the language of force and threats," said Iranian Foreign Minister Abbas Araghchi, according to Mehr News, the country's semi-official news agency.
          Araghchi also reportedly avoided directly commenting on the strait, saying "a variety of options are available to Iran."
          The action also comes after Iranian General Mohsen Rezaei, an Iranian leader who has a seat on the decision-making Supreme National Security Council, reportedly said on state television hours before the attack that the country would move to close the strait if Trump entered the war.
          Watching for a ‘worst-case scenario’
          Economists will be closely watching the strait because of global economic repercussions that would almost surely follow any disruptions there.
          Analysts at JPMorgan Chase (JPM) have called a blockage there a "worst-case scenario" and suggested the result could be global oil prices reaching $120 a barrel and pushing inflation in the US to 5%.
          But as Bloomberg energy columnist Javier Blas reemphasized over the weekend, it benefits Iran to "use low-ranking officials to talk about closing Hormuz" because it sows instability. But it would actually damage Iran to follow through.
          Indeed, closing the strait would be felt in Iran's own oil sector and cut off a key revenue source for the country's leaders.
          Iran uses the waterway for its own energy exports, which totaled over 1.3 million barrels of oil a day in 2023, according to CEIC.
          As Noam Raydan, who studies energy and maritime risks at the Washington Institute for Near East Policy, told Yahoo Finance last week before the attacks: "If its oil production and terminals are badly damaged, we can then seriously consider the possibility of Tehran shutting the strait."
          So far, that doesn't appear to be the case, with Israel striking one oil refinery in Tehran but so far apparently leaving the country's oil infrastructure largely in place.
          Most Iranian oil flows to China, but closing the Strait of Hormuz would jeopardize a wider array of oil and natural gas sources, with Saudi Arabia, Kuwait, Iraq, and others using that waterway.
          That said, the tensions could prompt oil tankers to decide not to transit Hormuz themselves without direct intervention from Iran. But there were signs of a cautious willingness to enter the waterway on Monday, as two supertankers that had U-turned resumed their crossing.
          The overall landscape has led Trump administration to express tempered confidence that the Strait of Hormuz option is one that won't be taken.
          "That would be suicidal," Vance said on Sunday on NBC of Iran taking that step.
          "If they want to destroy their own economy and cause disruptions in the world, I think that would be their decision," he acknowledged, "but why would they do that? I don't think it makes any sense."
          Secretary of State Marco Rubio added on Fox News that Iran closing the strait would be "another terrible mistake, ... and we retain options to deal with that."

          Source: finance.yahoo

          To stay updated on all economic events of today, please check out our Economic calendar
          Risk Warnings and Disclaimers
          You understand and acknowledge that there is a high degree of risk involved in trading. Following any strategies or investment methods may lead to potential losses. The content on the site is provided by our contributors and analysts for information purposes only. You are solely responsible for determining whether any trading assets, securities, strategy, or any other product is suitable for investing based on your own investment objectives and financial situation.
          Add to Favorites
          Share

          Tesla stock pops 10% as Musk touts ‘successful’ robotaxi Austin launch

          Adam

          Stocks

          Economic

          Tesla’s driverless robotaxi finally hit the road this weekend, sending shares of the electric vehicle maker up 10% on Monday.
          The EV giant debuted autonomous rides in Austin, Texas, on Sunday, opening the service to a limited number of riders by invitation only. CEO Elon Musk said in a post on social media platform X that customers were charged a flat fee of $4.20.
          “Super congratulations to the @Tesla_AI software & chip design teams on a successful @Robotaxi launch!! Culmination of a decade of hard work. Both the AI chip and software teams were built from scratch within Tesla,” he said in a post.
          One tester wrote on X that they did 11 with the service with “zero issues.” Musk reposted numerous firsthand encounters with the services.
          Musk has long promised a driverless Tesla robotaxi fleet to investors, amping up the pressure to deliver.
          The launch puts Tesla head-to-head with Alphabet’s Waymo, which is already operating a fleet of robotaxis in several cities across the U.S. and reached 10 million trips last month.
          Musk told CNBC’s David Faber last month that Tesla aims to have “Hundreds of thousands, if not over a million” self-driving cars in the U.S. by the end of next year. In May, Musk first announced plans to launch the service in Austin, with later debuts set for Los Angeles and San Francisco.
          Heading into the launch, Tesla faced pushback from a group of Democratic lawmakers in Texas and public safety activists urged the company to delay the debut.
          Tesla’s full-self driving capabilities, which feature a standard FSD or FSD supervised, include automatic steering and parking, but have been linked to accidents and fatalities, according to data tracked by the National Highway Traffic Safety Administration.

          Source: cnbc

          To stay updated on all economic events of today, please check out our Economic calendar
          Risk Warnings and Disclaimers
          You understand and acknowledge that there is a high degree of risk involved in trading. Following any strategies or investment methods may lead to potential losses. The content on the site is provided by our contributors and analysts for information purposes only. You are solely responsible for determining whether any trading assets, securities, strategy, or any other product is suitable for investing based on your own investment objectives and financial situation.
          Add to Favorites
          Share

          Missiles Fly, Yet Bitcoin Holds, Revealing BTC’s Strength in Global Chaos

          Warren Takunda

          Cryptocurrency

          Middle East Situation

          On Saturday, June 21, 2025, the US hit Iranian nuclear facilities, causing a short-lived dip in the price action of Bitcoin. Bitcoin rebounded before its Sunday close to just under 1.27% of its price before the US military effort.
          For 10 days in June, missiles flew and markets wobbled, but Bitcoin held its ground — not immune to war, but more stable than fear would suggest.
          It is within human nature to want to find patterns, but correlation does not necessarily mean causation. Looking at the headlines, it is easy to assume that things are moving because of one news story or the next. Israel hits Iran. Iran strikes back. The United States drops 30,000-pound bunker busters. Bitcoin drifts lower to $98,286, and the headlines scream correlation.
          Looking closer, however, the drawdown was orderly. No panic. No wipeout. And by the time the dust settled, Bitcoin had closed the week still above six figures at $100,760. The most severe military escalation in the region in years moved the asset just 1.27% in 24 hours. That is not a crisis. That is a market taking the news like it takes the weather.
          Whether someone is a trader, a hodler or someone new to the cryptoverse, deciphering the effect of global headlines on Bitcoin’s price action can help separate the signal from the noise, and clarify what moves the market in both the short and long term.Missiles Fly, Yet Bitcoin Holds, Revealing BTC’s Strength in Global Chaos_1

          Bitcoin Price Action vs Iran-Israel Conflict Headlines (June 12-22, 2025). Source: AP, and CoinMarketCap

          The conflict, the charts and the causality trap

          Sentiment is important to risk assets like Bitcoin, and BTC’s price action has been affected by the recent conflict in the Middle East. Famous gold bug and anti-Bitcoiner Peter Schiff asked on X on Sunday, “Other than [Michael Saylor], who’s buying the dip below $100K?” While BTC’s price dropped to almost $98K, there was enough market response to support going back above that psychological six-figure mark by the day’s close.
          BTC and its USD trading price constantly fluctuate, and it is in this range that we can glean the most insight. When looking at the highs and lows of BTC price action from June 12 through Sunday, we can see that Bitcoin’s price closed above the range of lows for that day, showing signs of support at that current level, even if there was a multiday downward trend.
          A downward trend makes sense when considering that the 200-day moving average for BTC is around $95,567. A 200 DMA is a key long-term trend indicator that often provides market support and resistance levels for assets if the price dips drastically in the short term.
          Bitcoin does show movement in response to news about political conflicts. Still, it often finds stability rather quickly, and in a longer time frame, other headlines may have more of an effect on BTC’s price volatility.

          Macro still holds the wheel

          Going back to the start of 2025 and looking for headlines that moved the crypto market medium-term, we can find that the macro-news headlines from the United States seem to show more of a correlation than the recent Iran-Israel conflict. One of the largest BTC price escalations was the swearing in of US President Donald Trump on Jan. 20, with the price declining in the days to follow without an official word on the crypto industry.
          On Feb. 12, the Consumer Price Index (CPI) rose to 3.0% and core CPI to 3.3%, reinforcing the Federal Reserve’s rate pause. On March 19, the Fed cut its GDP forecast to 1.7%, raised its unemployment projection to 4.4%, and raised its inflation expectations. On April 4, Federal Reserve Chair Jerome Powell warned that new tariffs could raise inflation and slow growth. On April 10, CPI fell to 2.3%, helping spark hopes of rate cuts. On May 13, CPI remained at 2.3%, but core inflation stayed sticky at 2.8%. On May 30, Personal Consumption Expenditures (PCE) dropped to 2.1%, and core PCE to 2.5%. During the Iran–Israel conflict, on June 11, CPI came in at 2.4%, and on June 12, the Producer Price Index (PPI) printed at 0.2%.
          On Tuesday and Wednesday, the Federal Open Market Committee (FOMC) held interest rates steady but lowered the GDP forecast to 1.4% and raised inflation projections to 3%. This flurry of macro data moved Bitcoin over six months more than any single missile launch.
          Even the June 16 peak at 108,915 dollars coincided with BlackRock reporting 412 million dollars in ETF inflows, which was capital rotation, not conflict premium.Missiles Fly, Yet Bitcoin Holds, Revealing BTC’s Strength in Global Chaos_2

          Bitcoin Price Action 2025 YTD Showing Highs and Low Band vs US Economic News. Source: CoinMarketCap, AP, Reuters, NYT, US FED, AP, Reuters, CNBC, Fox Business, BLS, US FED

          Bitcoin trends historically well in major geopolitical events

          Bitcoin has historically trended positively during periods of geopolitical turmoil. During major events like the US–Iran tensions in 2020, the Russian invasion of Ukraine in 2022 and now the Iran–Israel conflict of 2025, Bitcoin has shown upward movement or remarkable price stability. While it does not act like a traditional safe haven, it often behaves like an uncorrelated hedge in systemic uncertainty.
          BlackRock’s 2024 report reinforced this, showing that Bitcoin outperformed the S&P 500 and gold during several past geopolitical shocks. Their chart highlights Bitcoin’s unique behavior during crises: While equities dipped and gold oscillated, Bitcoin frequently trended upward. That pattern did not break in June 2025. It did not surge, but it also did not break the trend.
          That matters in a world desperate for assets that don’t follow the herd.Missiles Fly, Yet Bitcoin Holds, Revealing BTC’s Strength in Global Chaos_3

          S&P 500, gold and Bitcoin Through Major Geopolitical Events. Source: BlackRock Report

          Not immune to war, but not moved by it either

          When Bitcoin moved during the recent Iran-Israel conflict, it did not respond to ideology. It was reacting to liquidation and flow. That is not the same thing. Traders sold into uncertainty.
          Others bought the dip. ETF demand continued. The structure held.
          The recent Iran-Israel conflict headlines tested Bitcoin’s resilience. It was a real-world stress test that did not result in technical breakdown or institutional flight. That’s not bullish in a hyped sense; it’s bullish in a structural sense.
          The asset did not flinch when the world briefly tilted toward catastrophe, but that tilt is far from over. Black swan events can affect all asset classes and provide investors with potential positive entries. Gauging if the news effect will be short, medium or long-lived is a tricky question to answer.

          Source: Cointelegraph

          Risk Warnings and Disclaimers
          You understand and acknowledge that there is a high degree of risk involved in trading. Following any strategies or investment methods may lead to potential losses. The content on the site is provided by our contributors and analysts for information purposes only. You are solely responsible for determining whether any trading assets, securities, strategy, or any other product is suitable for investing based on your own investment objectives and financial situation.
          Add to Favorites
          Share

          How the hell is gold red during the war?

          Adam

          Commodity

          Middle East Situation

          If I had told you that Israel and Iran went to war and escalated that war throughout this past week, I am sure you would have expected gold to have rallied quite strongly. Well, the truth is that gold ended the week lower than where it sat before the start of this war.
          So, if I had told you what the news would be before this past week began, I am quite sure that each and every person who erroneously believes in the mechanical paradigm of our financial markets would assume that gold should have had one of its best weeks in 2025. But, clearly, that was not at all what the market experienced, as we saw the exact opposite action of general expectations. In fact, the market seemed to be quite oblivious to this major war action, and you would never even be able to spot this indication by simply looking at the gold chart. Truthfully, you probably would not even know a major Middle East war was being fought, much less the biggest war in decades is being fought in that region.
          I would like to take this opportunity to remind you of several studies which fly in the face of the commonly accepted mechanical paradigm of the market, which will hopefully help you understand the market action this past week.
          In a 1988 study conducted by Cutler, Poterba, and Summers entitled “What Moves Stock Prices,” they reviewed stock market price action after major economic or other type of news (including major political events) in order to develop a model through which one would be able to predict market moves RETROSPECTIVELY. Yes, you heard me right. They were not even at the stage yet of developing a prospective prediction model.
          However, the study concluded that “[m]acroeconomic news . . . explains only about one fifth of the movements in stock market prices.” In fact, they even noted that “many of the largest market movements in recent years have occurred on days when there were no major news events.” They also concluded that “[t]here is surprisingly small effect [from] big news [of] political developments . . . and international events.” They also suggest that:
          “The relatively small market responses to such news, along with evidence that large market moves often occur on days without any identifiable major news releases casts doubt on the view that stock price movements are fully explicable by news. . . “
          In August 1998, the Atlanta Journal-Constitution published an article by Tom Walker, who conducted his own study of 42 years’ worth of “surprise” news events and the stock market’s corresponding reactions. His conclusion, which will be surprising to most, was that it was exceptionally difficult to identify a connection between market trading and dramatic surprise news. Based upon Walker's study and conclusions, even if you had the news beforehand, you would still not be able to determine the direction of the market only based upon such news.
          In 2008, another study was conducted, in which they reviewed more than 90,000 news items relevant to hundreds of stocks over a two-year period. They concluded that large movements in the stocks were NOT linked to any news items:
          “Most such jumps weren’t directly associated with any news at all, and most news items didn’t cause any jumps.”
          Even though most would try to view the lack of upside market action this past week in gold as an anomaly, these studies make it quite clear that it was much more in line with standard market action than being an anomaly. And, it again leads me to highlight the wise words spoken from one of the best investment books I have ever read – The Socionomic Theory of Finance:
          “Observers’ job, as they see it, is simply to identify which external events caused whatever price changes occur. When news seems to coincide sensibly with market movement, they presume a causal relationship. When news doesn’t fit, they attempt to devise a cause-and-effect structure to make it fit. When they cannot even devise a plausible way to twist the news into justifying market action, they chalk up the market moves to “psychology,” which means that, despite a plethora of news and numerous inventive ways to interpret it, their imaginations aren’t prodigious enough to concoct a credible causal story.
          Most of the time it is easy for observers to believe in news causality. Financial markets fluctuate constantly, and news comes out constantly, and sometimes the two elements coincide well enough to reinforce commentators’ mental bias towards mechanical cause and effect. When news and the market fail to coincide, they shrug and disregard the inconsistency. Those operating under the mechanics paradigm in finance never seem to see or care that these glaring anomalies exist.”
          Allow me to quote further points from this most insightful book.
          “None other than the chairman of the Federal Reserve weighed in on this very topic in testimony before Congress. The morning after a one-day 3.3% swoon in the DJIA in 2007, the nations’ top banker said he could not identify ‘a single trigger’ that caused Tuesdays dramatic drop.” This is a remarkable admission for a macroeconomic mechanist who advocates “financial engineering.” More recently, August 20, 2015 sported the biggest down day in 18 months for stock prices, yet reporters admitted there was a ‘lack of major U.S. economic news’ to explain it.”
          To date, we still debate the cause of the Great Depression, or the October 1987 market crash, the 2010 Flash Crash, the Asian financial crisis, and many other “anomalies” in the market. In 1997, a Nobel-prize-winning economist noted “The truth is that nobody really imagined that something like the Asian financial crisis was possible, and even after the fact there is no consensus about why and how it happened.”
          As Mr. Prechter further appropriately noted in his book: “Can you imagine physicists endlessly debating the cause of avalanches? . . . Economists are mystified over the causes of market declines and economic contractions because they are using a mechanical model in the realm of finance where it doesn’t apply.”
          And, yet, no matter how many times investors see the market react opposite of their general expectations, they still maintain the false beliefs upon which they base those expectations. So, why do we continue to fool ourselves into believing in this clearly erroneous mechanical paradigm as applied by the masses? Well, I believe that Daniel Kahneman, in his book Thinking Fast and Slow, tries to provide an explanation. While there is much depth to his analysis, I am going to try to simplify his perspective in the following quotes and summations:
          We have a puzzling limitation within our minds: “[O]ur excessive confidence in what we believe we know, and our apparent inability to acknowledge the full extent of our ignorance and uncertainty of the world we live in. We are prone to overestimate how much we understand about the world . . overconfidence is fed by the illusory certainty of hindsight.”
          “Contrary to the rules of philosophers of science, who advise testing hypotheses by trying to refute them, people seek data that are likely to be compatible with the beliefs they currently hold. The confirmatory bias [of our minds] favors uncritical acceptance of suggestions and exaggerations of the likelihood of extreme and improbable events . . . [our minds are] not prone to doubt. It suppresses ambiguity and spontaneously constructs stories that are as coherent as possible.”
          Over the years, I have tried to convey this message and direct investors away from mechanical paradigm thinking in order to view markets more objectively, thereby allowing them to increase performance in their investment accounts. But, alas, it has been an uphill battle.
          To this end, I will continue to highlight greater minds than mine. Francis Bacon is one such person who comes to mind. For those that may not be familiar with him, he was a 17th century English philosopher and scientist. He is best known for his philosophical advocacy of the scientific method and is considered the creator of empiricism. His works established and popularized inductive methodologies for scientific inquiry often called the Baconian method.
          I think he also provides insight as to why I have been facing an uphill battle. So, I will now combine the thinking of Kahneman and Bacon to try to explain the reason for my struggle:
          Kahneman: “A reliable way to make people believe in falsehoods is frequent repetition, because familiarity is not easily distinguishable from truth. . . “[E]vidence is that we are born prepared to make intentional attributions.” In other words, our minds engage in an automatic search for causality. Moreover, we also engage in a deliberate search for confirming evidence of those propositions once we hold them dear. This is known as “positive test strategy.”
          And, Francis Bacon concluded something similar centuries before:
          Bacon: “The human understanding when it has once adopted an opinion (either being the received opinion or as being agreeable to itself) draws all things else to support and agree with it.”
          So, as the media continually reinforces the clearly erroneous mechanics paradigm day after day for decades on end, investors have been trained in this false methodology, and have mindlessly adopted it as the absolute in truth. And, as Bacon noted, once it has been adopted as an absolute truth, investors shut out all contrary evidence to this false truth, and this is the reason they simply shrug off empirical evidence, such as what was experienced by this past weeks’ market action. And, now we have a better understanding of Mr. Prechter’s point when he noted that “[t]hose operating under the mechanics paradigm in finance never seem to see or care that these glaring anomalies exist.”
          This now brings me to a quote from Daniel Crosby’s The Behavioral Investor, wherein he noted that “trusting in common myths is what makes you human. But learning not to is what will make you a successful investor.” Which leads me to the more modern work of Benoit Mandelbrot, a French-American mathematician, who outright stated that one cannot reasonably apply an economic mechanic model to the financial markets:
          “From the availability of the multifractal alternative, it follows that, today, economics and finance must be sharply distinguished . . .”
          Hence, you now have the basis and the reasoning as to why we apply Elliott Wave analysis, a fractal-based market analysis system, as our primary market guide. And, this is why I advise all our clients to turn off their televisions and be quite judicious as to what you read when you are making your investment decisions.
          Now, I will tell you that I ignored the news of the day, and simply provided a mathematical analysis to our clients over the past week, which provides a much better guide to understanding and tracking gold than any of the fundamental or news factors which most follow. As you can see from the chart below, I had a resistance box outlined to our clients, which began at 3474 in the gold futures. And, despite the escalation of the Middle East war, I expected gold to turn down at this resistance.
          How the hell is gold red during the war?_1
          As we now know, gold topped within $2 of hitting my target, and has since turned down as we expected, despite the escalation of the war. Now, I am quite sure many of you will attempt some mental gymnastics to explain why gold is now lower than when the war began, but you would simply be fooling yourselves. This is clearly not what you expected from the gold market when a major war was being fought. And, I would like to provide you with two quotes from Ben Franklin to assist you in opening your mind as to how gold really moves:
          “So convenient a thing it is to be a reasonable creature, since it enables one to find or to make a reason for everything one has a mind to do.”
          “Geese are but Geese tho’ we may think ‘em Swans; and Truth will be Truth tho’ it sometimes prove mortifying and distasteful.”
          To those I will also add an insightful quote from another of our forefathers of The United States – John Adams:
          "Facts are stubborn things; and whatever may be our wishes, our inclinations, or the dictates of our passion, they cannot alter the state of facts and evidence."
          So, this leaves all investors with a choice. Either you can continue to track the gold market in the false manner to which you have become accustomed, or you can open your mind to a different path, which has proven through the years to be much more accurate and insightful as to the machinations of the gold price through its upside and downside cycles.
          To that end, I want to reiterate an expectation I maintain. As long as that resistance box that you see on the chart above holds as resistance, I am expecting a larger decline to take shape, which will likely be our next buying opportunity in the gold market. But, I will warn you that this will lead to what I believe is the final rally in the cycle which began at the end of 2015, when gold bottomed in the $1,050 region, which we also called at that time.
          In fact, one of my long-term clients posted this in our trading room at Elliottwavetrader.net this past Thursday:
          “For those that have been here long enough. Anyone remember this post [by Avi]:
          ‘If many of you follow us on metals and miners, I think we will likely generate more millionaires on this site than any other over the next 10 years. Yea, I know I am sounding crazy, but this stuff is the best set up I have seen in my life.’
          Why I think Avi is the GOAT with metals. He said in 10 years, it’s almost 11 years since his post and nearly 10 years since we bottomed in metals.”
          And, for those wondering about the my shorter term outlook, I would like to see the GLD price drop down to at least the 275GLD region for the next buying opportunity. We will adjust as needed based upon the action we see in the coming few weeks. But, for now, that is the set up that I am seeking to develop.
          In conclusion, while I certainly provide analysis to our almost 9000 members and 1000 money manager clients at Elliottwavetradet.net, I also encourage investors to think independently and test what you are told through a prism of truth and history. Much of what you read and are told through your media of choice usually presents noise which often has you looking the wrong way in the financial market you track. It is time to take a more mature and accurate approach to financial markets, which will assist every investor’s goal – increasing the value of your investment account.

          source :kitco

          Risk Warnings and Disclaimers
          You understand and acknowledge that there is a high degree of risk involved in trading. Following any strategies or investment methods may lead to potential losses. The content on the site is provided by our contributors and analysts for information purposes only. You are solely responsible for determining whether any trading assets, securities, strategy, or any other product is suitable for investing based on your own investment objectives and financial situation.
          Add to Favorites
          Share
          FastBull
          Copyright © 2025 FastBull Ltd

          728 RM B 7/F GEE LOK IND BLDG NO 34 HUNG TO RD KWUN TONG KLN HONG KONG

          TelegramInstagramTwitterfacebooklinkedin
          App Store Google Play Google Play
          Products
          Charts

          Chats

          Q&A with Experts
          Screeners
          Economic Calendar
          Data
          Tools
          Membership
          Features
          Function
          Markets
          Copy Trading
          Latest Signals
          Contests
          News
          Analysis
          24/7
          Columns
          Education
          Company
          Careers
          About Us
          Contact Us
          Advertising
          Help Center
          Feedback
          User Agreement
          Privacy Policy
          Business

          White Label

          Data API

          Web Plug-ins

          Poster Maker

          Affiliate Program

          Risk Disclosure

          The risk of loss in trading financial instruments such as stocks, FX, commodities, futures, bonds, ETFs and crypto can be substantial. You may sustain a total loss of the funds that you deposit with your broker. Therefore, you should carefully consider whether such trading is suitable for you in light of your circumstances and financial resources.

          No decision to invest should be made without thoroughly conducting due diligence by yourself or consulting with your financial advisors. Our web content might not suit you since we don't know your financial conditions and investment needs. Our financial information might have latency or contain inaccuracy, so you should be fully responsible for any of your trading and investment decisions. The company will not be responsible for your capital loss.

          Without getting permission from the website, you are not allowed to copy the website's graphics, texts, or trademarks. Intellectual property rights in the content or data incorporated into this website belong to its providers and exchange merchants.

          Not Logged In

          Log in to access more features

          FastBull Membership

          Not yet

          Purchase

          Become a signal provider
          Help Center
          Customer Service
          Dark Mode
          Price Up/Down Colors

          Log In

          Sign Up

          Position
          Layout
          Fullscreen
          Default to Chart
          The chart page opens by default when you visit fastbull.com