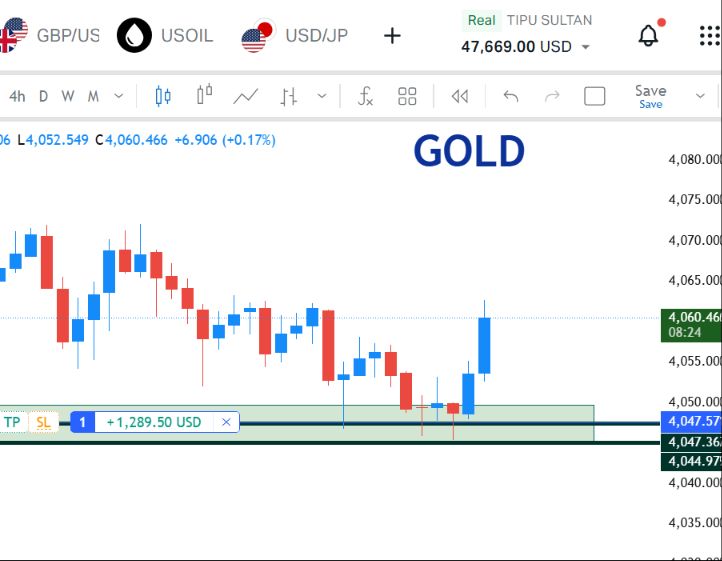
• Trade
  • Markets
  • Copy
  • Contests
  • 24/7
  • Calendar
  • Q&A
  • Chats
Screeners
SYMBOL
LAST
BID
ASK
HIGH
LOW
NET CHG.
%CHG.
SPREAD
SOURCE
SPX
S&P 500 Index
7431.45
7431.45
7431.45
7456.40
7363.01
+37.14
+ 0.50%
--
--
DJI
Dow Jones Industrial Average
51202.25
51202.25
51202.25
51409.70
50827.84
+353.49
+ 0.70%
--
--
IXIC
NASDAQ Composite Index
25888.83
25888.83
25888.83
26010.31
25599.94
+79.18
+ 0.31%
--
--
USDX
US Dollar Index
99.460
99.460
99.540
99.870
99.450
-0.200
-0.20%
--
--
EURUSD
Euro / US Dollar
1.15661
1.15661
1.15677
1.15892
1.15569
-0.00122
-0.11%
--
--
GBPUSD
Pound Sterling / US Dollar
1.34028
1.34028
1.34070
1.34259
1.33833
-0.00120
-0.09%
--
--
XAUUSD
Gold / US Dollar
4219.62
4219.62
4219.62
4246.22
4170.03
+7.79
+ 0.18%
--
--
WTI
Light Sweet Crude Oil
82.864
82.864
82.897
85.747
81.798
-2.268
-2.66%
--
--

Community Accounts

Signal Accounts
--
Profit Accounts
--
Loss Accounts
--
View More

Become a signal provider

Sell trading signals to earn additional income

View More

Guide to Copy Trading

Get started with ease and confidence

View More

Signal Accounts for Members

All Signal Accounts

Best Return
  • Best Return
  • Best P/L
  • Best MDD
Past 1W
  • Past 1W
  • Past 1M
  • Past 1Y

All Contests

  • All
  • Recommend
  • Stocks
  • Cryptocurrencies
  • Central Banks
  • Trump Updates
  • Featured News
Top News Only
Share

Qatar Set Its Official Selling Price For Marine Crude Oil In July At A Premium Of $6.00 Per Barrel Over The Oman/Dubai Average, And Its Official Selling Price For Onshore Crude Oil At A Premium Of $6.50 Per Barrel Over The Oman/Dubai Average

Share

Market News: Ukrainian President Zelenskyy Spoke With US President Trump

Share

Trump: 'Very Close' To U.S.-Iran Deal That Will Bring Peace To Lebanon

Share

US President Trump: The Attack On Beirut This Morning Should Not Have Happened, Especially On This Special Day When We Are Close To Reaching A Peace Agreement With Iran

Share

U.S. Defense Secretary Hergsays: I Expect To Engage In More In-depth Negotiations And I Believe These Negotiations Will Continue

Share

U.S. Defense Secretary Hergsays: The Freedom Project Has Never Been Discontinued

Share

[Bitcoin Falls Below $64,000, 24-hour Change -0.3%] June 14th, According To HTX Market Data, Bitcoin Dropped Below $64,000, With A 0.3% Decrease In The Last 24 Hours

Share

European Commission: Tomorrow, Ukraine And Moldova Will Take A Significant Step On Their Path To Joining The European Union

Share

Two Helicopters Collide In Brazil, Killing Six People

Share

On The Eve Of Their Opening Match, Multiple Members Of Iran's National Football Team Delegation Were Again Denied U.S. Visas

Share

Failure Of The Spent Fuel Pool Cooling System At The Fukushima Nuclear Power Plant

Share

Officials Have Warned That U.S. Military Aircraft Are Occupying A Significant Amount Of Civilian Airport Airspace

Share

Guangdong Has Upgraded Its Flood-control Emergency Response To Level III

Share

[MegaETH's Native Token MEGA Surges Over 20% In 24 Hours, Surpassing $0.068] June 14th, According To HTX Market Data, MegaETH's Native Token MEGA Has Surpassed $0.068, With A 24-hour Price Increase Expanding To 20.13%

Share

The U.S. Reportedly Agreed To Unfreeze $25 Billion In Iranian Assets

Share

According To A Reuters/Ipsos Poll, U.S. President Trump's Approval Rating Among The American Public Has Dropped To 50%, The Lowest Level Of His Presidency, Down From 60% In February 2025

Share

Israeli Officials Say That Israeli Prime Minister Netanyahu And US President Trump Have A Good Relationship, And That Disagreements Are Inevitable Among Allies, But These Disagreements Can Be Overcome

Share

Kuwait Set Its Official Crude Oil Price For July Exports To Asia At A Premium Of $5.25 Over The Oman/Dubai Average

Share

Ukrainian President Zelensky: Europe Urgently Needs To Take Legislative Measures That Enable It Not Only To Detain Oil Tankers And Restrict Oil Shipments, But Also To Confiscate The Oil Carried By Ships. This Will Undoubtedly Help Bring Peace Closer

Share

Ukrainian President Zelenskyy Expressed His Gratitude To Britain For Seizing A Russian Shadow Fleet Vessel That Was Under Sanctions

TIME
ACT
FCST
PREV
IMPACT
Russia Trade Balance (Apr)

A:--

F: --

P: --

WTI
  • WTI
  • XAUUSD
  • XAGUSD
  • USDX
U.S. EIA Weekly Natural Gas Stocks Change

A:--

F: --

P: --

WTI
  • WTI
  • XAUUSD
  • XAGUSD
  • USDX
Argentina CPI MoM (May)

A:--

F: --

P: --

XAUUSD
  • XAUUSD
  • XAGUSD
  • WTI
  • USDX
U.S. Weekly Treasuries Held by Foreign Central Banks

A:--

F: --

P: --

USDX
  • USDX
  • XAUUSD
  • XAGUSD
  • WTI
U.K. Construction Output YoY (Apr)

A:--

F: --

P: --

GBPUSD
  • GBPUSD
  • XAUUSD
  • XAGUSD
  • WTI
  • USDX
U.K. GDP YoY (SA) (Apr)

A:--

F: --

P: --

GBPUSD
  • GBPUSD
  • XAUUSD
  • XAGUSD
  • WTI
  • USDX
U.K. Services Index MoM

A:--

F: --

P: --

GBPUSD
  • GBPUSD
  • XAUUSD
  • XAGUSD
  • WTI
  • USDX
U.K. Trade Balance EU (SA) (Apr)

A:--

F: --

P: --

GBPUSD
  • GBPUSD
  • XAUUSD
  • XAGUSD
  • WTI
  • USDX
U.K. Industrial Output MoM (Apr)

A:--

F: --

P: --

GBPUSD
  • GBPUSD
  • XAUUSD
  • XAGUSD
  • WTI
  • USDX
U.K. Manufacturing Output MoM (Apr)

A:--

F: --

P: --

GBPUSD
  • GBPUSD
  • XAUUSD
  • XAGUSD
  • WTI
  • USDX
U.K. Monthly GDP 3M/3M Change (Apr)

A:--

F: --

P: --

GBPUSD
  • GBPUSD
  • XAUUSD
  • XAGUSD
  • WTI
  • USDX
U.K. Trade Balance Non-EU (SA) (Apr)

A:--

F: --

P: --

GBPUSD
  • GBPUSD
  • XAUUSD
  • XAGUSD
  • WTI
  • USDX
U.K. Trade Balance (Apr)

A:--

F: --

P: --

GBPUSD
  • GBPUSD
  • XAUUSD
  • XAGUSD
  • WTI
  • USDX
U.K. Construction Output MoM (SA) (Apr)

A:--

F: --

P: --

GBPUSD
  • GBPUSD
  • XAUUSD
  • XAGUSD
  • WTI
  • USDX
U.K. Industrial Output YoY (Apr)

A:--

F: --

P: --

GBPUSD
  • GBPUSD
  • XAUUSD
  • XAGUSD
  • WTI
  • USDX
U.K. Trade Balance (SA) (Apr)

A:--

F: --

P: --

GBPUSD
  • GBPUSD
  • XAUUSD
  • XAGUSD
  • WTI
  • USDX
U.K. Manufacturing Output YoY (Apr)

A:--

F: --

P: --

GBPUSD
  • GBPUSD
  • XAUUSD
  • XAGUSD
  • WTI
  • USDX
U.K. GDP MoM (Apr)

A:--

F: --

P: --

GBPUSD
  • GBPUSD
  • XAUUSD
  • XAGUSD
  • WTI
  • USDX
France HICP Final MoM (May)

A:--

F: --

P: --

EURUSD
  • EURUSD
  • XAUUSD
  • XAGUSD
  • WTI
  • USDX
U.K. Inflation Rate Expectations

A:--

F: --

P: --

GBPUSD
  • GBPUSD
  • XAUUSD
  • XAGUSD
  • WTI
  • USDX
China, Mainland Outstanding Loans Growth YoY (May)

A:--

F: --

P: --

XAUUSD
  • XAUUSD
  • XAGUSD
  • WTI
  • USDX
China, Mainland M2 Money Supply YoY (May)

A:--

F: --

P: --

XAUUSD
  • XAUUSD
  • XAGUSD
  • WTI
  • USDX
China, Mainland M1 Money Supply YoY (May)

A:--

F: --

P: --

XAUUSD
  • XAUUSD
  • XAGUSD
  • WTI
  • USDX
China, Mainland M0 Money Supply YoY (May)

A:--

F: --

P: --

XAUUSD
  • XAUUSD
  • XAGUSD
  • WTI
  • USDX
India CPI YoY (May)

A:--

F: --

P: --

XAUUSD
  • XAUUSD
  • XAGUSD
  • WTI
  • USDX
India Deposit Gowth YoY

A:--

F: --

P: --

XAUUSD
  • XAUUSD
  • XAGUSD
  • WTI
  • USDX
Brazil CPI YoY (May)

A:--

F: --

P: --

XAUUSD
  • XAUUSD
  • XAGUSD
  • WTI
  • USDX
U.S. 5-10 Year-Ahead Inflation Expectations (Jun)

A:--

F: --

P: --

XAUUSD
  • XAUUSD
  • XAGUSD
  • WTI
  • USDX
U.S. Weekly Total Rig Count

A:--

F: --

P: --

WTI
  • WTI
  • XAUUSD
  • XAGUSD
  • USDX
U.S. Weekly Total Oil Rig Count

A:--

F: --

P: --

WTI
  • WTI
  • XAUUSD
  • XAGUSD
  • USDX
U.K. Rightmove House Price Index YoY (Jun)

--

F: --

P: --

Saudi Arabia CPI YoY (May)

--

F: --

P: --

ECB President Lagarde Speaks
Euro Zone Industrial Output YoY (Apr)

--

F: --

P: --

Euro Zone Trade Balance (Not SA) (Apr)

--

F: --

P: --

Euro Zone Trade Balance (SA) (Apr)

--

F: --

P: --

Euro Zone Industrial Output MoM (Apr)

--

F: --

P: --

Euro Zone Total Reserve Assets (May)

--

F: --

P: --

Canada National Economic Confidence Index

--

F: --

P: --

Canada New Housing Starts (May)

--

F: --

P: --

Canada Manufacturing New Orders MoM (Apr)

--

F: --

P: --

Canada Manufacturing Unfilled Orders MoM (Apr)

--

F: --

P: --

U.S. NY Fed Manufacturing Employment Index (Jun)

--

F: --

P: --

U.S. NY Fed Manufacturing New Orders Index (Jun)

--

F: --

P: --

U.S. NY Fed Manufacturing Prices Received Index (Jun)

--

F: --

P: --

Canada Wholesale Inventory MoM (Apr)

--

F: --

P: --

Canada Wholesale Sales YoY (Apr)

--

F: --

P: --

Canada Manufacturing Inventory MoM (Apr)

--

F: --

P: --

Canada Wholesale Inventory YoY (Apr)

--

F: --

P: --

Canada Wholesale Sales MoM (SA) (Apr)

--

F: --

P: --

U.S. NY Fed Manufacturing Index (Jun)

--

F: --

P: --

U.S. Industrial Output MoM (SA) (May)

--

F: --

P: --

U.S. Capacity Utilization MoM (SA) (May)

--

F: --

P: --

U.S. Manufacturing Output MoM (SA) (May)

--

F: --

P: --

U.S. Industrial Output YoY (May)

--

F: --

P: --

U.S. Manufacturing Capacity Utilization (May)

--

F: --

P: --

U.S. NAHB Housing Market Index (Jun)

--

F: --

P: --

U.K. Rightmove House Price Index YoY (Jun)

--

F: --

P: --

China, Mainland Urban Area Unemployment Rate (May)

--

F: --

P: --

China, Mainland Industrial Output YoY (YTD) (May)

--

F: --

P: --

Japan Benchmark Interest Rate

--

F: --

P: --

Q&A with Experts
    • All
    • Chatrooms
    • Groups
    • Friends
    EuroTrader flag
    EuroTrader
    @Ahmed Aliokay, this is the chart, we are in bearish trend, so the market is pulling back to a premium level to continue the sell later
    EuroTrader flag
    EuroTrader
    @Ahmed AliWhen market tap into that zone, I'll wait for MSs, before I trade it with a confirmation
    James flag
    EuroTrader
    @JamesHere brother, this has been the zone I've been watching since last week, other things that happened between are just ranges
    @EuroTraderThanks a lot for this, I'm tempting to set a limit
    Ahmed Ali flag
    sell or reversal
    EuroTrader flag
    James
    @EuroTraderThanks a lot for this, I'm tempting to set a limit
    @JamesWell, no matter how beautiful my chart is, I like to trade with confirmation entries
    James flag
    EuroTrader
    @JamesWell, no matter how beautiful my chart is, I like to trade with confirmation entries
    @EuroTraderWhy do you always do that?
    EuroTrader flag
    Ahmed Ali
    share and explain
    @Ahmed AliHey friend, hope you have seen what I shared on the EURUSD market?
    EuroTrader flag
    James
    @EuroTraderWhy do you always do that?
    @JamesWell many reasons, firstly it reduces my risk and gives me a better reward
    Ahmed Ali flag
    yes sir
    Ahmed Ali flag
    sell or reversal
    EuroTrader flag
    James
    @EuroTraderWhy do you always do that?
    @JamesSecondly it helps me filter wrong zones and I will be clear when the market will move
    EuroTrader flag
    Ahmed Ali
    sell or reversal
    @Ahmed AliA sell mate, we can also call it a continuation of the bearish trend
    Ahmed Ali flag
    excellent clear bias downtrend
    EuroTrader flag
    Ahmed Ali
    excellent clear bias downtrend
    @Ahmed AliYeah that's what I'm preparing for, if you also look at the monthly timeframe you will notice where the trend is heading
    Nawhdir Øt94 flag
    EuroTrader
    @Nawhdir Øt94Oh so sorry about this, I've noticed seems like BTC is not favourable to you on Sundays?
    @EuroTrader
    EuroTrader flag
    Nawhdir Øt94
    @EuroTrader
    @Nawhdir Øt94Hey cousin, welcome back, what's the matter tell me?
    James flag
    EuroTrader
    @JamesSecondly it helps me filter wrong zones and I will be clear when the market will move
    @EuroTraderwow this is good sir
    Sabaf Tech flag
    this is group
    James flag
    Sabaf Tech
    this is group
    @Sabaf TechHello
    Sabaf Tech flag
    hello
    Type here...
    Add Symbol or Code

      No matching data

      All
      Recommend
      Stocks
      Cryptocurrencies
      Central Banks
      Trump Updates
      Featured News
      • All
      • Russia-Ukraine Conflict
      • Middle East Flashpoint
      • All
      • Russia-Ukraine Conflict
      • Middle East Flashpoint
      Search
      Products

      Charts Free Forever

      Chats Q&A with Experts
      Screeners Economic Calendar Data Tools
      Membership Features
      Data Warehouse Market Trends Institutional Data Policy Rates Macro

      Market Trends

      Market Sentiment Order Book Forex Correlations

      Top Indicators

      Charts Free Forever
      Markets

      News

      24/7 Analysis Education

      Latest Views

      Latest Update

      Signals

      Copy Rankings Latest Signals Become a signal provider AI Rating
      Contests
      Brokers

      Overview Brokers Assessment Rankings Regulators News Claims
      Broker listing Forex Brokers Comparison Tool Live Spread Comparison Scam
      Q&A Complaint Scam Alert Videos Tips to Detect Scam
      More

      Business
      Events
      Careers About Us Advertising Help Center

      White Label

      Broker API

      Data API

      Web Plug-ins

      Affiliate Program

      Awards Institution Evaluation IB Seminar Salon Event Exhibition
      Vietnam Thailand Singapore Dubai
      Fans Party Investment Sharing Session
      FastBull Summit BrokersView Expo
      Recent Searches
        Top Searches
          Markets
          Analysis
          User
          24/7
          Economic Calendar
          Education
          Data
          • Names
          • Latest
          • Prev

          View All

          No data

          Scan to Download

          Faster Charts, Chat Faster!

          Download
          English
          • English
          • Español
          • العربية
          • Bahasa Indonesia
          • Bahasa Melayu
          • Tiếng Việt
          • ภาษาไทย
          • Français
          • Italiano
          • Türkçe
          • Русский язык
          • 简中
          • 繁中
          Open Account
          Search
          Products
          Charts Free Forever
          Markets
          News
          Signals

          Copy Rankings Latest Signals Become a signal provider AI Rating
          Contests
          Brokers

          Overview Brokers Assessment Rankings Regulators News Claims
          Broker listing Forex Brokers Comparison Tool Live Spread Comparison Scam
          Q&A Complaint Scam Alert Videos Tips to Detect Scam
          More

          Business
          Events
          Careers About Us Advertising Help Center

          White Label

          Broker API

          Data API

          Web Plug-ins

          Affiliate Program

          Awards Institution Evaluation IB Seminar Salon Event Exhibition
          Vietnam Thailand Singapore Dubai
          Fans Party Investment Sharing Session
          FastBull Summit BrokersView Expo

          Japanese Yen Forecast: USD/JPY Steadies Ahead Of Key Fed Projections

          Justin

          Forex

          Economic

          Summary:

          Japanese producer prices lift BoJ hike expectations and pressure USD/JPY, with the Fed’s rate cut outlook and dot plot now driving the pair’s short-term direction.

          Key Points:

          · Rising Japanese producer prices boost BoJ rate hike bets, pressuring USD/JPY and signaling renewed inflation risks.
          · Fed uncertainty grows as missing October data clouds projections, heightening volatility for USD/JPY traders.
          · Diverging Fed–BoJ policy paths support a bearish medium-term USD/JPY outlook despite short-term bullish signals.

          Japanese producer prices fueled speculation about a December Bank of Japan rate hike on Wednesday, December 10. Producer prices signaled sticky consumer price inflation midway through the fourth quarter. USD/JPY dropped in response to the uptick in producer prices, partially reversing the previous day's 0.63% loss on the hot US JOLTs Job Openings report.

          While the November figures bolstered bets about a December BoJ rate hike, traders faced a higher degree of uncertainty on the Fed's monetary policy outlook. Market bets on a December Fed rate cut remained firm despite solid overnight US jobs data.

          However, the absence of October inflation and labor market data, canceled because of the US government shutdown, has left the Fed flying blind on crucial reports needed to make an informed interest rate decision and offer meaningful economic projections.

          Given these dynamics and USD/JPY's return to 156, the short-term outlook looks cautiously bullish, while the medium-term outlook remains bearish, hinged on the Fed cutting and the BoJ raising rates.

          Below, I'll discuss the macro backdrop, the near-term price catalysts, and technical levels traders should closely watch.

          Japanese Producer Prices Give BoJ Hawks a Strong Footing

          Producer prices increased 2.7% year-on-year in November, mirroring October's trend, lifting demand for the Japanese yen. November's producer prices indicated rising import prices, forcing producers to pass higher costs on to consumers. Higher prices may also signal stronger demand, enabling producers to raise prices and fuel demand-driven inflation.

          The BoJ has raised previously concerns about the weaker yen pushing import prices higher, adversely affecting household purchasing power. Rising producer prices will give the BoJ hawks a stronger argument to raise interest rates on December 19.

          USD/JPY responded, briefly falling from 156.840 to 156.795 after the data.

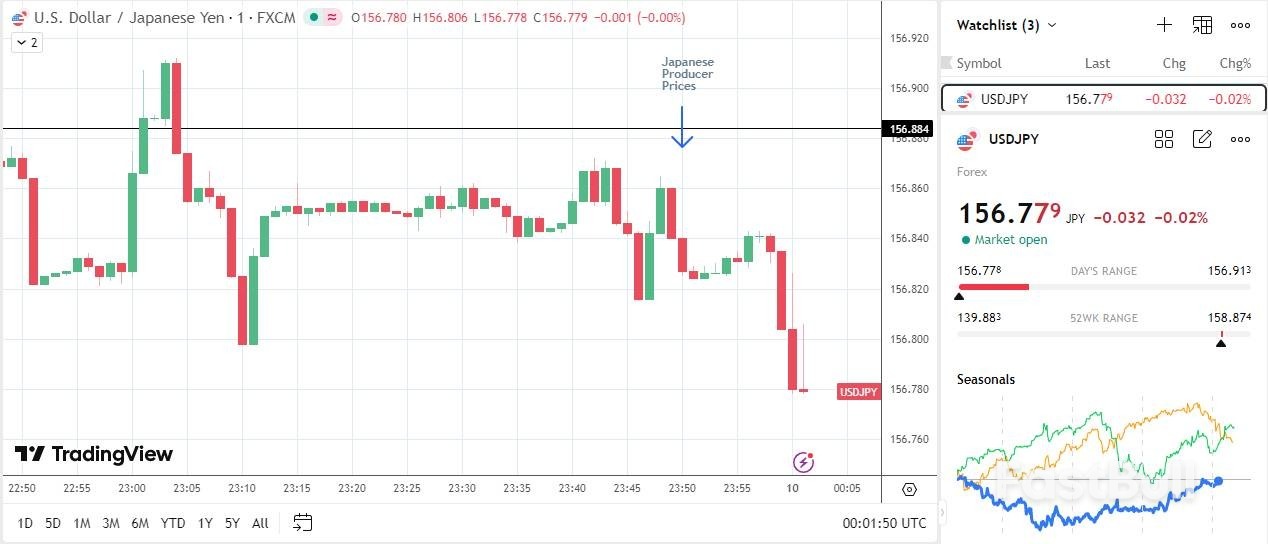
          USDJPY – One Minute Chart – 101225

          The November data followed BoJ Governor Kazuo Ueda's optimistic economic outlook. He stated that the economy will return to growth in the fourth quarter and beyond, reinforcing his recent bullish pivot. Last week, Governor Ueda supported a rate hike, citing strong wage growth, fading US tariff risks, and FX weakness.

          While expectations of a BoJ rate hike are strengthening yen demand, the FOMC interest rate decision, FOMC Economic Projections, and Fed Chair Powell's press conference will dictate buyer appetite for the US dollar.

          FOMC Interest Rate Decision Looms

          Later on Wednesday, the Fed will take center stage as investors await its highly anticipated interest rate decision and Economic Projections. Economists expect the Fed to lower interest rates by 25 basis points, with the CME FedWatch Tool giving an 87.6% chance of a rate cut.

          Barring an unexpected hold or a surprise 50-basis-point cut, the market focus will be on the Economic Projections and the dot plot on rate expectations. Notably, the chances of a Q1 2026 rate cut declined overnight.

          The FOMC Committee has divided into two camps in recent months. On one side, members support further policy easing to bolster a cooling labor market, while on the other, voters view sticky inflation as a reason to pause further cuts. Given the division among voting members, a hawkish cut looks likely, where the Fed downplays further easing in the near-term, but remains data dependent.

          Economic Projections and Dot Plot to Spotlight the Greenback

          The Economic Projections and dot plot will provide the crucial insights into the Fed's outlook and potential rate path. For context, the September dot plot projected a 3.25%-3.50% Fed Funds Rate (FFR) by the end of 2026.

          A 25-basis-point rate cut today would leave two further rate cuts to align with the September dot plot, the baseline for traders. A dovish Fed rate cut would be a lower FFR by the end of 2026, while a hawkish cut would be a higher 2026 FFR forecast.

          Notably, the projections will be based on outdated inflation and jobs data, given the cancellation of October data. The absence of October's government reports may downplay the influence of inflation, unemployment, and GDP projections on US dollar demand. However, given the USD/JPY sensitivity to September's JOLTs job openings, the pair will be exposed to heightened volatility.

          Meanwhile, there is also a potential announcement on bond purchases (quantitative easing).

          With increased uncertainty about the post-December Fed rate path, the short- and medium-term outlook hinges on the Fed and the BoJ's interest rate decisions and policy outlooks. Despite the uncertainty, the Fed's easing and the BoJ's tightening support a bearish medium-term outlook for USD/JPY.

          Technical Outlook: USD/JPY on a Downward Trajectory

          Looking at the daily chart, USD/JPY traded above the 50-day and 200-day Exponential Moving Averages (EMAs), signaling a bullish bias. However, fundamentals have begun to shift from the technical trend, supporting a bearish medium-term outlook.

          A break below the 155 support level would bring the 50-day EMA into play. If breached, the 153 support level would be the next key support. Significantly, a sustained fall below the 50-day EMA would signal a bearish trend reversal, supporting a near-term drop toward 150.

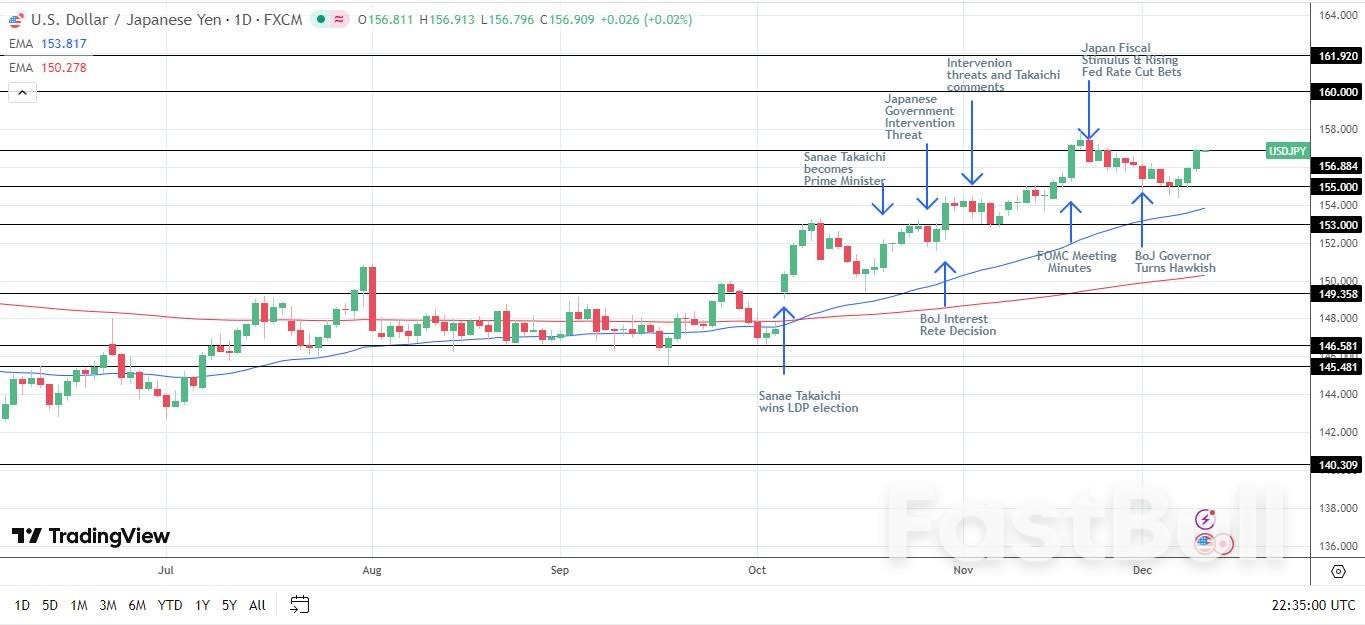
          USDJPY – Daily Chart – 101225

          Position and Upside Risk

          In my view, a narrow US-Japan rate differential supports a bearish medium-term outlook. A sustained USD/JPY drop below the 50-day EMA would signal a fall toward the 200-day EMA. Breaching the 200-day EMA would affirm a bearish trend reversal.

          However, upside risks could derail the bearish momentum. These risks include:

          · Dovish BoJ rhetoric.
          · A hawkish Fed rate cut.
          · Fewer than two Fed rate cuts on the dot plot.

          Nevertheless, yen intervention warnings are likely to cap the upside around the November 20 high of 157.893, based on past communication.

          Read the full USD/JPY forecast, including chart setups and trade ideas.

          Conclusion: Longer-Term Fall to 140 Hinges on the Dot Plot

          In summary, the BoJ's support for a December rate hike leaves the Fed in the driving seat. A dovish Fed rate cut, projecting two to three policy adjustments in 2026, and QE would align with the bearish medium-term outlook for USD/JPY. Furthermore, a dovish Fed rate cut could pave the way toward 130 over the 6-12 month time horizon.

          Source: FX Empire

          To stay updated on all economic events of today, please check out our Economic calendar
          Risk Warnings and Disclaimers
          You understand and acknowledge that there is a high degree of risk involved in trading. Following any strategies or investment methods may lead to potential losses. The content on the site is provided by our contributors and analysts for information purposes only. You are solely responsible for determining whether any trading assets, securities, strategy, or any other product is suitable for investing based on your own investment objectives and financial situation.
          Add to Favorites
          Share
          FastBull
          Copyright © 2026 FastBull Ltd

          728 RM B 7/F GEE LOK IND BLDG NO 34 HUNG TO RD KWUN TONG KLN HONG KONG

          TelegramInstagramTwitterfacebooklinkedin
          App Store Google Play Android Windows
          Products
          Charts

          Chats

          Q&A with Experts
          Screeners
          Economic Calendar
          Data
          Tools
          Membership
          Features
          Function
          Markets
          Copy Trading
          Latest Signals
          Contests
          24/7
          Analysis
          Education
          Company
          Careers
          About Us
          Contact Us
          Advertising
          Download FastBull
          Help Center
          Feedback
          User Agreement
          Privacy Policy
          Personal Information Protection Statement
          Business

          White Label

          Broker API

          Data API

          Web Plug-ins

          Poster Maker

          Affiliate Program

          Risk Disclosure

          The risk of loss in trading financial instruments such as stocks, FX, commodities, futures, bonds, ETFs and crypto can be substantial. You may sustain a total loss of the funds that you deposit with your broker. Therefore, you should carefully consider whether such trading is suitable for you in light of your circumstances and financial resources.

          No decision to invest should be made without thoroughly conducting due diligence by yourself or consulting with your financial advisors. Our web content might not suit you since we don't know your financial conditions and investment needs. Our financial information might have latency or contain inaccuracy, so you should be fully responsible for any of your trading and investment decisions. The company will not be responsible for your capital loss.

          Without getting permission from the website, you are not allowed to copy the website's graphics, texts, or trademarks. Intellectual property rights in the content or data incorporated into this website belong to its providers and exchange merchants.

          Not Logged In

          Log in to access more features

          Connect Broker
          Become a signal provider
          Help Center
          Customer Service
          Dark Mode
          Price Up/Down Colors

          Log In

          Sign Up

          Position
          Layout
          Fullscreen
          Default to Chart
          The chart page opens by default when you visit fastbull.com