

Markets
News
Analysis
User
24/7
Economic Calendar
Education
Data
- Names
- Latest
- Prev


Signal Accounts for Members
All Signal Accounts
All Contests
 Italy Retail Sales MoM (SA) (Oct)
A:--
F: --
P: --
 Euro Zone Employment YoY (SA) (Q3)
A:--
F: --
P: --
Euro Zone GDP Final YoY (Q3)A:--
F: --
P: --
Euro Zone GDP Final QoQ (Q3)A:--
F: --
P: --
Euro Zone Employment Final QoQ (SA) (Q3)A:--
F: --
P: --
Euro Zone Employment Final (SA) (Q3)A:--
F: --
 Brazil PPI MoM (Oct)
A:--
F: --
P: --
 Mexico Consumer Confidence Index (Nov)
A:--
F: --
P: --
 Canada Unemployment Rate (SA) (Nov)
A:--
F: --
P: --
Canada Labor Force Participation Rate (SA) (Nov)A:--
F: --
P: --
Canada Employment (SA) (Nov)A:--
F: --
P: --
Canada Part-Time Employment (SA) (Nov)A:--
F: --
P: --
Canada Full-time Employment (SA) (Nov)A:--
F: --
P: --
 U.S. Personal Income MoM (Sept)
A:--
F: --
P: --
U.S. PCE Price Index YoY (SA) (Sept)A:--
F: --
P: --
U.S. PCE Price Index MoM (Sept)A:--
F: --
P: --
U.S. Personal Outlays MoM (SA) (Sept)A:--
F: --
P: --
U.S. Core PCE Price Index MoM (Sept)A:--
F: --
P: --
U.S. Core PCE Price Index YoY (Sept)A:--
F: --
P: --
U.S. UMich 5-Year-Ahead Inflation Expectations Prelim YoY (Dec)A:--
F: --
P: --
U.S. Real Personal Consumption Expenditures MoM (Sept)A:--
F: --
P: --
U.S. 5-10 Year-Ahead Inflation Expectations (Dec)A:--
F: --
P: --
U.S. UMich Current Economic Conditions Index Prelim (Dec)A:--
F: --
P: --
U.S. UMich Consumer Sentiment Index Prelim (Dec)A:--
F: --
P: --
U.S. UMich 1-Year-Ahead Inflation Expectations Prelim (Dec)A:--
F: --
P: --
U.S. UMich Consumer Expectations Index Prelim (Dec)A:--
F: --
P: --
U.S. Weekly Total Rig CountA:--
F: --
P: --
U.S. Weekly Total Oil Rig CountA:--
F: --
P: --
U.S. Unit Labor Cost Prelim (SA) (Q3)--
F: --
P: --
U.S. Consumer Credit (SA) (Oct)A:--
F: --
P: --
 China, Mainland Foreign Exchange Reserves (Nov)
--
F: --
P: --
China, Mainland Exports YoY (USD) (Nov)--
F: --
P: --
China, Mainland Imports YoY (CNH) (Nov)--
F: --
P: --
China, Mainland Imports YoY (USD) (Nov)--
F: --
P: --
China, Mainland Imports (CNH) (Nov)--
F: --
P: --
China, Mainland Trade Balance (CNH) (Nov)--
F: --
P: --
China, Mainland Exports (Nov)--
F: --
P: --
 Japan Wages MoM (Oct)
--
F: --
P: --
Japan Trade Balance (Oct)--
F: --
P: --
Japan Nominal GDP Revised QoQ (Q3)--
F: --
P: --
Japan Trade Balance (Customs Data) (SA) (Oct)--
F: --
P: --
Japan GDP Annualized QoQ Revised (Q3)--
F: --
China, Mainland Exports YoY (CNH) (Nov)--
F: --
P: --
China, Mainland Trade Balance (USD) (Nov)--
F: --
P: --
 Germany Industrial Output MoM (SA) (Oct)
--
F: --
P: --
Euro Zone Sentix Investor Confidence Index (Dec)--
F: --
P: --
Canada Leading Index MoM (Nov)--
F: --
P: --
Canada National Economic Confidence Index--
F: --
P: --
U.S. Dallas Fed PCE Price Index YoY (Sept)--
F: --
P: --
U.S. 3-Year Note Auction Yield--
F: --
P: --
 U.K. BRC Overall Retail Sales YoY (Nov)
--
F: --
P: --
U.K. BRC Like-For-Like Retail Sales YoY (Nov)--
F: --
P: --
 Australia Overnight (Borrowing) Key Rate
--
F: --
P: --
RBA Rate Statement RBA Press Conference Germany Exports MoM (SA) (Oct)--
F: --
P: --
U.S. NFIB Small Business Optimism Index (SA) (Nov)--
F: --
P: --
Mexico Core CPI YoY (Nov)--
F: --
P: --
Mexico 12-Month Inflation (CPI) (Nov)--
F: --
P: --
Mexico PPI YoY (Nov)--
F: --
P: --

No matching data
Latest Views
Latest Views
Trending Topics
Top Columnists
Latest Update
White Label
Data API
Web Plug-ins
Affiliate Program
View All
No data
Japanese industrial production fell more than expected in August after a similar decline last month as U.S. trade tariffs weighed on exports, while retail sales dropped unexpectedly to their lowest in four years.
Japanese industrial production fell more than expected in August after a similar decline last month as U.S. trade tariffs weighed on exports, while retail sales dropped unexpectedly to their lowest in four years.
Industrial production fell 1.2% month-on-month in August, government data showed on Tuesday. The print was weaker than expectations for a 0.7% contraction, and held steady from a 1.2% decline in July.
Retail sales fell 1.1% year-on-year, marking their first decline since Feb 2022, and their biggest fall since Aug 2021. The print came in against expectations of a 1% rise, and reversed from a 0.4% rise in July.
The weakness comes despite confirmation of a new U.S.–Japan trade deal last month that lowered planned duties on Japanese cars and parts to a baseline 15%, down from initial proposals of 25%. The revised tariffs still represent a drag on automakers, with manufacturers seeing thinner margins and weaker U.S. demand.
The unexpected weakness in retail sales data signaled that Japanese private consumption, a key driver of the economy, remained subdued due to headwinds from sticky inflation and economic uncertainty.
Private spending has been a major driver of Japanese inflation in recent years, and was also a motivating factor for the Bank of Japan to hike interest rates.
The BOJ held its interest rates steady at 0.5% earlier this month, but two board members dissented, calling for a quarter-point hike, signaling the central bank’s hawkish tilt.
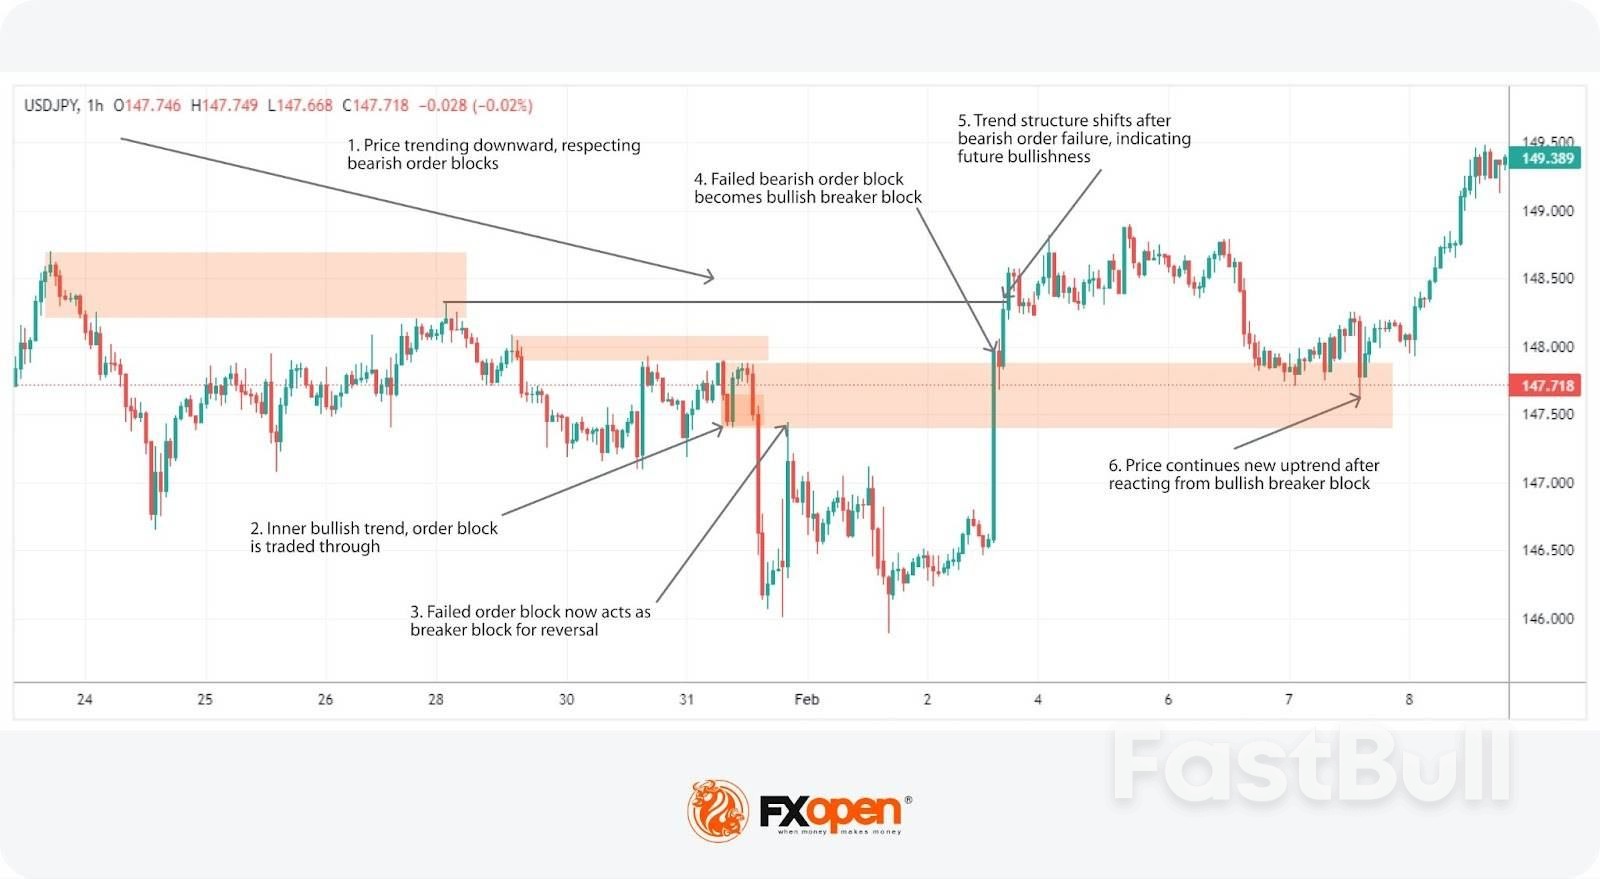
Order blocks and breaker blocks are key price action concepts that reflect how institutional participants place and manage their trades. While often overlooked by retail traders, these structures can offer valuable insights into market intent and potential turning points.This article explains what order blocks and breaker blocks are, how they differ, and how traders can use them in market analysis. With a practical approach and clear examples, you'll learn how to identify these patterns on the chart and integrate them into your trading strategy.
An order block, also known as a supply or demand zone, represents a significant area on the price chart where large market participants, such as banks or institutional traders, have placed substantial buy or sell orders. They’re crucial in understanding the flow and direction of an asset, as they often precede notable movements in price. Particularly in the realm of forex, where the magnitude of transactions can be immense, identifying these zones can provide traders with a strategic edge.
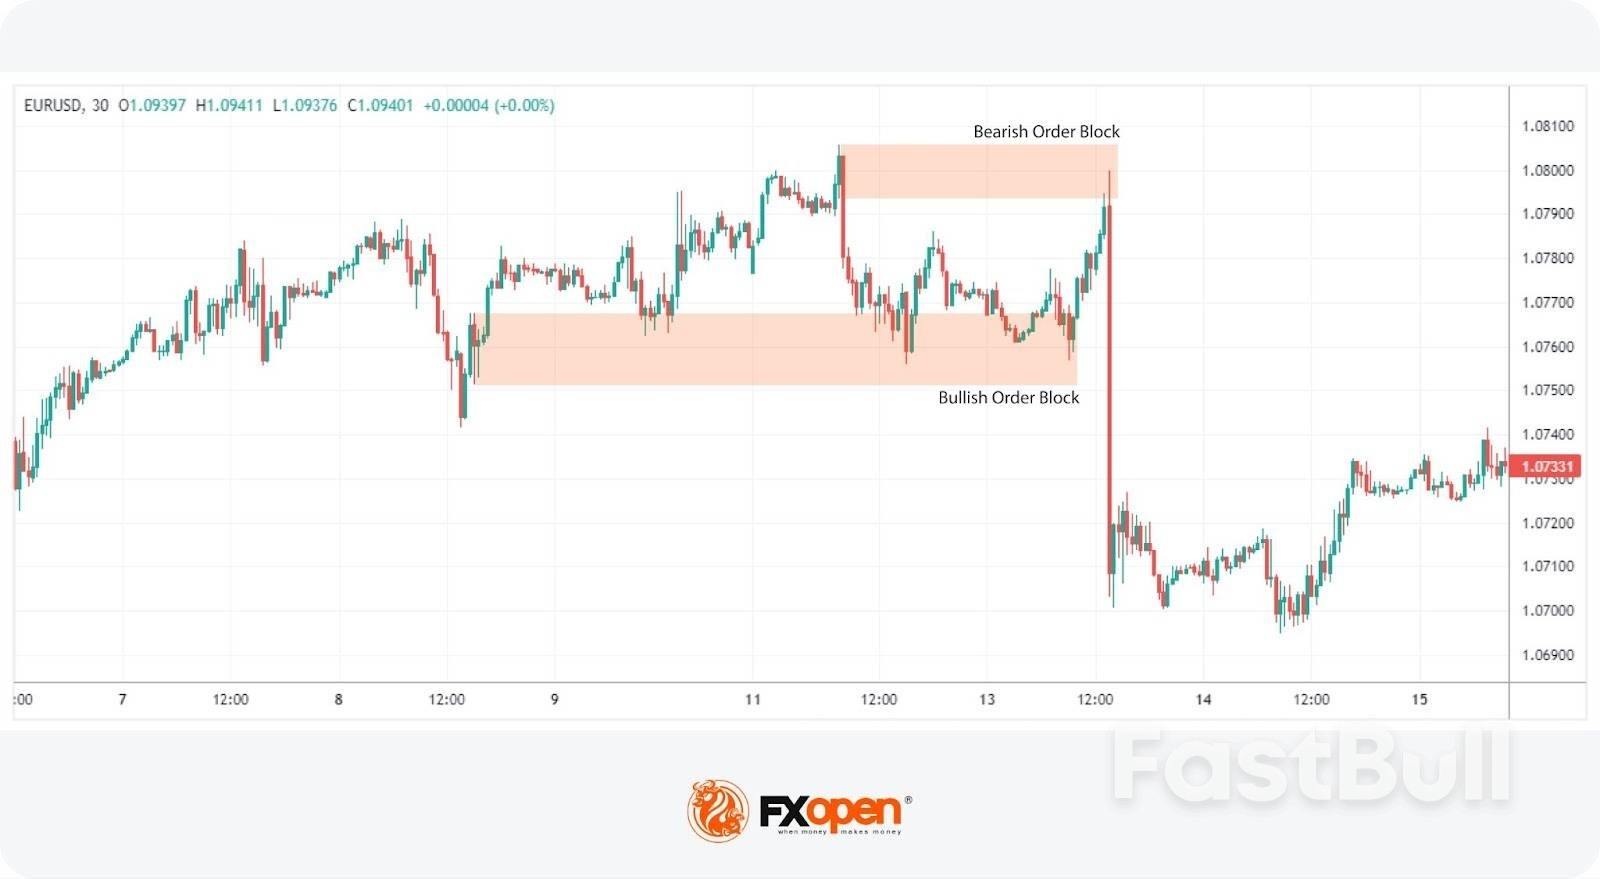
A bullish order block, or demand zone, is identified during a downward price movement and is the area where the last bearish candle before a substantial upward price movement occurs. This indicates that institutional buyers are stepping in, absorbing sell orders, and preparing to push the price higher. Traders eyeing bullish order blocks anticipate these areas as potential points of interest where price may find support, thus offering a strategic entry point for long positions.
Conversely, a bearish order block, or supply zone, is found during an upward price movement and is characterised by the area where the last bullish candle appears before a significant downward price shift. This suggests that institutional sellers are overwhelming buyers, likely leading to a decrease in price. Bearish order blocks signal potential resistance zones, presenting opportunities to enter short positions in anticipation of a downward price trajectory.
In both instances, they typically create an impulse move that breaks a nearby high or low to continue or start a given trend. When the market returns to these areas, they often prompt a reversal of the short-term trend and a continuation of a higher timeframe trend.
Order blocks in forex are particularly telling due to the high market liquidity and the sheer volume of trades. Recognising these areas allows traders to align their strategies with the likely actions of major institutional players, potentially leading to more informed and effective trade decisions.
These blocks work because they tap into the underlying dynamics of supply and demand, reflecting the actions of large institutional players whose trades can significantly impact price direction. They’re essentially snapshots of where significant buying or selling pressure has accumulated, offering clues to future price movements.
When a market approaches a supply or demand zone, the likelihood of a reaction—whether it's a continuation or reversal of the trend—increases because these levels are where institutional traders have previously shown interest, either by initiating large positions or placing take-profit orders.
Now, let’s take a closer look at how to identify and use order blocks for trading.
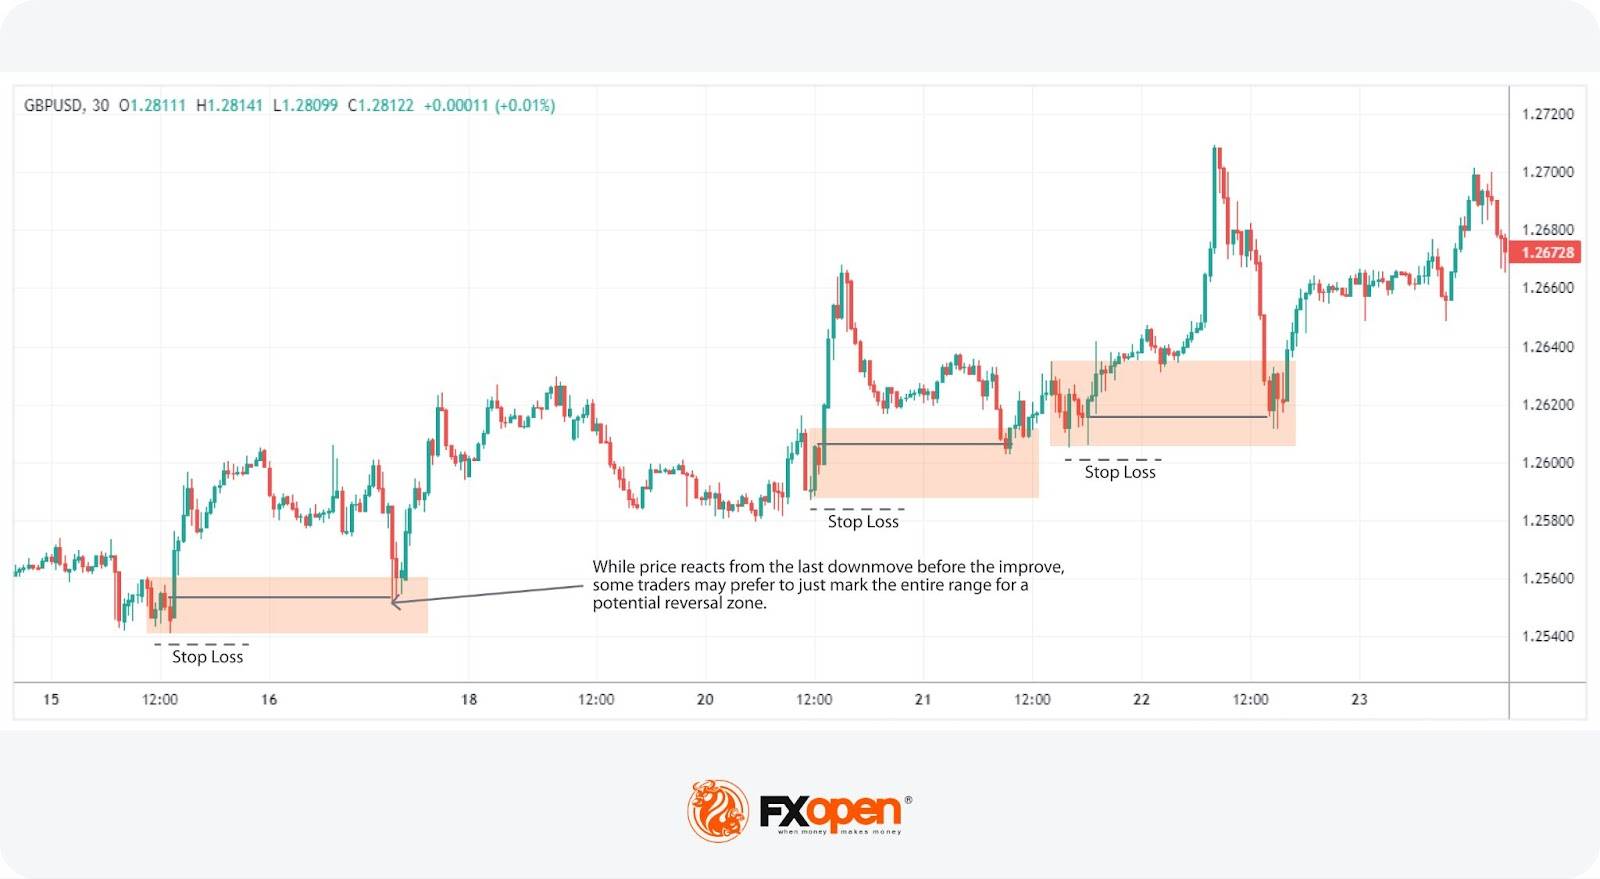
Traders often start by analysing historical price charts to locate order blocks. Typically, these are found where there was significant trading activity, often in the form of a consolidation, followed by a strong directional price move.A bullish order block is where the last bearish candle in a downtrend occurred before a sharp rise. Conversely, in a bearish order block, traders identify the last bullish candle before a significant fall.Note that order block candles visible on a higher timeframe tend to be more probable. Similarly, a small high-low range on a lower timeframe would appear as a single candlestick on a higher timeframe, meaning that the entire range can be plotted as a supply or demand zone.
Incorporating order blocks into a strategy involves observing how the price behaves as it approaches these marked areas. Traders typically watch for price reactions near these zones, using them as indicators of potential entry or exit points. For instance, a price bounce off a demand zone may signal a good opportunity to go long, anticipating upward momentum as institutional interest possibly resurfaces.
Traders might also combine these areas with indicators and other analysis tools, such as moving averages or Fibonacci retracements, to validate their signals. This multi-faceted approach helps in fine-tuning entry and exit strategies, potentially increasing the likelihood of effective trades.
As with any strategy, it's crucial to practise sound risk management when trading with order blocks. Traders often set stop-losses just outside the zone with the assumption that institutional players won’t let the market trade beyond this point. However, when these zones fail, they become known as breaker blocks.
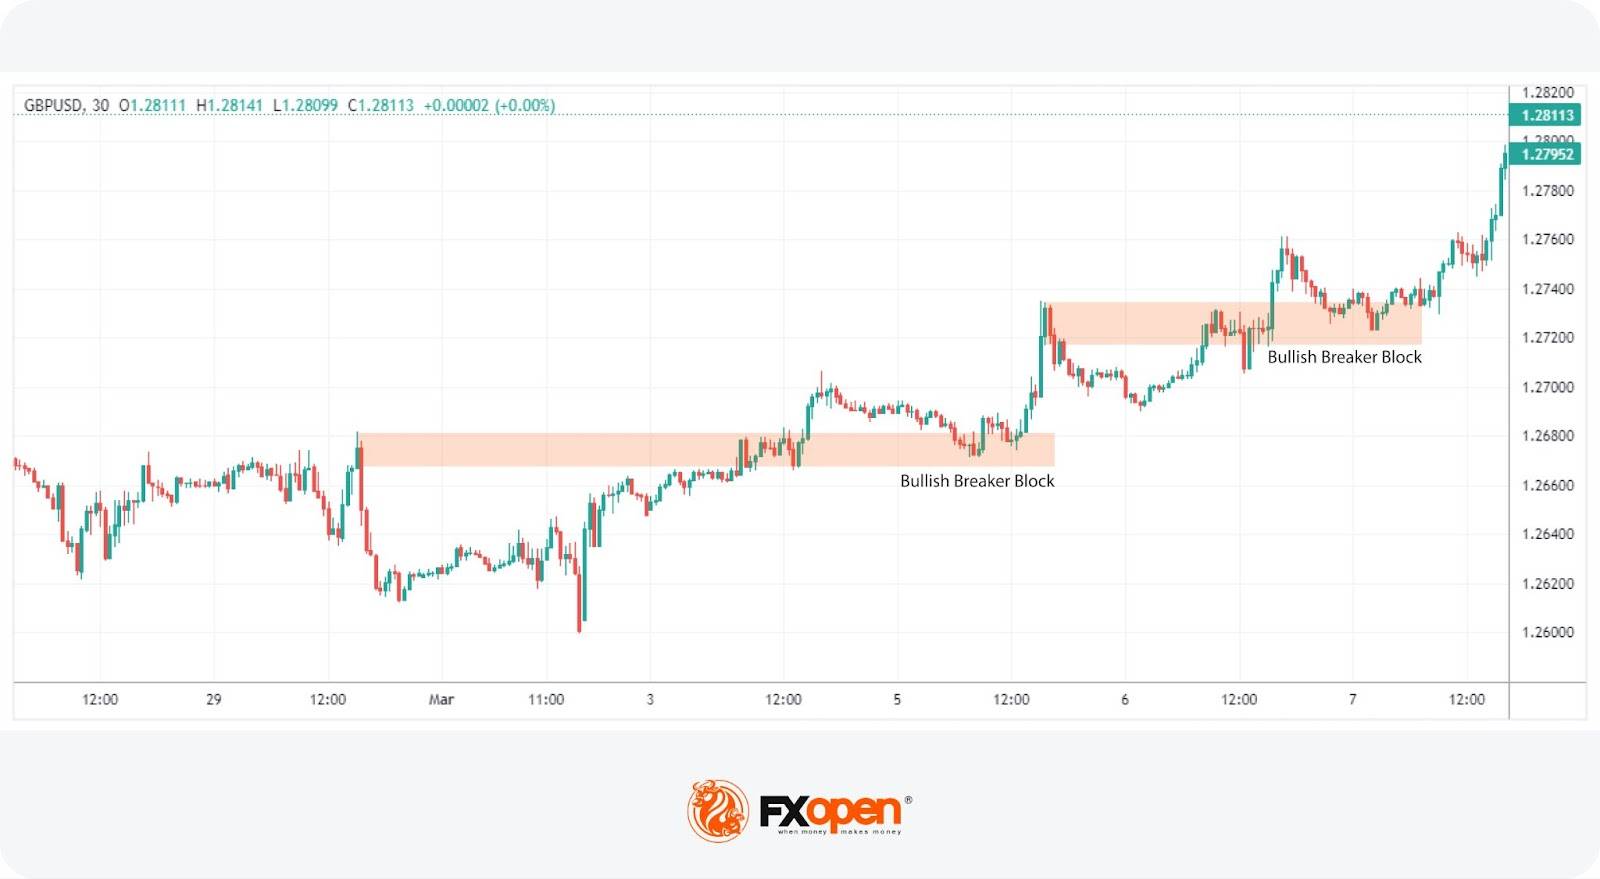
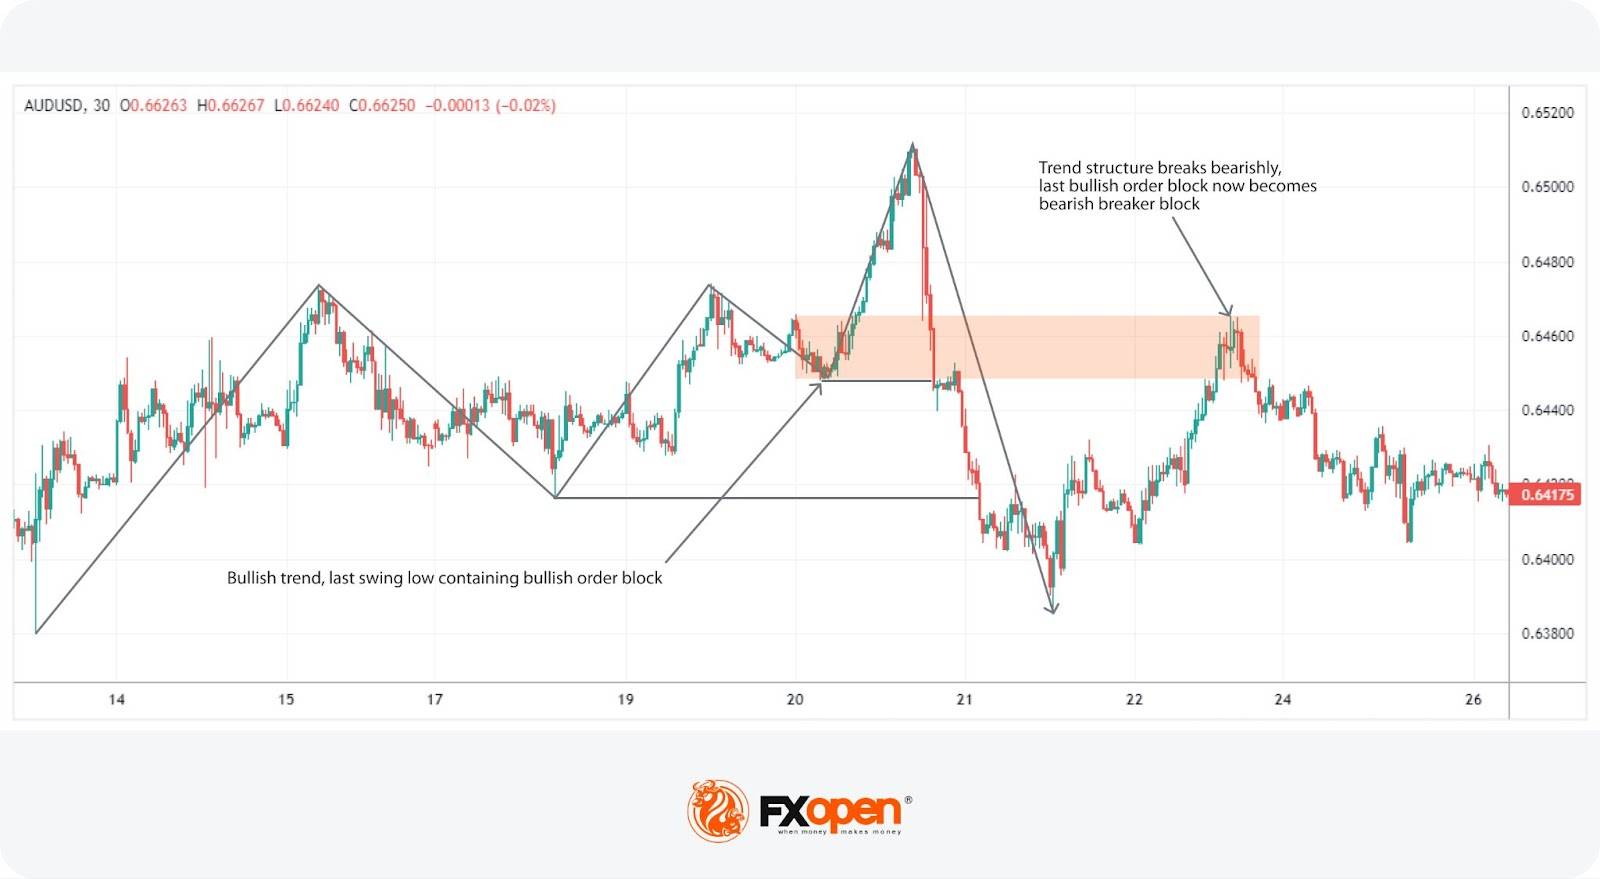
In the realm of forex, understanding the concept of breaker blocks can be crucial when it comes to identifying potential reversals and continuations in trends. Breaker blocks emerge from the failure of order blocks. When these supply or demand zones do not hold, and the market structure shifts, breaker blocks are formed, marking significant levels to watch.A bearish breaker block occurs after a bullish order block fails. This typically happens when there's an upward trend, and a certain level that was expected to support the market's rise instead gives way, leading to a sharp decline. This decline indicates that sellers have overcome the buyers, absorbing liquidity and shifting the sentiment from bullish to bearish.
Conversely, a bullish breaker block is formed from the failure of a bearish order block. In a downtrend, when a level that was expected to act as resistance is breached, and the price shoots up, it signifies that buyers have taken control, overpowering the sellers.In both scenarios, price often retraces to the failed zone before continuing the newly formed trend.
To harness the power of breakers, traders adeptly identify these pivotal points and integrate them into a coherent strategy.
The first step involves scrutinising price charts for significant reversals that follow the failure of established supply or demand zones. A bearish breaker block, for instance, would be marked by a sudden decline after a bullish trend fails to sustain, trading through a bullish order block, and vice versa.The most notable breaker blocks are often the order blocks that stand out visually or would need to stay intact if a given trend is to continue. When they fail, they can then be plotted as a valid horizontal level to look for a retracement before a potential move away.
Once identified, these zones can be strategically employed as markers for potential trade entries. For a bearish breaker, traders might consider short positions, anticipating further declines as price retests and rejects the previously failed support level. Conversely, a bullish breaker suggests a potential long position as the market may continue to rise, having breached a significant resistance.
Combining these two ideas offers a nuanced approach to forex, especially when integrating the concept of liquidity voids or fair value gaps. These gaps occur when the price makes an impulsive move away from an order block without retracing, potentially marking areas for future reversals. This strategy shines in trending assets, where the directional momentum aligns with the formation of these critical zones, offering potential entry and exit signals.
In a trending market, order blocks that prompt sharp price movements away can be key areas to mark for a trend reversal. These marked zones can indicate where significant buying or selling pressure originated, offering potential entry points. However, it's essential to recognise that in a ranging or consolidating market, they might not hold as expected.
When institutional interests shift, leading to the failure of an order block to act as support or resistance, this is where breaker blocks come into play, becoming a critical level to watch. Particularly after a sudden move, if a supply or demand zone ripe for reversal is now too far away to see an immediate retracement, the breaker serves as a strategic entry point ahead of a trend continuation.
Breaker blocks not only signal potential entry points but also help set market direction. The breach of an order block by price action indicates a strong likelihood that the asset will continue in that direction, underscoring a shift in institutional interest. When price trades through an order block, showing no signs of halting, it suggests a path for the trend, offering traders insight into the prevailing momentum.
While order and breaker blocks provide insightful strategies in navigating forex markets, they come with limitations that traders should be aware of:
FAQs
What Is an Order Block in Trading?
An order block refers to a price area on the chart where significant buy or sell orders were previously placed by large institutional traders. These zones are key to identifying potential support or resistance levels, providing insights into future price movements.
What Is a Breaker Block in Trading?
A breaker block is a concept that emerges when an order block fails, leading to a change in market structure. It signifies a pivotal point where the market shifts direction, offering traders opportunities to enter trades based on anticipated trend continuation.
How to Identify Order Blocks?
Order blocks can be identified by analysing price charts for areas where there was significant trading activity, followed by a strong directional movement. Traders look for the last bullish candle before a downturn for a bearish block, or the last bearish candle before an uptrend for a bullish block, indicating potential zones of interest for traders.
The U.S. Labor and Commerce departments said on Monday that their statistics agencies would halt economic data releases in the event of a partial government shutdown, including closely watched employment data for September, construction spending and possibly international trade data for August.
The employment report, crucial for decision-making by officials at the Federal Reserve, businesses and households, is scheduled for Friday. Government funding will expire at midnight on Tuesday unless Republicans and Democrats agree to a last-minute temporary spending deal.
The Labor Department identified the Bureau of Labor Statistics as among the key agencies whose activities would cease during a lapse in funding. President Donald Trump was due to meet with Republican and Democratic leaders on Monday.
While it would suspend some activities, the statistical agency said it would publish the August Metropolitan Area Employment and Unemployment report due on Wednesday.
Similarly, the Commerce Department said monthly economic indicators from the U.S. Census Bureau would not be available in the event of a government shutdown. The department's Bureau of Economic Analysis would cease most services.
The Census Bureau is scheduled to release U.S. construction spending data for August on Wednesday and manufacturers' shipments, inventories and orders for August on Thursday.
The two agencies are scheduled to release data on August international goods and services trade on October 7. A prolonged shutdown could impact the Bureau of Economic Analysis' initial estimate of third-quarter gross domestic product due on October 30.
BLS also said a prolonged shutdown could delay the release of other data.
"Once funding is restored, BLS will resume normal operations and notify the public of any changes to the news release schedule on the BLS release calendar," the agency said in a statement.
It was not clear whether the weekly jobless claims report would continue to be published. The data is collected by states, which run the unemployment insurance programs, but the BLS does the seasonal adjustment.
Possible delays publishing the employment report would come at a time when concerns are growing over the quality of government-produced economic data, long viewed as the gold standard.
The BLS warned "a reduction in quality of data collected might impact the quality of future estimates produced."
The BLS has suffered years of underfunding under both Republican and Democratic administrations. That situation has been worsened by mass firings, voluntary resignations, early retirements and hiring freezes, which are part of an unprecedented campaign by the Trump administration to drastically reduce the size of government.
Response rates for the employment report have declined and the agency has suspended data collection for portions of the consumer price index in some areas across the country.
Should September's CPI report be delayed, that could leave the Social Security Administration unable to make its annual Cost of Living Adjustment announcement, which retirees depend on to plan their budgets.
The White House on Monday released a 20-point plan by President Donald Trump to end the war in Gaza between Israel and Hamas.
The release came minutes before Trump began speaking at the White House about the proposal, which has not been agreed to by Hamas.
Trump was joined by Israeli Prime Minister Benjamin Netanyahu.
Trump said that Israel, and other nations have accepted the outline he detailed.
"If accepted by Hamas, this proposal calls for the release of all remaining hostages, immediately, but in no case more than 72 hours," Trump said.
"I hope that we're going to have a deal for peace, and if Hamas rejects the deal, which is always possible, they're the only one left," Trump said.
"Everyone else has accepted it. But I have a feeling that we're going to have a positive answer. But if not, as you know Bibi you'd have our full backing to do what you would have to do."

728 RM B 7/F GEE LOK IND BLDG NO 34 HUNG TO RD KWUN TONG KLN HONG KONG


White Label
Data API
Web Plug-ins
Poster Maker
Affiliate Program
The risk of loss in trading financial instruments such as stocks, FX, commodities, futures, bonds, ETFs and crypto can be substantial. You may sustain a total loss of the funds that you deposit with your broker. Therefore, you should carefully consider whether such trading is suitable for you in light of your circumstances and financial resources.
No decision to invest should be made without thoroughly conducting due diligence by yourself or consulting with your financial advisors. Our web content might not suit you since we don't know your financial conditions and investment needs. Our financial information might have latency or contain inaccuracy, so you should be fully responsible for any of your trading and investment decisions. The company will not be responsible for your capital loss.
Without getting permission from the website, you are not allowed to copy the website's graphics, texts, or trademarks. Intellectual property rights in the content or data incorporated into this website belong to its providers and exchange merchants.
Not Logged In
Log in to access more features

FastBull Membership
Not yet
Purchase


Log In
Sign Up


