• Trade
  • Markets
  • Copy
  • Contests
  • News
  • 24/7
  • Calendar
  • Q&A
  • Chats
Trending
Screeners
SYMBOL
LAST
BID
ASK
HIGH
LOW
NET CHG.
%CHG.
SPREAD
SPX
S&P 500 Index
6841.00
6841.00
6841.00
6878.28
6836.96
-29.40
-0.43%
--
DJI
Dow Jones Industrial Average
47713.79
47713.79
47713.79
47971.51
47709.38
-241.19
-0.50%
--
IXIC
NASDAQ Composite Index
23507.35
23507.35
23507.35
23698.93
23492.15
-70.77
-0.30%
--
USDX
US Dollar Index
99.130
99.210
99.130
99.160
98.730
+0.180
+ 0.18%
--
EURUSD
Euro / US Dollar
1.16216
1.16223
1.16216
1.16717
1.16162
-0.00210
-0.18%
--
GBPUSD
Pound Sterling / US Dollar
1.33113
1.33124
1.33113
1.33462
1.33053
-0.00199
-0.15%
--
XAUUSD
Gold / US Dollar
4187.28
4187.69
4187.28
4218.85
4175.92
-10.63
-0.25%
--
WTI
Light Sweet Crude Oil
58.917
58.947
58.917
60.084
58.837
-0.892
-1.49%
--

Community Accounts

Signal Accounts
--
Profit Accounts
--
Loss Accounts
--
View More

Become a signal provider

Sell trading signals to earn additional income

View More

Guide to Copy Trading

Get started with ease and confidence

View More

Signal Accounts for Members

All Signal Accounts

Best Return
  • Best Return
  • Best P/L
  • Best MDD
Past 1W
  • Past 1W
  • Past 1M
  • Past 1Y

All Contests

  • All
  • Trump Updates
  • Recommend
  • Stocks
  • Cryptocurrencies
  • Central Banks
  • Featured News
Top News Only
Share

[Ray Dalio: The Middle East Is Rapidly Becoming One Of The World's Most Influential AI Hubs] Bridgewater Associates Founder Ray Dalio Stated That The Middle East (particularly The UAE And Saudi Arabia) Is Rapidly Emerging As A Powerful Global AI Hub, Comparable To Silicon Valley, Due To The Region's Combination Of Massive Capital And Global Talent. Dalio Believes The Gulf Region's Transformation Is The Result Of Well-thought-out National Strategies And Long-term Planning, Noting That The UAE's Outstanding Performance In Leadership, Stability, And Quality Of Life Has Made It A "Silicon Valley For Capitalists." While He Believes The AI ​​rebound Is In Bubble Territory, He Advises Investors Not To Rush Out But Rather To Look For Catalysts That Could Cause The Bubble To "burst," Such As Monetary Tightening Or Forced Wealth Selling

Share

French President Emmanuel Macron Met With The Croatian Prime Minister At The Élysée Palace

Share

In The Past 24 Hours, The Marketvector Digital Asset 100 Small Cap Index Rose 1.96%, Currently At 4135.44 Points. The Sydney Market Initially Exhibited An N-shaped Pattern, Hitting A Daily Low Of 3988.39 Points At 06:08 Beijing Time, Before Steadily Rising To A Daily High Of 4206.06 Points At 17:07, Subsequently Stabilizing At This High Level

Share

[Sovereign Bond Yields In France, Italy, Spain, And Greece Rose By More Than 7 Basis Points, Raising Concerns That The ECB's Interest Rate Outlook May Push Up Financing Costs] In Late European Trading On Monday (December 8), The Yield On French 10-year Bonds Rose 5.8 Basis Points To 3.581%. The Yield On Italian 10-year Bonds Rose 7.4 Basis Points To 3.559%. The Yield On Spanish 10-year Bonds Rose 7.0 Basis Points To 3.332%. The Yield On Greek 10-year Bonds Rose 7.1 Basis Points To 3.466%

Share

Oil Falls 1% Amid Ongoing Ukraine Talks, Ahead Of Expected US Interest Rate Cut

Share

Azeri Btc Crude Oil Exports From Ceyhan Port Set At 16.2 Million Barrels In January Versus 17.0 Million In December, Schedule Shows

Share

USA - Greenland Joint Committee Statement: The United States And Greenland Look Forward To Building On Momentum In The Year Ahead And Strengthening Ties That Support A Secure And Prosperous Arctic Region

Share

MSCI Nordic Countries Index Fell 0.4% To 356.64 Points. Among The Ten Sectors, The Nordic Healthcare Sector Saw The Largest Decline. Novo Nordisk, A Heavyweight Stock, Closed Down 3.4%, Leading The Losses Among Nordic Stocks

Share

France's CAC 40 Down 0.2%, Spain's IBEX Up 0.1%

Share

Europe's STOXX Index Up 0.1%, Euro Zone Blue Chips Index Flat

Share

Germany's DAX 30 Index Closed Up 0.08% At 24,044.88 Points. France's Stock Index Closed Down 0.19%, Italy's Stock Index Closed Down 0.13% With Its Banking Index Up 0.33%, And The UK's Stock Index Closed Down 0.32%

Share

The STOXX Europe 600 Index Closed Down 0.12% At 578.06 Points. The Eurozone STOXX 50 Index Closed Down 0.04% At 5721.56 Points. The FTSE Eurotop 300 Index Closed Down 0.05% At 2304.93 Points

Share

Israeli Prime Minister Netanyahu: Hamas Has Violated The Ceasefire Agreement, And We Will Never Allow Its Members To Re-arm Themselves And Threaten US

Share

Israeli Prime Minister Netanyahu: We Are Working To Return The Body Of Another Detainee From The Gaza Strip

Share

Iraq's West Qurna 2 Oil Field Will Increase Oil Production Beyond Normal Levels To Compensate For The Production Stoppage Caused By The Trump Administration's Sanctions Against Russia

Share

Israeli Prime Minister Netanyahu: We Are Close To Completing The First Phase Of Trump’s Plan And Will Now Focus On Disarming Gaza And Seizing Hamas Weapons

Share

Moody's Affirmed Burberry's Long-term Rating Of Baa3 And Revised Its Outlook (from Negative) To Stable

Share

The Trump Administration Supports Iraq's Plan To Transfer Russian Oil Company Lukoil Pjsc's Assets In The West Qurna 2 Oil Field To An American Company

Share

JMA: Tsunami Of 70 Centimetres Observed In Japan's Kuji Port In Iwate Prefecture

Share

The U.S. Bureau Of Labor Statistics Plans To Release A Press Release On January 15, 2026, For November 2025, Along With Data For October

TIME
ACT
FCST
PREV
France Trade Balance (SA) (Oct)

A:--

F: --

P: --
Euro Zone Employment YoY (SA) (Q3)

A:--

F: --

P: --
Canada Part-Time Employment (SA) (Nov)

A:--

F: --

P: --

Canada Unemployment Rate (SA) (Nov)

A:--

F: --

P: --

Canada Full-time Employment (SA) (Nov)

A:--

F: --

P: --

Canada Labor Force Participation Rate (SA) (Nov)

A:--

F: --

P: --

Canada Employment (SA) (Nov)

A:--

F: --

P: --

U.S. PCE Price Index MoM (Sept)

A:--

F: --

P: --

U.S. Personal Income MoM (Sept)

A:--

F: --

P: --

U.S. Core PCE Price Index MoM (Sept)

A:--

F: --

P: --

U.S. PCE Price Index YoY (SA) (Sept)

A:--

F: --

P: --

U.S. Core PCE Price Index YoY (Sept)

A:--

F: --

P: --

U.S. Personal Outlays MoM (SA) (Sept)

A:--

F: --

P: --
U.S. 5-10 Year-Ahead Inflation Expectations (Dec)

A:--

F: --

P: --

U.S. Real Personal Consumption Expenditures MoM (Sept)

A:--

F: --

P: --
U.S. Weekly Total Rig Count

A:--

F: --

P: --

U.S. Weekly Total Oil Rig Count

A:--

F: --

P: --

U.S. Consumer Credit (SA) (Oct)

A:--

F: --

P: --
China, Mainland Foreign Exchange Reserves (Nov)

A:--

F: --

P: --

Japan Trade Balance (Oct)

A:--

F: --

P: --

Japan Nominal GDP Revised QoQ (Q3)

A:--

F: --

P: --

China, Mainland Imports YoY (CNH) (Nov)

A:--

F: --

P: --

China, Mainland Exports (Nov)

A:--

F: --

P: --

China, Mainland Imports (CNH) (Nov)

A:--

F: --

P: --

China, Mainland Trade Balance (CNH) (Nov)

A:--

F: --

P: --

China, Mainland Exports YoY (USD) (Nov)

A:--

F: --

P: --

China, Mainland Imports YoY (USD) (Nov)

A:--

F: --

P: --

Germany Industrial Output MoM (SA) (Oct)

A:--

F: --

P: --
Euro Zone Sentix Investor Confidence Index (Dec)

A:--

F: --

P: --

Canada National Economic Confidence Index

A:--

F: --

P: --

U.K. BRC Like-For-Like Retail Sales YoY (Nov)

--

F: --

P: --

U.K. BRC Overall Retail Sales YoY (Nov)

--

F: --

P: --

Australia Overnight (Borrowing) Key Rate

--

F: --

P: --

RBA Rate Statement
RBA Press Conference
Germany Exports MoM (SA) (Oct)

--

F: --

P: --

U.S. NFIB Small Business Optimism Index (SA) (Nov)

--

F: --

P: --

Mexico 12-Month Inflation (CPI) (Nov)

--

F: --

P: --

Mexico Core CPI YoY (Nov)

--

F: --

P: --

Mexico PPI YoY (Nov)

--

F: --

P: --

U.S. Weekly Redbook Index YoY

--

F: --

P: --

U.S. JOLTS Job Openings (SA) (Oct)

--

F: --

P: --

China, Mainland M1 Money Supply YoY (Nov)

--

F: --

P: --

China, Mainland M0 Money Supply YoY (Nov)

--

F: --

P: --

China, Mainland M2 Money Supply YoY (Nov)

--

F: --

P: --

U.S. EIA Short-Term Crude Production Forecast For The Year (Dec)

--

F: --

P: --

U.S. EIA Natural Gas Production Forecast For The Next Year (Dec)

--

F: --

P: --

U.S. EIA Short-Term Crude Production Forecast For The Next Year (Dec)

--

F: --

P: --

EIA Monthly Short-Term Energy Outlook
U.S. API Weekly Gasoline Stocks

--

F: --

P: --

U.S. API Weekly Cushing Crude Oil Stocks

--

F: --

P: --

U.S. API Weekly Crude Oil Stocks

--

F: --

P: --

U.S. API Weekly Refined Oil Stocks

--

F: --

P: --

South Korea Unemployment Rate (SA) (Nov)

--

F: --

P: --

Japan Reuters Tankan Non-Manufacturers Index (Dec)

--

F: --

P: --

Japan Reuters Tankan Manufacturers Index (Dec)

--

F: --

P: --

Japan Domestic Enterprise Commodity Price Index MoM (Nov)

--

F: --

P: --

Japan Domestic Enterprise Commodity Price Index YoY (Nov)

--

F: --

P: --

China, Mainland PPI YoY (Nov)

--

F: --

P: --

China, Mainland CPI MoM (Nov)

--

F: --

P: --

Q&A with Experts
    • All
    • Chatrooms
    • Groups
    • Friends
    Connecting
    .
    .
    .
    Type here...
    Add Symbol or Code

      No matching data

      All
      Trump Updates
      Recommend
      Stocks
      Cryptocurrencies
      Central Banks
      Featured News
      • All
      • Russia-Ukraine Conflict
      • Middle East Flashpoint
      • All
      • Russia-Ukraine Conflict
      • Middle East Flashpoint
      Search
      Products

      Charts Free Forever

      Chats Q&A with Experts
      Screeners Economic Calendar Data Tools
      Membership Features
      Data Warehouse Market Trends Institutional Data Policy Rates Macro

      Market Trends

      Market Sentiment Order Book Forex Correlations

      Top Indicators

      Charts Free Forever
      Markets

      News

      News Analysis 24/7 Columns Education
      From Institutions From Analysts
      Topics Columnists

      Latest Views

      Latest Views

      Trending Topics

      Top Columnists

      Latest Update

      Signals

      Copy Rankings Latest Signals Become a signal provider AI Rating
      Contests
      Brokers

      Overview Brokers Assessment Rankings Regulators News Claims
      Broker listing Forex Brokers Comparison Tool Live Spread Comparison Scam
      Q&A Complaint Scam Alert Videos Tips to Detect Scam
      More

      Business
      Events
      Careers About Us Advertising Help Center

      White Label

      Data API

      Web Plug-ins

      Affiliate Program

      Awards Institution Evaluation IB Seminar Salon Event Exhibition
      Vietnam Thailand Singapore Dubai
      Fans Party Investment Sharing Session
      FastBull Summit BrokersView Expo
      Recent Searches
        Top Searches
          Markets
          News
          Analysis
          User
          24/7
          Economic Calendar
          Education
          Data
          • Names
          • Latest
          • Prev

          View All

          No data

          Scan to Download

          Faster Charts, Chat Faster!

          Download App
          English
          • English
          • Español
          • العربية
          • Bahasa Indonesia
          • Bahasa Melayu
          • Tiếng Việt
          • ภาษาไทย
          • Français
          • Italiano
          • Türkçe
          • Русский язык
          • 简中
          • 繁中
          Open Account
          Search
          Products
          Charts Free Forever
          Markets
          News
          Signals

          Copy Rankings Latest Signals Become a signal provider AI Rating
          Contests
          Brokers

          Overview Brokers Assessment Rankings Regulators News Claims
          Broker listing Forex Brokers Comparison Tool Live Spread Comparison Scam
          Q&A Complaint Scam Alert Videos Tips to Detect Scam
          More

          Business
          Events
          Careers About Us Advertising Help Center

          White Label

          Data API

          Web Plug-ins

          Affiliate Program

          Awards Institution Evaluation IB Seminar Salon Event Exhibition
          Vietnam Thailand Singapore Dubai
          Fans Party Investment Sharing Session
          FastBull Summit BrokersView Expo

          How China And Trump’s U.S. Tariffs Are Reshaping Global Trade Patterns

          Glendon

          Forex

          Economic

          Summary:

          China once stood at the center of global supply chains. Yet its role in U.S. trade has been shrinking fast. A decade ago, nearly 90% of supplier volume came from China, Hong Kong, and Korea.

          China once stood at the center of global supply chains. Yet its role in U.S. trade has been shrinking fast. A decade ago, nearly 90% of supplier volume came from China, Hong Kong, and Korea. Today that share sits closer to 50%. Trump's first tariff push triggered the shift, and companies have kept moving ever since. Now trade flows look different, and the numbers tell a clear story.

          Chinese exports to the U.S. dropped almost 29% in November alone. This marked the eighth straight month of double-digit declines. Even a recent trade truce has not reversed the fall. U.S. tariffs remain much higher on Chinese goods than on many other countries, so firms keep routing shipments through third markets. As a result, China sells less directly to America, even while selling more to Southeast Asia and Europe.

          Trade Corridors Move Beyond China

          Trump's tariff strategy pushed companies to search for new manufacturing hubs. They found them in Vietnam, Indonesia, Thailand, India, and Malaysia. Together these countries now take a growing share of work once done in China. Wells Fargo data shows supplier diversification nearly doubled after the first tariff wave. Today the shift has reached a tipping point.

          China's exports to South Asia have jumped sharply. For example, exports to Indonesia rose over 29% this year, while shipments to Vietnam and India also surged. But this growth masks the broader trend: more goods now move through Asia before reaching the U.S. Meanwhile, Vietnam's shipments to America are up 23%, and Thailand's rose more than 9%. Each increase shows how global trade routes keep reshaping as firms avoid U.S. tariffs tied to China. These corridors may become a permanent part of the new trade landscape.

          U.S. Tariffs and Cash Strains Hit Importers

          The tariff fight has not only shifted trade. It has strained U.S. corporate finances. Companies rushed to front-load inventories early in 2025 before Trump's tariff expansion took effect. Now that stockpile is nearly gone. As new shipments face higher levies, cash flow tightens.

          Many importers can no longer negotiate better prices because their industries run on thin margins. Retail, apparel, and generic pharmaceuticals face the hardest squeeze. As a result, firms seek new financing tools to manage rising costs. Banks such as HSBC report a sharp jump in demand for trade finance. With tariffs rising from an average of 1.5% to double digits, cash has become king. Companies now rethink payment terms and supply chain strategies as they brace for more volatility.

          China's Export Pivot and Domestic Pressures

          China is adjusting too—quickly and strategically. Though exports to the U.S. keep falling, China's overall outbound shipments grew nearly 6% in November. Strong demand from ASEAN nations and Europe now offsets American weakness. China also increased shipments of critical minerals such as rare earths, signaling its intent to stay central to global industry.

          However, domestic challenges remain. Factory activity shrank for the eighth straight month. Imports rose only slightly, showing weak consumer demand at home. Policymakers are preparing new stimulus measures to stabilize growth around 5%. They may ease rates, widen fiscal deficits, and support struggling sectors like housing. Moreover, officials aim to boost household spending, especially as the yuan strengthens. A stronger currency lowers import costs and could help shift China away from its heavy export dependence—a long-term goal Beijing now treats as urgent.

          Markets React as Trade Realigns

          Markets across Asia reflect these shifting currents. Investors are parsing every hint from China's trade data and every move by the Trump administration. In recent days, China's stronger-than-expected export numbers lifted mainland markets. Yet Hong Kong's Hang Seng slipped, showing uneven confidence. Japan's revised GDP figures added further uncertainty, while Australia awaited a steady hand from its central bank.

          U.S. markets, however, appear calmer. Major indexes posted gains as investors weighed both domestic and global data. Still, the trade story looms over every outlook. China's slowdown in U.S.-bound shipments, the rise of new manufacturing hubs, and Trump's tariff path all shape business expectations. Global supply chains no longer revolve around one country, and companies know the map will keep changing.

          In this new environment, China and the U.S. remain tied together—but through a trade web that looks far less direct than before. The next moves from Washington and Beijing will decide whether this transformation accelerates or stabilizes. For now, the world adapts, one container at a time.

          Source: CryptoSlate

          To stay updated on all economic events of today, please check out our Economic calendar
          Risk Warnings and Disclaimers
          You understand and acknowledge that there is a high degree of risk involved in trading. Following any strategies or investment methods may lead to potential losses. The content on the site is provided by our contributors and analysts for information purposes only. You are solely responsible for determining whether any trading assets, securities, strategy, or any other product is suitable for investing based on your own investment objectives and financial situation.
          Add to Favorites
          Share

          Russian LNG Plant In Baltics Sends First Sanctioned Gas To China

          Samantha Luan

          Forex

          Commodity

          Economic

          A Russian liquefied natural gas export facility delivered its first shipment to China since being sanctioned by the US in January, the latest sign of increased energy cooperation between Beijing and Moscow.

          The Valera vessel, which loaded a shipment from Gazprom PJSC's Portovaya facility on the Baltic Sea in October, arrived at the Beihei import terminal in southern China on Monday, ship data compiled by Bloomberg shows. Both Valera and Portovaya were sanctioned by Joe Biden's administration to thwart Russia's plans to boost LNG exports.

          China, which doesn't recognize the unilateral sanctions, has increasingly bought blacklisted Russian gas over the last few months, ratcheting up energy ties between the two countries. Beijing has also ignored a broader push by US President Donald Trump to halt sales of Russian oil, which will likely be a key part of trade negotiations between Washington and New Delhi this week.

          Russia has two relatively small LNG export facilities on the Baltic Sea, with the Novatek PJSC-led Vysotsk plant also blacklisted by the US. Another sanctioned Russian plant, the Arctic LNG 2 site in Siberia, started delivering fuel to Beihai in late August.

          In mid-October, satellite images showed a tanker that loaded at Portovaya transferring fuel into another vessel registered to a Hong Kong-based company near Malaysia. That ship, known as CCH Gas, has been sending out false location signals, and was spotted by satellites near China last month. It isn't clear where it is currently located.

          Source: Bloomberg Europe

          To stay updated on all economic events of today, please check out our Economic calendar
          Risk Warnings and Disclaimers
          You understand and acknowledge that there is a high degree of risk involved in trading. Following any strategies or investment methods may lead to potential losses. The content on the site is provided by our contributors and analysts for information purposes only. You are solely responsible for determining whether any trading assets, securities, strategy, or any other product is suitable for investing based on your own investment objectives and financial situation.
          Add to Favorites
          Share

          Bond Yields Are Stubbornly High in Face of Fed Rate Cuts

          Michelle

          Forex

          Economic

          Markets are betting overwhelmingly that Fed policymakers will cut interest rates this week for a third straight meeting. Yet the bond market's reaction to those moves has been highly unusual.

          Treasury yields are climbing even as the central bank lowers rates. By some measures, a disconnect like this hasn't been seen since the 1990s.

          What the divergence indicates is a matter of heated debate. Opinions are all over the place, from the bullish (a sign of confidence that recession will be averted) to the more neutral (a return to pre-2008 market norms) to the favorite narrative of so-called bond vigilantes (investors are losing confidence the US will rein in the constantly swelling national debt).

          But one thing is clear: The bond market isn't buying Donald Trump's idea that faster rate cuts will send bond yields sliding down and, in turn, slash the rates on mortgages, credit cards and other types of loans.

          With Trump soon able to replace Chair Jerome Powell with his own nominee, there's also the risk that the Fed squanders its credibility by caving to political pressure to ease policy more aggressively — which could backfire by fanning already elevated inflation and pushing yields higher.

          "Trump 2.0 is all about getting long-term yields down," said Steven Barrow, head of G10 strategy at Standard Bank in London. "Putting a political figure at the Fed will not get bond yields down."

          The Fed started pulling its benchmark rate down in September 2024 and has since cut it by 1.5 percentage points. Traders see another quarter point cut Wednesday and are pricing in two more such moves next year, which would bring its rate to around 3%.

          Yet Treasury yields haven't come down at all. Ten-year yields have risen nearly half a percentage point to 4.1% since the Fed started easing policy and 30-year yields are up over 0.8 percentage point. —Ye Xie and Michael MacKenzie

          Fed Chair Jerome Powell is expected to push through another quarter-point interest-rate cut this week despite unease among fellow policymakers that inflation remains too high. Elsewhere, central bank decisions from Australia to Switzerland to Brazil will draw attention from investors.

          Source: Bloomberg Europe

          To stay updated on all economic events of today, please check out our Economic calendar
          Risk Warnings and Disclaimers
          You understand and acknowledge that there is a high degree of risk involved in trading. Following any strategies or investment methods may lead to potential losses. The content on the site is provided by our contributors and analysts for information purposes only. You are solely responsible for determining whether any trading assets, securities, strategy, or any other product is suitable for investing based on your own investment objectives and financial situation.
          Add to Favorites
          Share

          Bitcoin Faces Key Fibonacci Support Test Amid Decline Warnings

          Glendon

          Cryptocurrency

          Bitcoin is testing a key Fibonacci retracement support level, raising concerns of a potential drop to $76,000 if the level breaks, according to analysts monitoring market conditions.

          The implications are significant for Bitcoin and related large-cap cryptocurrencies due to correlation, potentially affecting broader market conditions and investor sentiment.

          Bitcoin is currently trading near a key Fibonacci retracement support as analysts warn of potential declines. Traders closely watch this technical level, which they say could lead to BTC nearing its April 2025 lows around $76,000 if it breaks down.

          Key market figures include Bitcoin spot and derivatives traders on major platforms like Binance and CME. Daan Crypto Trades specifically highlights the 0.382 Fibonacci retracement zone as crucial, with a potential breakdown towards $76,000 if it fails.

          The immediate concern is heightened selling pressure if Bitcoin loses its support level, further propelled by low weekend trading volumes. Market watchers note this could trigger a cascade of liquidations due to significant leveraged positions. Concerns extend to ETF outflows and reduced institutional demand, which are crucial factors influencing whether the current Fibonacci support will hold or break, potentially impacting broader market sentiment and risk appetites.

          Daan Crypto Trades, Crypto Derivatives Trader, Twitter/X – "The 0.382 Fibonacci retracement zone is the line bulls must defend, and a breakdown could send BTC back to April levels near $76,000": source

          Besides Bitcoin, assets like Ethereum and Chainlink could experience correlated impacts due to market sentiment. Analysts observe support in the $83–84k band, with risks rising if Bitcoin falls below the 0.382 Fibonacci level. With the potential for accelerated bearish momentum, tracking on-chain metrics offers insights. Historical trends indicate that failure to maintain key support levels often results in swift moves to subsequent Fibonacci bands, intensified by leverage and liquidity dynamics.

          Source: CryptoSlate

          Risk Warnings and Disclaimers
          You understand and acknowledge that there is a high degree of risk involved in trading. Following any strategies or investment methods may lead to potential losses. The content on the site is provided by our contributors and analysts for information purposes only. You are solely responsible for determining whether any trading assets, securities, strategy, or any other product is suitable for investing based on your own investment objectives and financial situation.
          Add to Favorites
          Share

          Money Supply Growth Surges To Multi-Year High As The Fed Loosens Policy

          Winkelmann

          Forex

          Economic

          In recent months, Federal Reserve officials have repeatedly referred to monetary policy as restrictive. In September, Jerome Powell said policy was "clearly restrictive," and in November, New York Fed President John Williams stated "I still view the current monetary policy level as moderately tight..."

          Well, it may be that current policy is "restrictive" compared to, say, the policies of Bernanke and Yellen. But recent data on the money supply suggests that the money supply in recent months is finding plenty of room to increase rapidly, in spite of what Fed officials say.

          For example, the money supply has increased every month for the past four months, and as some of the highest rates we've seen in years. Moreover, when measured year-over-year, the money supply has accelerated over the past three months and is now at the highest rate of growth seen in 40 months—or since July of 2022.

          While the money supply largely flatlined through much of the mid-2025, growth has clearly accelerated since August of this year.

          During October, year-over-year growth in the money supply was at 4.76 percent. That's up from September year-over-year increase of 4.06 percent. Money supply growth is also up sizably compared to October of last year when year-over-year growth was 1.27 percent.

          In October, the total money supply again rose above $20 trillion for the first time since January of 2023, and grew by half a trillion dollars from August to October.

          In month-to-month growth, August, September, and October all posted some of the largest growth rates we've seen since 2022, rising 1.18 percent, 1.4 percent, and 1.14 percent, respectively. topping off four months of growth.

          The money supply metric used here—the "true," or Rothbard-Salerno, money supply measure (TMS)—is the metric developed by Murray Rothbard and Joseph Salerno, and is designed to provide a better measure of money supply fluctuations than M2. (The Mises Institute now offers regular updates on this metric and its growth.)

          Historically, M2 growth rates have often followed a similar course to TMS growth rates, but M2 has even outpaced TMS growth in eleven of the last twelve months. In October, the M2 growth rate, year over year, was 4.63 percent. That's up from September's growth rate of 4.47 percent. October's growth rate was also up from October 2024's rate of 2.97 percent.

          Although year-over-year and month-to-month growth rates moderated during the summer—and even fell substantially during 2023 and early 2024, money-supply totals are again rapidly heading upward. M2 is now at the highest level it's ever been, topping $22.2 trillion. TMS has not yet returned to its 2022 peak, but is now at a 34-month high.

          Since 2009, the TMS money supply is now up by more than 200 percent. (M2 has grown by nearly 160 percent in that period.) Out of the current money supply of $20 trillion, nearly 29 percent of that has been created since January 2020. Since 2009, in the wake of the global financial crisis, more than $13 trillion of the current money supply has been created. In other words, more than two-thirds of the total existing money supply have been created since the Great Recession.

          Given current economic conditions, it is surprising to see such robust growth in the money supply.

          Given current stagnating economic conditions, it is surprising to see such robust growth in the money supply. Private commercial banks play a large role in growing the money supply in response to loose Fed policy. When economic conditions are expansive, and as employment grows, lending also grows, further loosening monetary conditions.

          In recent months, however, economic indicators continue to point to both worsening employment conditions and rising delinquencies. For example, US layoffs in October surged to a two-month high. Meanwhile, Bloomberg reports that " Mom-and-Pop Business Bankruptcies Hit a Record as Debts Rise." The latest price-sector jobs numbers show more job losses.

          This all applies downward pressure on money supply growth. However, in an effort to further pump asset prices and somehow counter our growing economic stagnation, the Fed lowered the target federal funds rate in September and throughout much of this year has slowed its efforts to reduce the Fed's balance sheet—also known as "quantitative tightening."

          This return to accommodative monetary policy—which belies Fed claims of "restrictive" policy—has surely done its part in returning the money supply to growth levels we haven't seen in years.

          Source: Gold-Eagle

          To stay updated on all economic events of today, please check out our Economic calendar
          Risk Warnings and Disclaimers
          You understand and acknowledge that there is a high degree of risk involved in trading. Following any strategies or investment methods may lead to potential losses. The content on the site is provided by our contributors and analysts for information purposes only. You are solely responsible for determining whether any trading assets, securities, strategy, or any other product is suitable for investing based on your own investment objectives and financial situation.
          Add to Favorites
          Share

          US Issues NATO's European Members New Self-Defense Deadline

          Michelle

          Political

          European members of NATO have been warned by Washington that they must assume greater responsibility for the alliance's intelligence operations and missile production - which will require significantly more defense spending by 2027, Reuters has reported.

          Reuters in its exclusive Friday report said that the United States "wants Europe to take over the majority of NATO's conventional defense capabilities, from intelligence to missiles, by 2027, Pentagon officials told diplomats in Washington this week, a tight deadline that struck some European officials as unrealistic."

          "The message, recounted by five sources familiar with the discussion, including a U.S. official, was conveyed at a meeting in Washington this week of Pentagon staff overseeing NATO policy and several European delegations," the report continued.

          The directive was coupled with a warning behind the scenes, reportedly involving Pentagon officials cautioning representatives from several European nations that the US may scale back its role in certain NATO defense efforts if this target and deadline is not met.

          US Army/NATO file image

          It was noted in the report that some European officials consider the 2027 goal unrealistic, saying that rapidly substituting American military support would demand far greater investment than current plans and NATO member approved defense budgets allow.

          This generally reflects the Trump administration's long verbalized dissatisfaction with with Europe's progress on shouldering more of NATO's collective defense burden.

          But the Reuters report also underscored that European officials were not offered tangible metrics whereby failure or success would be assessed:

          Conventional defense capabilities include non-nuclear assets from troops to weapons and the officials did not explain how the U.S. would measure Europe's progress toward shouldering most of the burden.

          It was also not clear if the 2027 deadline represented the Trump administration position or only the views of some Pentagon officials. There are significant disagreements in Washington over the military role the U.S. should play in Europe.

          One NATO official was cited as saying "Allies have recognized the need to invest more in defense and shift the burden on conventional defense" from the US to Europe.

          As we described previously the Trump administration's new National Security Strategy really hits out hard at Europe, stating saying "it is far from obvious whether certain European countries will have economies and militaries strong enough to remain reliable allies" to the United States.

          The document further highlights that this current reality of European weakness could have certain negative implications for potential for heightened Western escalation with Russia:

          "Managing European relations with Russia will require significant U.S. diplomatic engagement, both to reestablish conditions of strategic stability across the Eurasian landmass, and to mitigate the risk of conflict between Russia and European states," the document reads.

          Most analysts see the language in the document as opening the door for greater Washington meddling in European affairs.

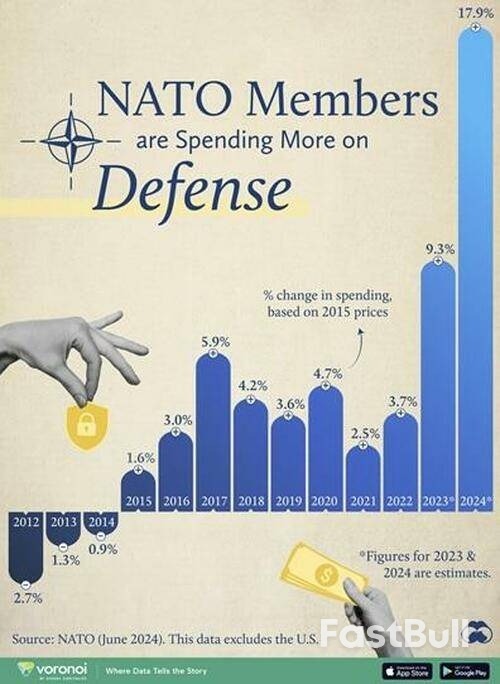
          Source: Visual Capitalist

          "Washington is no longer pretending it won't meddle in Europe's internal affairs" Pawel Zerka, a senior policy fellow at the European Council on Foreign Relations, observed.

          "It now frames such interference as an act of benevolence ('we want Europe to remain European') and a matter of US strategic necessity. The priority? 'Cultivating resistance to Europe's current trajectory within European nations'," he concludes.

          Source: Zero Hedge

          Risk Warnings and Disclaimers
          You understand and acknowledge that there is a high degree of risk involved in trading. Following any strategies or investment methods may lead to potential losses. The content on the site is provided by our contributors and analysts for information purposes only. You are solely responsible for determining whether any trading assets, securities, strategy, or any other product is suitable for investing based on your own investment objectives and financial situation.
          Add to Favorites
          Share

          U.S. Treasury Yields Steady Ahead of Fed Decision as Markets Price In High Probability of Rate Cut

          Gerik

          Economic

          Treasury Yields Flat as Markets Await Fed's Final Move of the Year

          U.S. bond markets entered the week in a holding pattern, with yields across the curve showing minimal movement ahead of the Federal Reserve’s highly anticipated final policy decision of 2025. At 2:39 a.m. New York time, the 10-year Treasury yield held steady at 4.141%, the 30-year yield was similarly unchanged at 4.794%, and the 2-year yield saw only a minor fluctuation at 3.561%.
          This calm in yields reflects market consensus that the Fed is poised to deliver a 25-basis-point rate cut when it concludes its two-day meeting on Wednesday. Data from the CME FedWatch tool shows traders are assigning an 87% probability to the cut, up significantly from 67% just a month ago, highlighting the influence of recent economic indicators and shifting policy commentary.

          Recent Economic Data Reinforces Case for Easing

          Expectations of a rate cut have been reinforced by a mix of softer labor data and subdued inflation readings. Last week’s ADP report surprised markets with a drop in private payrolls, while jobless claims for the week ending November 29 fell to their lowest level since September 2022. These indicators suggest a cooling labor market without signaling a major downturn, a combination that supports the Fed’s potential pivot toward easing without raising immediate recession alarms.
          In parallel, the delayed release of the September core Personal Consumption Expenditures (PCE) index came in below forecasts, further justifying a dovish tilt. While the Fed’s mandate includes both employment and price stability, this recent data mix has helped ease concerns about inflation persistence, allowing policymakers more room to maneuver.

          Market Reactions and Institutional Forecast Adjustments

          Investment banks have quickly adjusted their forecasts. Morgan Stanley recently reversed its earlier projection, now expecting a cut in December after acknowledging their previous call “jumped the gun.” JPMorgan and Bank of America have also aligned with the view that the Fed will lower rates this week, citing more dovish tones from Fed officials and the broader macro backdrop.
          The bond market’s muted response reflects how thoroughly the cut has already been priced in. While short-term Treasuries such as the 2-year note have shown slight movement, yields on long-dated securities like the 30-year have remained largely unmoved, suggesting that investors are more focused on guidance for 2026 and beyond rather than the immediate policy adjustment.

          Economic Outlook Boosted by Strong Holiday Season and GDP Momentum

          Adding to the market’s confidence, Treasury Secretary Scott Bessent noted over the weekend that consumer activity during the holiday season has been “very strong,” and projected that the economy will close the year with roughly 3% real GDP growth despite political gridlock. He cited recent quarterly growth exceeding 4% as evidence of sustained economic momentum.
          This macro backdrop has likely given the Fed added confidence to cut rates without triggering fears of overheating or inflation resurgence. The implication is that the Fed is moving from a phase of restrictive policy to one of normalization, rather than engaging in aggressive stimulus.

          Global Central Banks Also in Focus

          This week also marks a key period for monetary policy globally. The Swiss National Bank is scheduled to deliver its policy update on Thursday, while the Bank of England and European Central Bank will issue their rate decisions on December 18. Both institutions are expected to take cues from the Fed’s move. The Bank of Japan will follow with its final policy meeting of the year on December 19.
          These decisions will be closely watched for signs of synchronization or divergence in global monetary policy, particularly as Europe grapples with persistent inflation and Japan remains cautious about exiting ultra-loose policy.
          Treasury yields remain steady as markets await confirmation of a widely expected Fed rate cut this week. Recent labor and inflation data have solidified expectations, while commentary from policymakers and strong economic growth have created a favorable environment for easing. The real focus, however, will be on the Fed’s forward guidance whether this week’s move marks the beginning of a sustained rate-cutting cycle or a one-off adjustment to recalibrate monetary conditions heading into 2026.

          Source: CNBC

          To stay updated on all economic events of today, please check out our Economic calendar
          Risk Warnings and Disclaimers
          You understand and acknowledge that there is a high degree of risk involved in trading. Following any strategies or investment methods may lead to potential losses. The content on the site is provided by our contributors and analysts for information purposes only. You are solely responsible for determining whether any trading assets, securities, strategy, or any other product is suitable for investing based on your own investment objectives and financial situation.
          Add to Favorites
          Share
          FastBull
          Copyright © 2025 FastBull Ltd

          728 RM B 7/F GEE LOK IND BLDG NO 34 HUNG TO RD KWUN TONG KLN HONG KONG

          TelegramInstagramTwitterfacebooklinkedin
          App Store Google Play Google Play
          Products
          Charts

          Chats

          Q&A with Experts
          Screeners
          Economic Calendar
          Data
          Tools
          Membership
          Features
          Function
          Markets
          Copy Trading
          Latest Signals
          Contests
          News
          Analysis
          24/7
          Columns
          Education
          Company
          Careers
          About Us
          Contact Us
          Advertising
          Help Center
          Feedback
          User Agreement
          Privacy Policy
          Business

          White Label

          Data API

          Web Plug-ins

          Poster Maker

          Affiliate Program

          Risk Disclosure

          The risk of loss in trading financial instruments such as stocks, FX, commodities, futures, bonds, ETFs and crypto can be substantial. You may sustain a total loss of the funds that you deposit with your broker. Therefore, you should carefully consider whether such trading is suitable for you in light of your circumstances and financial resources.

          No decision to invest should be made without thoroughly conducting due diligence by yourself or consulting with your financial advisors. Our web content might not suit you since we don't know your financial conditions and investment needs. Our financial information might have latency or contain inaccuracy, so you should be fully responsible for any of your trading and investment decisions. The company will not be responsible for your capital loss.

          Without getting permission from the website, you are not allowed to copy the website's graphics, texts, or trademarks. Intellectual property rights in the content or data incorporated into this website belong to its providers and exchange merchants.

          Not Logged In

          Log in to access more features

          FastBull Membership

          Not yet

          Purchase

          Become a signal provider
          Help Center
          Customer Service
          Dark Mode
          Price Up/Down Colors

          Log In

          Sign Up

          Position
          Layout
          Fullscreen
          Default to Chart
          The chart page opens by default when you visit fastbull.com