

Markets
News
Analysis
User
24/7
Economic Calendar
Education
Data
- Names
- Latest
- Prev


Signal Accounts for Members
All Signal Accounts
All Contests
 Japan Tankan Small Manufacturing Outlook Index (Q4)
A:--
F: --
P: --
Japan Tankan Large Non-Manufacturing Outlook Index (Q4)A:--
F: --
P: --
Japan Tankan Large Manufacturing Outlook Index (Q4)A:--
F: --
P: --
Japan Tankan Small Manufacturing Diffusion Index (Q4)A:--
F: --
P: --
Japan Tankan Large Manufacturing Diffusion Index (Q4)A:--
F: --
P: --
Japan Tankan Large-Enterprise Capital Expenditure YoY (Q4)A:--
F: --
P: --
 U.K. Rightmove House Price Index YoY (Dec)
A:--
F: --
P: --
 China, Mainland Industrial Output YoY (YTD) (Nov)
A:--
F: --
P: --
China, Mainland Urban Area Unemployment Rate (Nov)A:--
F: --
P: --
 Saudi Arabia CPI YoY (Nov)
A:--
F: --
P: --
 Euro Zone Industrial Output YoY (Oct)
A:--
F: --
P: --
Euro Zone Industrial Output MoM (Oct)A:--
F: --
P: --
 Canada Existing Home Sales MoM (Nov)
A:--
F: --
P: --
Canada National Economic Confidence IndexA:--
F: --
P: --
Canada New Housing Starts (Nov)A:--
F: --
 U.S. NY Fed Manufacturing Employment Index (Dec)
A:--
F: --
P: --
U.S. NY Fed Manufacturing Index (Dec)A:--
F: --
P: --
Canada Core CPI YoY (Nov)A:--
F: --
P: --
Canada Manufacturing Unfilled Orders MoM (Oct)A:--
F: --
P: --
U.S. NY Fed Manufacturing Prices Received Index (Dec)A:--
F: --
P: --
U.S. NY Fed Manufacturing New Orders Index (Dec)A:--
F: --
P: --
Canada Manufacturing New Orders MoM (Oct)A:--
F: --
P: --
Canada Core CPI MoM (Nov)A:--
F: --
P: --
Canada Trimmed CPI YoY (SA) (Nov)A:--
F: --
P: --
Canada Manufacturing Inventory MoM (Oct)A:--
F: --
P: --
Canada CPI YoY (Nov)A:--
F: --
P: --
Canada CPI MoM (Nov)A:--
F: --
P: --
Canada CPI YoY (SA) (Nov)A:--
F: --
P: --
Canada Core CPI MoM (SA) (Nov)A:--
F: --
P: --
Canada CPI MoM (SA) (Nov)A:--
F: --
P: --
Federal Reserve Board Governor Milan delivered a speech U.S. NAHB Housing Market Index (Dec)--
F: --
P: --
 Australia Composite PMI Prelim (Dec)
--
F: --
P: --
Australia Services PMI Prelim (Dec)--
F: --
P: --
Australia Manufacturing PMI Prelim (Dec)--
F: --
P: --
Japan Manufacturing PMI Prelim (SA) (Dec)--
F: --
P: --
U.K. 3-Month ILO Employment Change (Oct)--
F: --
P: --
U.K. Unemployment Claimant Count (Nov)--
F: --
P: --
U.K. Unemployment Rate (Nov)--
F: --
P: --
U.K. 3-Month ILO Unemployment Rate (Oct)--
F: --
P: --
U.K. Average Weekly Earnings (3-Month Average, Including Bonuses) YoY (Oct)--
F: --
P: --
U.K. Average Weekly Earnings (3-Month Average, Excluding Bonuses) YoY (Oct)--
F: --
P: --
 France Services PMI Prelim (Dec)
--
F: --
P: --
France Composite PMI Prelim (SA) (Dec)--
F: --
P: --
France Manufacturing PMI Prelim (Dec)--
F: --
P: --
 Germany Services PMI Prelim (SA) (Dec)
--
F: --
P: --

No matching data
Latest Views
Latest Views
Trending Topics
Top Columnists
Latest Update
White Label
Data API
Web Plug-ins
Affiliate Program
View All
No data
Gold prices extended their rally on Tuesday, reaching 3,490 USD per troy ounce, approaching an all-time high. The metal found support in growing expectations of a Federal Reserve rate cut as soon as September, along with a concurrent weakening of the US dollar.
Gold prices extended their rally on Tuesday, reaching 3,490 USD per troy ounce, approaching an all-time high. The metal found support in growing expectations of a Federal Reserve rate cut as soon as September, along with a concurrent weakening of the US dollar.
Last week’s US inflation report bolstered hopes of a shift towards a more accommodative monetary policy. Markets are now pricing in an almost 90% probability of a 25-basis-point rate cut. Officials from the central bank itself reinforced this view after Mary Daly, President of the Federal Reserve Bank of San Francisco, openly expressed her support for such a move.
The key event risk this week will be the US Non-Farm Payrolls (NFP) report, expected to define the scale and pace of the upcoming rate-cutting cycle.
US trade policy is also creating substantial uncertainty. An appeals court ruled that the majority of tariffs imposed by Donald Trump were illegal, but kept them in force until 14 October to allow for an appeal to the Supreme Court. This political uncertainty is further fuelling demand for safe-haven assets.
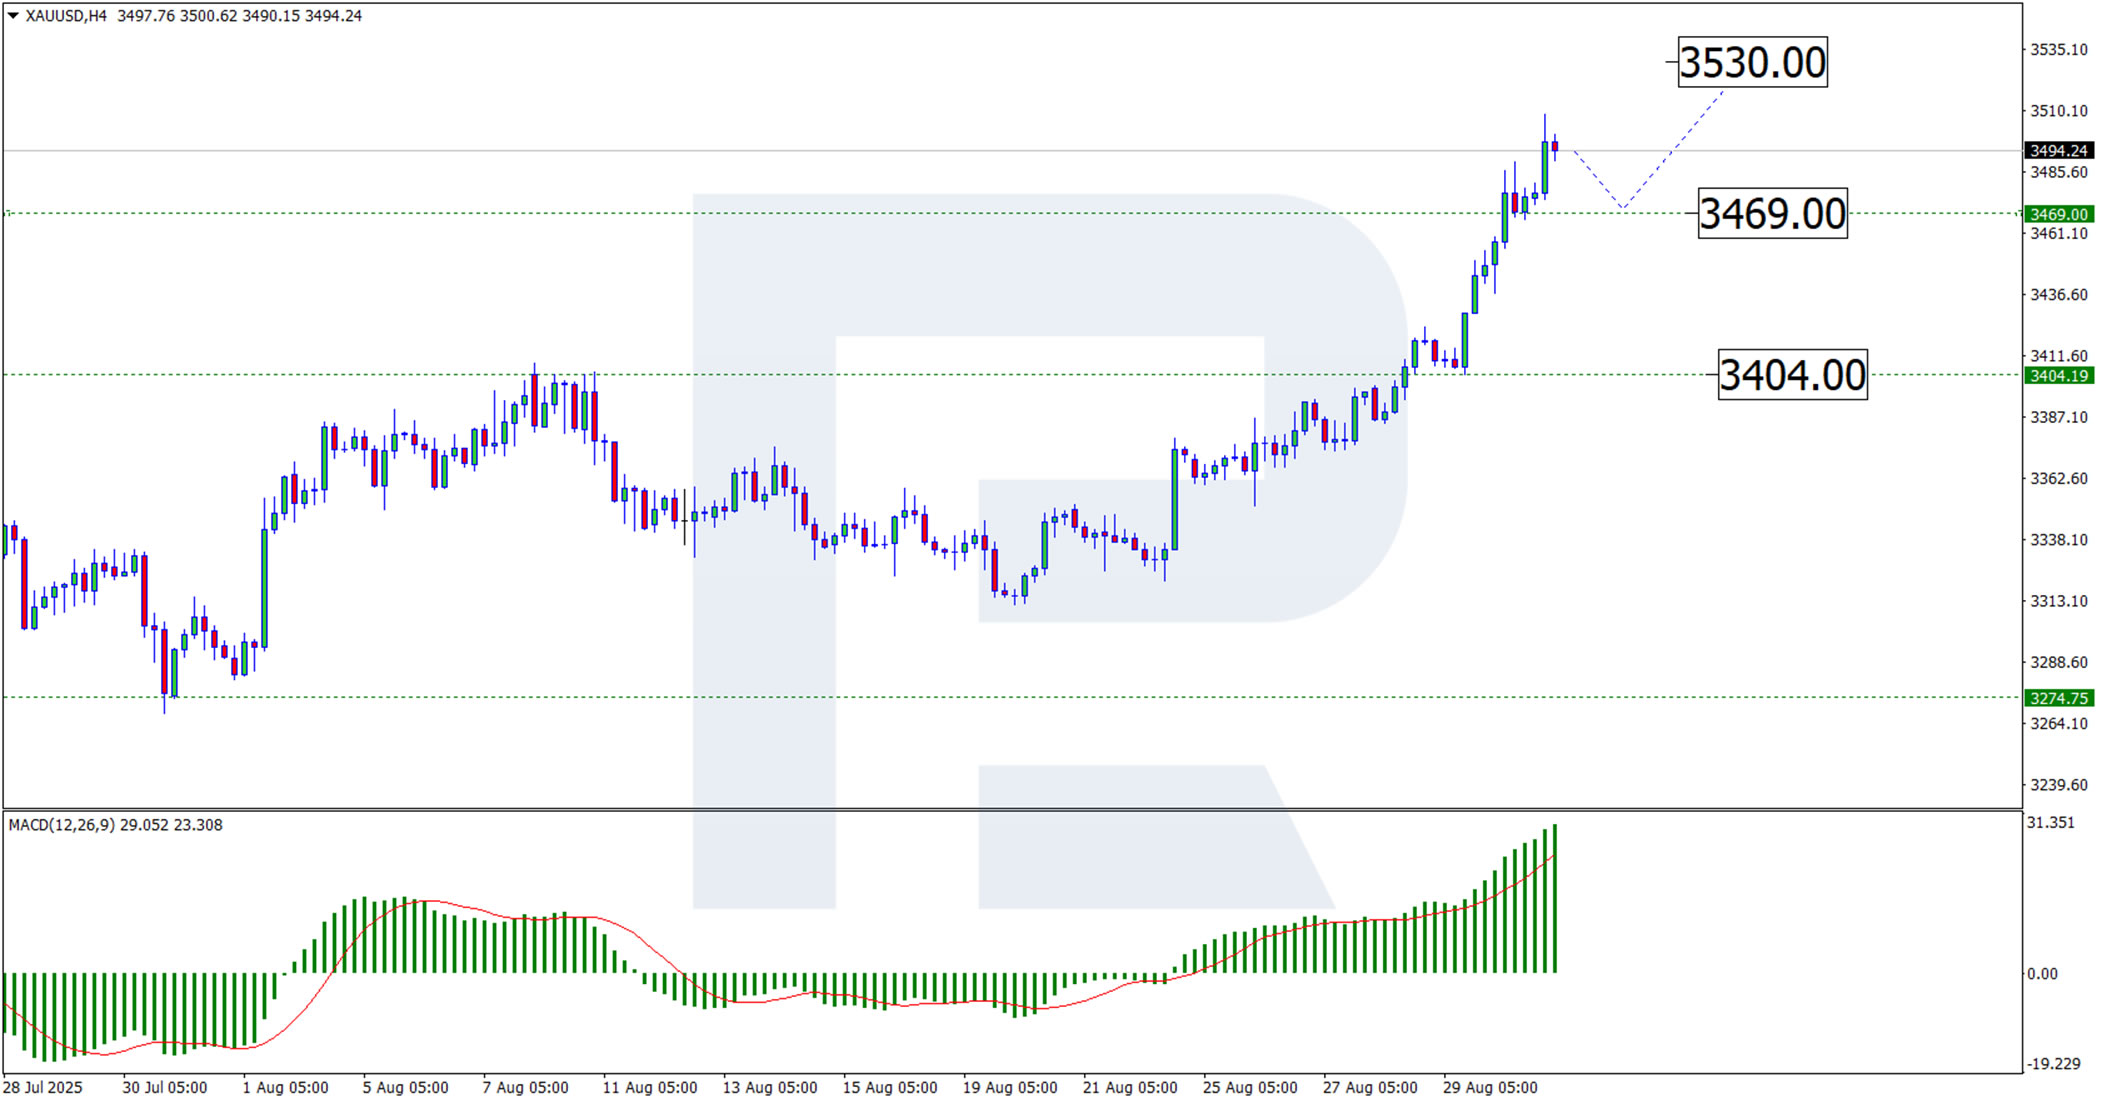
H4 chart:
The XAU/USD pair completed an upward wave towards the 3,508.65 USD level. The focus now shifts to a potential corrective wave towards the breached resistance level, which could now function as support. The target for this correction is 3,469 USD. Against the backdrop of the Federal Reserve’s supportive economic outlook, a test of this support could see prices stage another rally, with the first target likely being the 3,530 USD mark. This scenario is technically supported by the MACD indicator, whose histogram and signal line remain above zero and continue to rise, confirming the potential continuation of the upward trend. However, minor corrections cannot be ruled out.
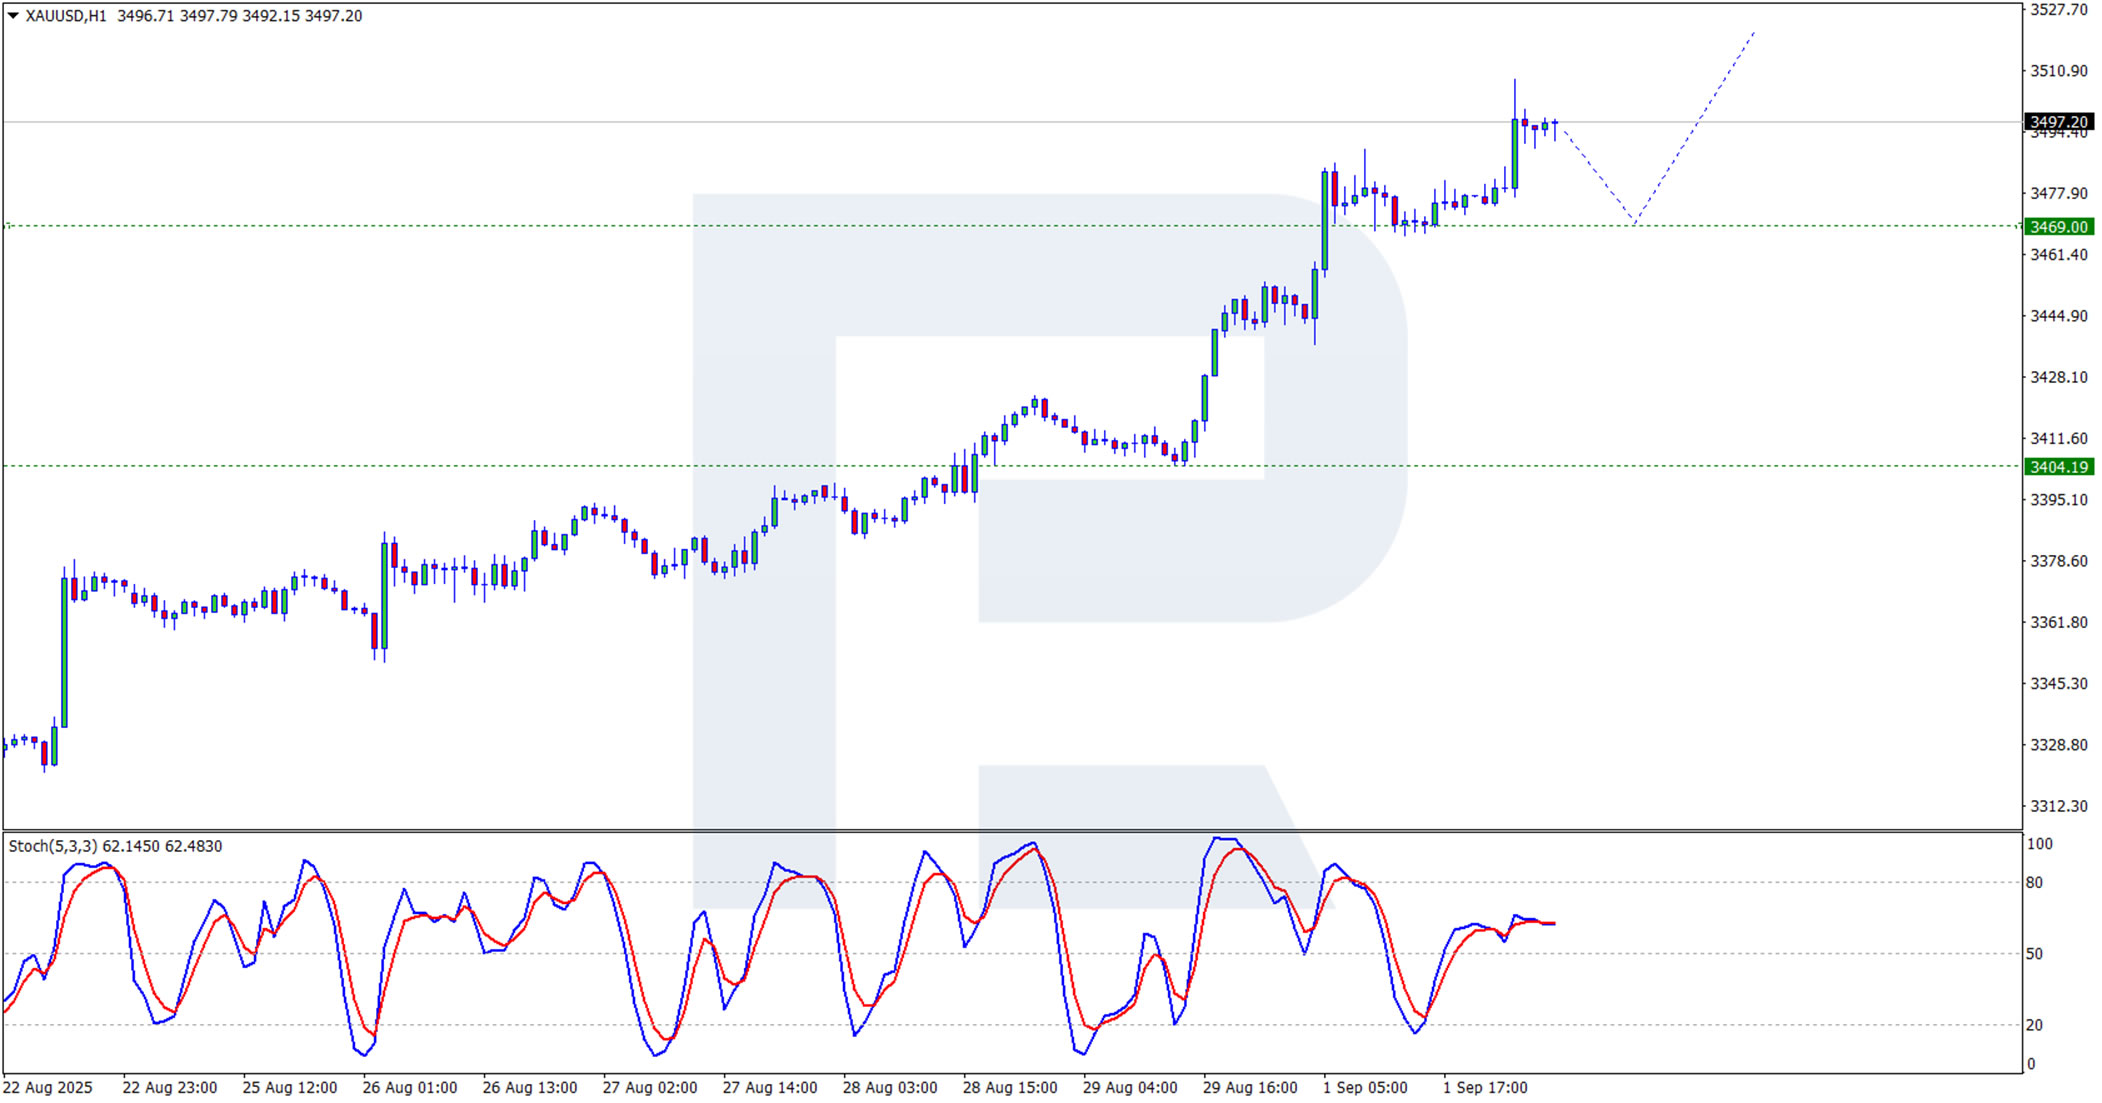
H1 chart:
After testing the 3,500 USD level, the price is forming a corrective wave. The target for this pullback could be the support at 3,469 USD. Testing this level could pave the way for the resumption of the upward trend. This outlook is technically supported by the Stochastic oscillator, whose signal lines, after a period of increase, are now declining towards 50.0.
A combination of dovish Fed expectations, a softer dollar, and geopolitical trade uncertainties continues to support gold prices. The technical picture suggests a brief period of consolidation or a shallow pullback is likely before a potential retest of record highs.
Long-dated bond yields in Europe hit multi-year highs on Tuesday as investors grow increasingly worried about the state of finances in countries around the world, while stocks slid, the dollar gained, and gold touched a fresh record high.
As markets suffered a sharp September back-to-school shock, the Japanese yen also tumbled after a close aide to Prime Minister Shigeru Ishiba said on Tuesday he would resign from his post.
Later in the day, U.S. business activity data will be the first in a raft of important economic figures to come this week.
Britain's 30-year bond yield rose nearly 6 basis points to 5.697%, its highest since 1998, France's rose a similar amount to 4.513%, its highest since 2009, and Germany's was at its highest since 2011 at 3.41%. (DE30YT=RR), (GB30YT=RR), (FR30YT=RR)
Bond yields move inversely to prices, and yields especially on super-long-dated 30-year bonds have been soaring around the world, with investors concerned about the scale of debt in countries from Japan to the United States.
"The pain trade in bond markets seamlessly carried over from August into September," said Kenneth Broux, head of corporate research FX and rates at Societe Generale.
"And the flurry of new primary issuance that awaits investors in the coming days and weeks threatens to exacerbate the global sell-off in the long end."
More than 100 billion euros ($117 billion) is planned in European bond issuance in September and October.
The U.S. 30-year yield was also up 6 bps at 4.8% (US30YT=RR) but that was only its highest since July, while benchmark 10-year Treasury yields rose 6 bps to 4.28%.
But Britain and France are in particular focus.
French Prime Minister Francois Bayrou looks set to lose a confidence vote next week as opposition parties balk at his cuts to government spending, while British finance minister Rachel Reeves is expected to raise taxes in her autumn budget in order to remain in line with her fiscal targets.
Sterling also tumbled sharply, down 1.3% on the dollar at $1.3370, and at its weakest in nearly a month on the euro.,
Currencies were volatile elsewhere too, and the dollar was last up nearly 1%on the yen, at 148.6as dovish-leaning remarks from a Bank of Japan official and the resignation of a key ruling party official pulled down the Japanese currency.
The euro also slid 0.7% to $1.631.and Broux said the dollar was seeing some safe-haven properties for the first time since April's tariff shock.
"It is only one day of course," he said noting the moves could provide "an attractive entry point if (nonfarm payrolls) surprises to the downside on Friday and the clamour grows for the Fed to cut."
All that hurt stocks, and Europe's broad Stoxx 600 share benchmark was down 1%, with rate-sensitive real estate stocks down nearly 3%. (.SX86P)
U.S. share futures fell 0.7%
Still to come is U.S. business activity data, the first instalment in a packed week of economic figures which will either underscore expectations the Federal Reserve will cut rates later this month, or put them into question.
The most important of the week's data is Friday's U.S. nonfarm payrolls report, which will be preceded by data on job openings and private payrolls, providing investors and the Fed a clearer picture of the labour market that has become the centre of policy debate.
Markets widely expect the Fed to lower interest rates later this month, pricing in an 89% chance of a 25-basis-point cut.
The prospect of near-term Fed cuts, long-term worries about inflation, and global market jitters combine to a perfect environment for precious metals.
Gold rose as high as $3,508.5an ounce early on Tuesday, its highest on record, while silver rose to a 14-year high., (GOL/)
Both then retreated in European trading hit by a rebound in the dollar.
Oil prices rose as concerns about supply disruptions grew amid an escalation of the conflict between Russia and Ukraine. Brent cruderose 1.5% to $69.17 a barrel.
Russia agreed to supply more natural gas to China and signed a memorandum on building the vast Power of Siberia 2 pipeline, but has yet to agree on pricing for one of the world's most expensive gas projects, Gazprom said on Tuesday.The "no limits" partnership between China, the world's biggest consumer of energy, and Russia, the world's biggest producer of natural resources, has strengthened since the West imposed sanctions to punish Russia for the war in Ukraine.
By deepening ties with his "old friend" Russian President Vladimir Putin, Chinese President Xi Jinping is showing he can resist U.S. pressure to turn its back on Moscow. However, the lack of progress on pricing for Power of Siberia 2 indicates that he is also demanding steep discounts from Russia.Since losing a lucrative chunk of the European gas market, Russia has pivoted towards China, and Gazprom has sought an agreement for years on building the Power of Siberia 2 pipeline, capable of delivering 50 billion cubic metres (bcm) per year to China through Mongolia from the Arctic gas fields of Yamal.
Alexei Miller, the CEO of Gazprom (GAZP.MM), opens new tab, told Russian news agencies that an agreement had been reached to increase supplies via the existing Power of Siberia pipeline, which runs from Eastern Siberia to China, to 44 billion cubic metres (bcm) a year from 38 bcm."Today, a legally binding memorandum was signed on the construction of the Power of Siberia 2 gas pipeline and the Soyuz Vostok transit gas pipeline through Mongolia," Miller said. Soyuz Vostok is designed to be the portion of the Power of Siberia 2 pipeline, traversing Mongolia.
But the price of gas supplied via the pipeline - one of the key factors for understanding the cost of building the pipeline and how those costs will be shared amongst the parties involved - will be agreed separately, Miller was quoted by the TASS state news agency as saying.The price, Miller said, would be lower than the price charged by Gazprom to European buyers due to the vast distances and terrain over which pipelines had to be built.
It was also not clear who will build the pipeline.
After Putin met Xi and Mongolian President Ukhnaagiin Khurelsukh in Beijing, the Kremlin said that 22 agreements had been signed during Chinese talks, including a deal on strategic cooperation between Gazprom and China National Petroleum Corporation, but it gave no details.Asked to confirm the pipeline deal, Russia's foreign ministry spokesperson said that China and Russia have always carried out pragmatic cooperation in various fields, including energy.
Building a gas pipeline from the vast Bovanenkovo and Kharasavey gas fields of northern Russia across the wilderness of Siberia to Mongolia and then to China would be the world's biggest and most capital-intensive gas project, Miller said.Reuters reported last month that China was seeking to buy more Russian gas through an existing pipeline as talks between the two countries had failed to make significant progress on building a new link.
Gazprom shares edged up 0.5% in Moscow trading.
Putin and Xi, who have both pushed back against the perceived humiliations of the 1991 collapse of the Soviet Union and centuries of European colonial dominance of China, say the world is entering a new era with the West in decline.The United States casts China as its biggest competitor and Russia as its biggest nation-state threat, though U.S. President Donald Trump has criticised Western moves he thinks have pushed Moscow and Beijing closer.
China is now Russia's biggest trading partner, the biggest purchaser of Russian crude and Russian gas, the second-biggest purchaser of Russian coal and the third-biggest purchaser of Russian LNG, according to the Kremlin.Gazprom supplies natural gas to China through a 3,000 km (1,865 mile) pipeline called Power of Siberia under a 30-year, $400 billion deal launched at the end of 2019.
In 2024, exports amounted to about 31 billion cubic meters (bcm). It is expected that supplies will reach the planned capacity of 38 bcm this year.In February 2022, China also agreed to buy up to 10 bcm of gas annually by around 2026-2027 via a pipeline from Sakhalin Island in Russia's Far East.Miller said an agreement had been reached to increase gas supplies via the Far Eastern route to 12 bcm from the 10 bcm.But Russia's gas exports to China are still a small fraction of the record 177 bcm it delivered to Europe in 2018-19 annually.
Russian gas now accounts for just 18% of European imports, down from 45% in 2021, while the bloc's oil imports from Russia have fallen to 3% from around 30% over that time. The European Union plans to fully phase out Russian energy by 2027.
A little-known indicator of the US cargo transport market is flashing hints of a slowdown during what’s usually a busy time of year.
And while it’s too early to call it the start of a freight recession, two statistical lines just crossed each other that bear watching.
Those are among the takeaways from the latest Logistics Manager’s Index compiled by Zac Rogers, an associate professor at Colorado State University. The August figures released Tuesday showed notable drops in transportation prices and utilization, while available capacity rose.
For logistics chart watchers, such an alignment is called a “negative freight inversion,” which Rogers acknowledged was minimal at this stage.
“While these are not necessarily seismic shifts on their own, the fact that transportation capacity is now expanding faster than transportation prices is significant as it represents a mild negative freight inversion,” Rogers posted on his LinkedIn page during the Labor Day holiday.
He cautioned that this may not herald the start of freight recession, and survey respondents’ future predictions “actually point to that not happening.”
But the fact that these signals are flashing in August, which is normally peak season for moving everything from back-to-school items to year-end holiday merchandise, “renders the chances of a boom market happening any time soon as fairly unlikely,” Rogers wrote.
What makes the inversion all the more surprising is that until January, freight metrics were “trending up strongly, and that we might begin moving towards a strong expansionary period like those seen in 2017-2018 and 2020-2021.”
“This is a marked shift, however, and it will be critical to continue monitoring movements in these metrics as transportation often acts as a leading indicator for the overall economy,” according to Rogers. “I’m not saying that the freight market should expect coal in their stockings for Christmas, but at this point it certainly doesn’t look like a banner peak season ahead.”
Among the sources of the transportation industry’s uneven activity this year: turbulence tied to the Trump administration’s tariffs, the frontloading of orders to pad inventories and a general sense of uncertainty.
“It seems unlikely that upstream transportation will pick up in any significant way in the last few months of 2025 as orders for containers inbound to the US are down 20% over the past six weeks,” today’s LMI report stated. “This corroborates the idea put forth in last month’s report that July represented peak season for imports.”
Bitcoin paused beneath a key resistance band after a sharp rebound. The market faces a binary path from this pivot. A breakout targets $114.5k–$118k, while rejection favors $109k–$107k first.
The immediate line in the sand sits near $112k. Acceptance above it would flip bias and unlock higher liquidity pockets. Momentum could then guide price toward $114.5k–$116k, and possibly $118k.
$BTC has spent the whole holiday weekend stuck under resistance.Right now it’s testing a key zone that could decide whether this is still a wave (2) correction or the start of a bigger B-wave rally.As long as Bitcoin stays under $112k, the corrective view holds. A break… pic.twitter.com/DZ7hRJ9QXH
— More Crypto Online (@Morecryptoonl) September 2, 2025
Failure at $112k keeps a lower-high structure intact. Prices would likely rotate toward the $109k–$107k demand band. A daily close below that shelf exposes $105k–$103k risk.
This decision zone overlaps common Fibonacci retraces of the prior slide. Therefore, stop runs on both sides are likely before resolution. Clear higher-time-frame closes should confirm whichever side wins.
Intraday, price advanced, hugged the upper band, and then cooled. It now consolidates just above $110k as volatility contracts. This behavior fits typical digestion beneath nearby resistance.
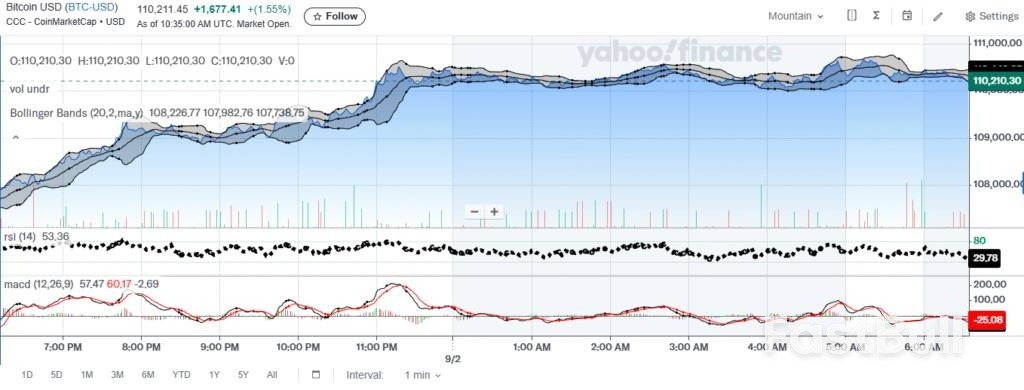
Short-term momentum has softened on standard oscillators. RSI dipped toward the low-30s while MACD crossed below its signal. These readings confirm fading thrust after the earlier burst.
Holding the mid-band near $110.0k–$110.1k keeps a retest of $110.6k–$111.0k in play. A break under the lower band and session VWAP opens $109.8k. Below there, $109.3k–$109.5k stands as next supports.
The zone under test aligns with the prior breakdown and heavy order flow. In Elliott terms, rejection supports a wave-(2) corrective bounce. Meanwhile, a firm reclaim argues for a larger B-wave advance.
Market structure across L1 and L2 venues remains orderly. Funding and open interest behavior will help filter fake moves. Rising volume during a level reclaim would strengthen the bullish case.
Until price either rejects $112k or accepts above it, range tactics remain practical. Traders may lean on clear invalidation levels and tight stops. Directional conviction returns once the pivot decisively breaks.
It looked like just another gas station like thousands across Brazil. But this Shell-branded station outside Sao Paulo was selling gasoline for a few cents a liter less than the competition down the street. Driving to work, a Brazilian lawyer named Julia didn’t think twice before filling up her red Ford Bronco. She quickly became a regular customer.“I never understood how they could sell the same product for so much cheaper, but my car didn't have any problems with it,” said Julia. “It makes a huge difference.”
Stations like this one are now in the spotlight after Brazilian police and prosecutors launched a multi-state sting operation Aug. 28 in a bid to dismantle sophisticated organized crime schemes that use fuel distribution. They allege that the perpetrators worked in conjunction with asset managers and fintech platforms to launder at least 52 billion reais ($9.6 billion) in illicit profits. The main investigation, dubbed Hidden Carbon, spans from nondescript corner stations to intricate refineries all the way to the glass towers of Sao Paulo’s Wall Street. One of the alleged ringleaders is now believed to be on the run.
Prosecutors say the criminals are tied to Brazil’s notorious drug cartel Primeiro Comando da Capital, or PCC, which they say has infiltrated fuel distribution networks where unwitting drivers are tanking up at prices made cheaper through tax evasion.The bargain fuel retailer outside Sao Paulo that Julia frequented operated independently of Shell but was licensed to use the brand. In a pattern that industry experts describe as typical of the criminal modus operandi, the station recently swapped the oil major’s iconic clamshell logo for an obscure brand that Julia didn’t trust.
“I’m now going to another Shell station even though I’m paying more,” said Julia, who requested not to use her last name, fearing reprisals in case gangs are pumping the gas.A prosecutor involved in the case could not confirm whether the station is implicated. A phone number for the station listed online was not working when Bloomberg tried to call Monday. Shell, which is one of Brazil’s top oil producers, and its local partner Raizen SA, declined to comment.
The fuel industry in Brazil has been pressing the government to take action for years. Organized crime has become an “entrepreneur,” Emerson Kapaz, president of Brazil’s Legal Fuel Institute, an industry group dedicated to defending legal distribution, said in an interview. “The institute closes two doors against illegality and they are able to open three. Crime has distributors, transportation companies, fintechs, and it adds value to each of the links.”
The gangs often target distressed stations where the legitimate owners are forced out without compensation and sometimes subjected to death threats. The criminals “usually acquire gas stations from small networks that are facing some financial issues, and out of the blue, they slash prices,” said James Thorp Neto, president of the fuel retailers association. The group estimates that 11% of Brazil’s 45,000 stations are compromised by crime.
Big brands have been affected too, if only in name. “We are working with those companies to delist those gas stations, but it’s hard to identify them,” Thorp said. “They usually operate with zero margins for awhile to force other gas stations to close or sell their operations.” When established oil companies such as Raizen suspect such infiltration, they withdraw their licenses.
The fuel is sometimes adulterated to inflate profits. The crime extends to Brazil’s biofuels industry, according to the investigation, which found that owners of sugar and alcohol mills and farmers were obliged to sell their properties to the PCC.The phenomenon has been squeezing legitimate fuel distributors in a sector known for razor-thin margins. So it was no surprise that the share prices of the market’s main actors, including Ipiranga SA, a unit of Ultrapar SA, Vibra Energia SA and Raizen, rallied after the high-profile sting.
“No one can compete when a competitor has 10 times your margin. Sometimes the advantage reaches 60 cents (of reais) per liter,” Ipiranga Vice President Guido Rogério Macedo Silveira Filho said at a recent industry conference about the criminal capture of fuel distribution.Far from the fuel tanks, the criminals’ loot is funneled into asset managers and some of Brazil’s more than 1,500 fintechs whose growth in recent years has outpaced the government’s ability to regulate them.
“We will remember that drug traffickers used to bury money, and that money would lose its value,” Marcia Meng, an official at Brazil’s tax authority, told reporters after the Aug. 28 bust. “Today the money of organized crime is banked and placed in capital markets to yield returns.”In the main alleged laundering scheme revealed by prosecutors last week, a network of fraudsters said to be headed by Mohamad Hussein Mourad, CEO of transport company G8LOG in Sao Paulo, constructed a financial labyrinth to conceal an illegal fuel enterprise and wash the PCC’s money, according to court documents reviewed by Bloomberg.
The racket encompassed the entire fuel chain, from diesel imports and sugar mills for ethanol to the transport and distribution of adulterated products through some 1,200 gas stations across Brazil, the documents said.
Mourad couldn’t be reached for comment Monday. Police searched his Sao Paulo office and other addresses as part of the wider anti-crime operation. The Sao Paulo Justice Ministry declined to comment on Mourad’s whereabouts.
The suspected ringleader and his network of dozens of associates, strawmen and accomplices allegedly hid their operations by using shell companies, investment funds and fintechs, exploiting lax oversight. That “money-laundering ecosystem” benefited the PCC, the court documents said.Police have long been tracking Mourad. In July 2024, Brazil’s oil regulator revoked the licenses of two fuel companies associated with him that had alleged links to PCC-run money-laundering and tax evasion: fuel blender Copape Produtos de Petróleo and distributor Aster Petróleo.
In a post on his LinkedIn page, Mourad described the cancellation of the licenses as “nothing more than a war between competitors.”Prosecutors said last week that Rodopetro, the distribution unit of Brazilan refiner Refit, had taken the place of Copape and Aster to sustain the laundering activity. Rodopetro is the top wholesale gasoline distributor in Rio de Janeiro state, the epicenter of Brazil’s oil industry. Refit in a statement denied any involvement.
The illicit financial transactions laid out by prosecutors in the Hidden Carbon case were routed through “parallel accounting systems” run by criminally compromised fintechs, whose client base consisted mostly of companies in the fuel sector. The profits were allegedly concealed in investment funds such as Reag Investimentos SA and Cia Brasileira de Servicos Financeiros SA, which confirmed in a regulatory filing that search warrants were served at their offices last week as part of the investigations. The companies said they are cooperating with the investigation.
Funds managed by Banco Genial SA and Trustee Distribuidora de Títulos e Valores Mobiliários Ltda are among the other targets of the investigation. Banco Genial denied any involvement. Trustee said it had previously dropped the funds that were implicated in the investigation for compliance reasons and denied any relationship with the people involved.
The elaborate fuel and financial schemes highlight the evolution of the PCC from its origins as a jailhouse gang of Sao Paulo crooks and thugs to an international crime syndicate with some 40,000 “baptized” members. Flush with hundreds of millions of dollars from pumping drugs mainly into Europe, the organization is rapidly diversifying into legitimate businesses to mask its illicit activities.
Brazil’s police have caught the organization funneling money into luxury real estate, city bus lines, online sports betting and crypto exchanges. Drug cartels across the region often tap front companies to clean their cash, but the PCC has real business savvy, said Will Freeman, a Latin America fellow at the Council on Foreign Relations.
“The PCC has cracked a code on how not just to launder money, but how to use crime money to build successful businesses,” he said.The organization formed in the wake of the 1992 Carandiru penitentiary massacre that left some 111 inmates dead. Prisoners in Sao Paulo, Brazil’s most populous and wealthiest state, united to protect themselves from authorities’ abuses and instill order behind bars.
They established a gang code and employed gruesome methods, including torture and decapitations, to eliminate rivals. In three decades, the PCC has spread far outside Brazil’s prison system, building an international narcotics ring that links South American producers with European mafias, such as Italy’s ‘Ndrangheta. The US Treasury Department says the criminal organization is now among the “most powerful in the world.”
Predictably, politicians raced to celebrate last week’s sting operation. In an X post Thursday, President Luiz Inacio Lula da Silva described it as the “biggest response by the Brazilian government to organized crime in our history to date.” His potential rival in next year’s presidential election, Sao Paulo Governor Tarcisio Gomes de Freitas, said in a video posted on X that “Crime groups are being fought as never before, and the message is clear: organized crime won’t have a place in Sao Paulo!”
Brazil’s Senate scheduled a vote this week on a bill that would toughen rules against serial tax dodgers, a measure that the fuels industry had long been lobbying for. If approved, the proposal would still need to pass the lower house.Hidden Carbon may prove to be Brazil’s most far-reaching criminal probe since the Car Wash corruption scandal, which implicated Lula himself until his conviction was annulled in 2021.“Brazil is confronting one of the most audacious criminal infiltration schemes in history,” said Robert Muggah, co-founder of Igarape Institute, a think tank in Rio de Janeiro.
“The integration of organized crime into critical economic sectors from energy to finance represents a dangerous escalation of risk for Brazil,” Muggah said. “By capturing strategic assets and exploiting regulatory blind spots, the PCC and its allies are not only draining public revenues, they are undermining trust in the financial system and governance.”
728 RM B 7/F GEE LOK IND BLDG NO 34 HUNG TO RD KWUN TONG KLN HONG KONG


White Label
Data API
Web Plug-ins
Poster Maker
Affiliate Program
The risk of loss in trading financial instruments such as stocks, FX, commodities, futures, bonds, ETFs and crypto can be substantial. You may sustain a total loss of the funds that you deposit with your broker. Therefore, you should carefully consider whether such trading is suitable for you in light of your circumstances and financial resources.
No decision to invest should be made without thoroughly conducting due diligence by yourself or consulting with your financial advisors. Our web content might not suit you since we don't know your financial conditions and investment needs. Our financial information might have latency or contain inaccuracy, so you should be fully responsible for any of your trading and investment decisions. The company will not be responsible for your capital loss.
Without getting permission from the website, you are not allowed to copy the website's graphics, texts, or trademarks. Intellectual property rights in the content or data incorporated into this website belong to its providers and exchange merchants.
Not Logged In
Log in to access more features

FastBull Membership
Not yet
Purchase


Log In
Sign Up


