• Trade
  • Markets
  • Copy
  • Contests
  • News
  • 24/7
  • Calendar
  • Q&A
  • Chats
Trending
Screeners
SYMBOL
LAST
BID
ASK
HIGH
LOW
NET CHG.
%CHG.
SPREAD
SPX
S&P 500 Index
6862.12
6862.12
6862.12
6901.43
6857.40
-34.12
-0.49%
--
DJI
Dow Jones Industrial Average
48146.67
48146.67
48146.67
48394.51
48110.85
-220.38
-0.46%
--
IXIC
NASDAQ Composite Index
23294.24
23294.24
23294.24
23445.26
23272.98
-124.83
-0.53%
--
USDX
US Dollar Index
97.970
98.050
97.970
98.180
97.850
+0.090
+ 0.09%
--
EURUSD
Euro / US Dollar
1.17442
1.17449
1.17442
1.17591
1.17198
-0.00032
-0.03%
--
GBPUSD
Pound Sterling / US Dollar
1.34693
1.34702
1.34693
1.34763
1.34014
+0.00018
+ 0.01%
--
XAUUSD
Gold / US Dollar
4319.61
4320.02
4319.61
4373.05
4274.29
-19.50
-0.45%
--
WTI
Light Sweet Crude Oil
57.439
57.469
57.439
58.414
57.330
-0.414
-0.72%
--

Community Accounts

Signal Accounts
--
Profit Accounts
--
Loss Accounts
--
View More

Become a signal provider

Sell trading signals to earn additional income

View More

Guide to Copy Trading

Get started with ease and confidence

View More

Signal Accounts for Members

All Signal Accounts

Best Return
  • Best Return
  • Best P/L
  • Best MDD
Past 1W
  • Past 1W
  • Past 1M
  • Past 1Y

All Contests

  • All
  • Trump Updates
  • Recommend
  • Stocks
  • Cryptocurrencies
  • Central Banks
  • Featured News
Top News Only
Share

Explosion Heard In Syria's Aleppo, Ekhbariya TV Reports

Share

EIA - USA Oct Distillates Demand Up 0.2 Percent Or 9000 Barrels/Day Versus Last Year At 4.14 Million Barrels/Day (Versus 2.2 Percent Rise In Sept)

Share

USA Total Oil Demand In Oct Down 1.7 Percent Or 371000 Barrels/Day Versus Last Year At 20.878 Million Barrels/Day (Versus 2.6 Percent Rise In Sept)- EIA's Petroleum Supply Monthly

Share

EIA - USA Oct Gasoline Demand Down 0.7 Percent Or 60000 Barrels/Day Versus Last Year At 9.01 Million Barrels/Day (Versus 0.3 Percent Fall In Sept)

Share

EIA - USA Product Supplied Of Distillate Fuel Oil Rose To 4.1 Million Barrels/Day In October, The Highest In Three Years

Share

EIA - USA Product Supplied Of Finished Motor Gasoline Rose To 9 Million Barrels/Day In October

Share

EIA - USA Product Supplied Of Crude And Petroleum Products Rose To 20.9 Million Barrels/Day In October

Share

The S&P 500 Fell 0.5%, And The NASDAQ 100 Fell 0.6%

Share

Brent Crude Oil Fell 1.0% On The Day, To $60.71 A Barrel

Share

ICE Cotton Futures Fall 6% In 2025, Their Fourth Consecutive Yearly Decline

Share

Brent Crude Futures Settle At $60.85/Bbl, Down 48 Cents, 0.78 Percent

Share

EIA - USA Natural Gas Liquids Production Falls By 97000 Barrels/Day In Oct To 7.798 Million Barrels/Day (Versus 7.895 Million Barrels/Day In Sept)

Share

EIA - USA Crude-By-Rail Shipments Rose By 30000 Barrels/Day In October

Share

French President Macron Called For Europe To Achieve Independence In The Fields Of AI And Quantum Computing

Share

USA Natural Gas Futures Rise About 2% In 2025, Its Second Straight Yearly Gain

Share

USA Crude Oil Futures Settle At $57.42/Bbl, Down 53 Cents, 0.91 Percent

Share

EIA Data - Total USA/Canada Crude-By-Rail Shipments To W.Coast (Padd 5) Rose To 140000 Barrels/Day In October (Versus 100000 Barrels/Day In September)

Share

EIA Data - Total USA/Canada Crude-By-Rail Shipments At Gulf Coast (Padd 3) Unchanged At 123000 Barrels/Day In October (Versus 123000 Barrels/Day In September)

Share

EIA Data - Total USA/Canada Crude-By-Rail Shipments To E.Coast (Padd 1) Fell To 36000 Barrels/Day In October (Versus 43000 Barrels/Day In September)

Share

EIA Data - Canadian Shipments Of Crude Oil By Rail To United States 80000 Barrels/Day In October

TIME
ACT
FCST
PREV
U.S. S&P/CS 10-City Home Price Index YoY (Oct)

A:--

F: --

P: --

U.S. S&P/CS 10-City Home Price Index MoM (Not SA) (Oct)

A:--

F: --

P: --

U.S. S&P/CS 20-City Home Price Index (Not SA) (Oct)

A:--

F: --

P: --

U.S. S&P/CS 20-City Home Price Index MoM (Not SA) (Oct)

A:--

F: --

P: --

U.S. FHFA House Price Index YoY (Oct)

A:--

F: --

P: --
U.S. Chicago PMI (Dec)

A:--

F: --

P: --

Brazil CAGED Net Payroll Jobs (Nov)

A:--

F: --

P: --

U.S. Weekly Total Oil Rig Count

A:--

F: --

P: --

U.S. Weekly Total Rig Count

A:--

F: --

P: --

FOMC Meeting Minutes
U.S. API Weekly Refined Oil Stocks

A:--

F: --

P: --

U.S. API Weekly Crude Oil Stocks

A:--

F: --

P: --

U.S. API Weekly Cushing Crude Oil Stocks

A:--

F: --

P: --

U.S. API Weekly Gasoline Stocks

A:--

F: --

P: --

South Korea CPI YoY (Dec)

A:--

F: --

P: --

China, Mainland NBS Manufacturing PMI (Dec)

A:--

F: --

P: --

China, Mainland Composite PMI (Dec)

A:--

F: --

P: --

China, Mainland NBS Non-manufacturing PMI (Dec)

A:--

F: --

P: --

China, Mainland Caixin Manufacturing PMI (SA) (Dec)

A:--

F: --

P: --

Turkey Trade Balance (Nov)

A:--

F: --

P: --

South Africa Trade Balance (Nov)

A:--

F: --

P: --

U.S. Initial Jobless Claims 4-Week Avg. (SA)

A:--

F: --

P: --
U.S. Weekly Continued Jobless Claims (SA)

A:--

F: --

P: --
U.S. Weekly Initial Jobless Claims (SA)

A:--

F: --

P: --
U.S. EIA Weekly Cushing, Oklahoma Crude Oil Stocks Change

A:--

F: --

P: --

U.S. EIA Weekly Crude Demand Projected by Production

A:--

F: --

P: --

U.S. EIA Weekly Gasoline Stocks Change

A:--

F: --

P: --

U.S. EIA Weekly Crude Stocks Change

A:--

F: --

P: --

U.S. EIA Weekly Heating Oil Stock Changes

A:--

F: --

P: --

U.S. EIA Weekly Crude Oil Imports Changes

A:--

F: --

P: --

U.S. EIA Weekly Natural Gas Stocks Change

A:--

F: --

P: --

South Korea Trade Balance Prelim (Dec)

--

F: --

P: --

South Korea IHS Markit Manufacturing PMI (SA) (Dec)

--

F: --

P: --

Indonesia IHS Markit Manufacturing PMI (Dec)

--

F: --

P: --

India HSBC Manufacturing PMI Final (Dec)

--

F: --

P: --

Russia IHS Markit Manufacturing PMI (Dec)

--

F: --

P: --

U.K. Nationwide House Price Index MoM (Dec)

--

F: --

P: --

U.K. Nationwide House Price Index YoY (Dec)

--

F: --

P: --

Turkey Manufacturing PMI (Dec)

--

F: --

P: --

Italy Manufacturing PMI (SA) (Dec)

--

F: --

P: --

Euro Zone Manufacturing PMI Final (Dec)

--

F: --

P: --

Euro Zone M3 Money Supply (SA) (Nov)

--

F: --

P: --

Euro Zone 3-Month M3 Money Supply YoY (Nov)

--

F: --

P: --

Euro Zone Private Sector Credit YoY (Nov)

--

F: --

P: --

Euro Zone M3 Money Supply YoY (Nov)

--

F: --

P: --

U.K. Manufacturing PMI Final (Dec)

--

F: --

P: --

India Deposit Gowth YoY

--

F: --

P: --

Brazil IHS Markit Manufacturing PMI (Dec)

--

F: --

P: --

U.S. MBA Mortgage Application Activity Index WoW

--

F: --

P: --

Canada Manufacturing PMI (SA) (Dec)

--

F: --

P: --

U.S. IHS Markit Manufacturing PMI Final (Dec)

--

F: --

P: --

Mexico Manufacturing PMI (Dec)

--

F: --

P: --

U.S. Weekly Treasuries Held by Foreign Central Banks

--

F: --

P: --

Philadelphia Fed President Henry Paulson delivers a speech
Japan Manufacturing PMI Final (Dec)

--

F: --

P: --

China, Mainland Caixin Composite PMI (Dec)

--

F: --

P: --

China, Mainland Caixin Services PMI (Dec)

--

F: --

P: --

Indonesia Trade Balance (Nov)

--

F: --

P: --

Indonesia Core Inflation YoY (Dec)

--

F: --

P: --

Indonesia Inflation Rate YoY (Dec)

--

F: --

P: --

Saudi Arabia IHS Markit Composite PMI (Dec)

--

F: --

P: --

Q&A with Experts
    • All
    • Chatrooms
    • Groups
    • Friends
    ANor Epys flag
    HFM
    rawa ronte flag
    ANor Epys
    HFM
    @ANor EpysWow, that's the same thing... but why is the chart still moving in the trading view?
    ANor Epys flag
    What do you use? This is Fastbull, so I'm curious about BeeMarket.
    ANor Epys flag
    rawa ronte
    @rawa ronteYes, it may be different for each broker, but it's not a problem.
    3207570 flag
    Buy Gold limit 4404 to next resistance .. thank me later
    ANor Epys flag
    Yes, okay, I have 2 strong buyer zones in that area.
    rawa ronte flag
    3207570
    Buy Gold limit 4404 to next resistance .. thank me later
    @Pengunjung3207570how can I buy... my broker is closed😅
    rawa ronte flag
    ANor Epys
    Yes, okay, I have 2 strong buyer zones in that area.
    @ANor EpysHow much can I buy it for?
    V0EDWL8NGW flag
    btc running profit
    Anh Minh flag
    Can someone explain this to me?
    Freddy94_ flag
    ANor Epys
    Yes, okay, I have 2 strong buyer zones in that area.
    @ANor Epys show me screenshot my friend
    Freddy94_ flag

    Freddy94_

    ID: 1815108

    Share Chart:XAUUSD, H1
    Chart
    EVMKQR7N0G flag
    hello
    luigi flag
    EVMKQR7N0G
    hello
    @EVMKQR7N0Ghi
    luigi flag
    happy new year
    Johnson Le flag
    Happy new year
    Gerald flag
    happy new year 🕛
    王涵 flag
    Why is the chart not moving?
    2953273 flag
    hello
    Raktim flag
    hi
    Type here...
    Add Symbol or Code

      No matching data

      All
      Trump Updates
      Recommend
      Stocks
      Cryptocurrencies
      Central Banks
      Featured News
      • All
      • Russia-Ukraine Conflict
      • Middle East Flashpoint
      • All
      • Russia-Ukraine Conflict
      • Middle East Flashpoint
      Search
      Products

      Charts Free Forever

      Chats Q&A with Experts
      Screeners Economic Calendar Data Tools
      Membership Features
      Data Warehouse Market Trends Institutional Data Policy Rates Macro

      Market Trends

      Market Sentiment Order Book Forex Correlations

      Top Indicators

      Charts Free Forever
      Markets

      News

      News Analysis 24/7 Columns Education
      From Institutions From Analysts
      Topics Columnists

      Latest Views

      Latest Views

      Trending Topics

      Top Columnists

      Latest Update

      Signals

      Copy Rankings Latest Signals Become a signal provider AI Rating
      Contests
      Brokers

      Overview Brokers Assessment Rankings Regulators News Claims
      Broker listing Forex Brokers Comparison Tool Live Spread Comparison Scam
      Q&A Complaint Scam Alert Videos Tips to Detect Scam
      More

      Business
      Events
      Careers About Us Advertising Help Center

      White Label

      Data API

      Web Plug-ins

      Affiliate Program

      Awards Institution Evaluation IB Seminar Salon Event Exhibition
      Vietnam Thailand Singapore Dubai
      Fans Party Investment Sharing Session
      FastBull Summit BrokersView Expo
      Recent Searches
        Top Searches
          Markets
          News
          Analysis
          User
          24/7
          Economic Calendar
          Education
          Data
          • Names
          • Latest
          • Prev

          View All

          No data

          Scan to Download

          Faster Charts, Chat Faster!

          Download App
          English
          • English
          • Español
          • العربية
          • Bahasa Indonesia
          • Bahasa Melayu
          • Tiếng Việt
          • ภาษาไทย
          • Français
          • Italiano
          • Türkçe
          • Русский язык
          • 简中
          • 繁中
          Open Account
          Search
          Products
          Charts Free Forever
          Markets
          News
          Signals

          Copy Rankings Latest Signals Become a signal provider AI Rating
          Contests
          Brokers

          Overview Brokers Assessment Rankings Regulators News Claims
          Broker listing Forex Brokers Comparison Tool Live Spread Comparison Scam
          Q&A Complaint Scam Alert Videos Tips to Detect Scam
          More

          Business
          Events
          Careers About Us Advertising Help Center

          White Label

          Data API

          Web Plug-ins

          Affiliate Program

          Awards Institution Evaluation IB Seminar Salon Event Exhibition
          Vietnam Thailand Singapore Dubai
          Fans Party Investment Sharing Session
          FastBull Summit BrokersView Expo

          Gold And Silver Outlook For 2026: Why Hard Assets May Beat Stocks

          Justin

          Stocks

          Summary:

          Gold's upside case into 2026 is increasingly driven by structural demand—central-bank buying and reserve diversification—pushing price targets toward the $5,000–$6,000 range.Silver remains the laggard despite a multi-year supply deficit, leaving room for an outsized catch-up rally if gold stays supported.S&P 500 upside targets cluster in the 7,100–8,000 range, but most forecasts rely on strong earnings growth and a supportive Fed—conditions that leave little margin for disappointment.

          That old line — you either own paper or you own hard assets — made sense in a world where inflation cycles were shorter, balance sheets were smaller, and capital still respected gravity. I heard it constantly when I started in this business back in 1982. You picked a side. Paper meant you thought growth was coming. Hard assets meant you thought trouble was coming.

          What's changed is not the rule, but the environment it operates in.

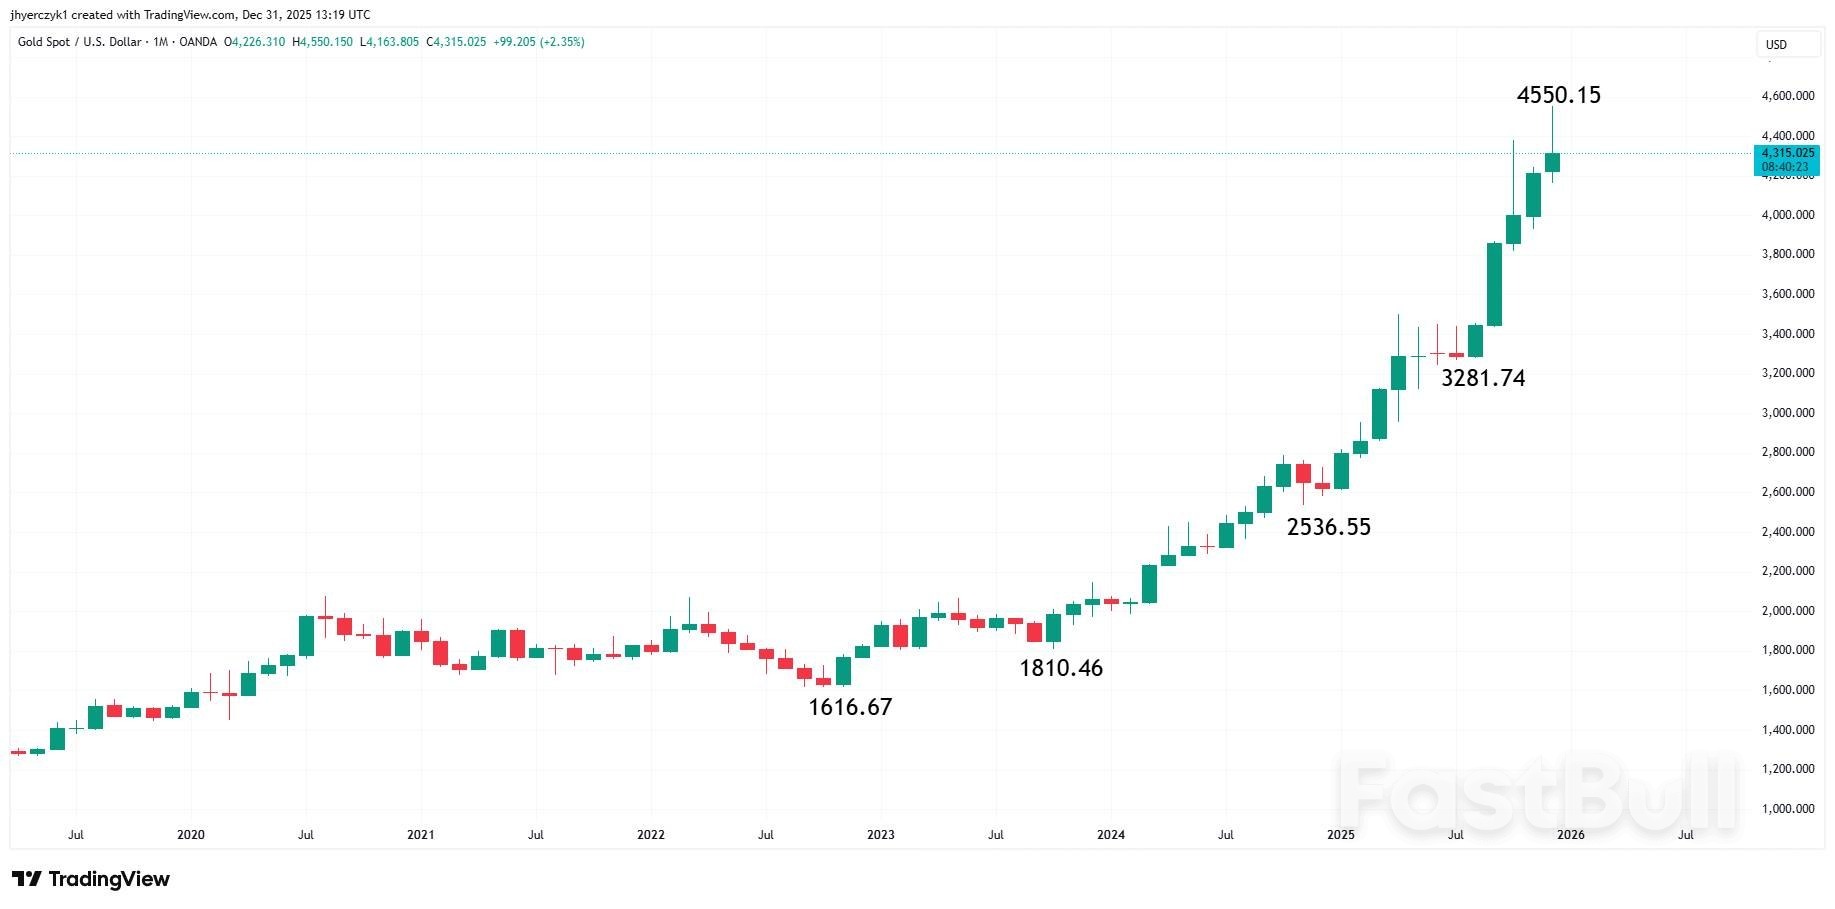
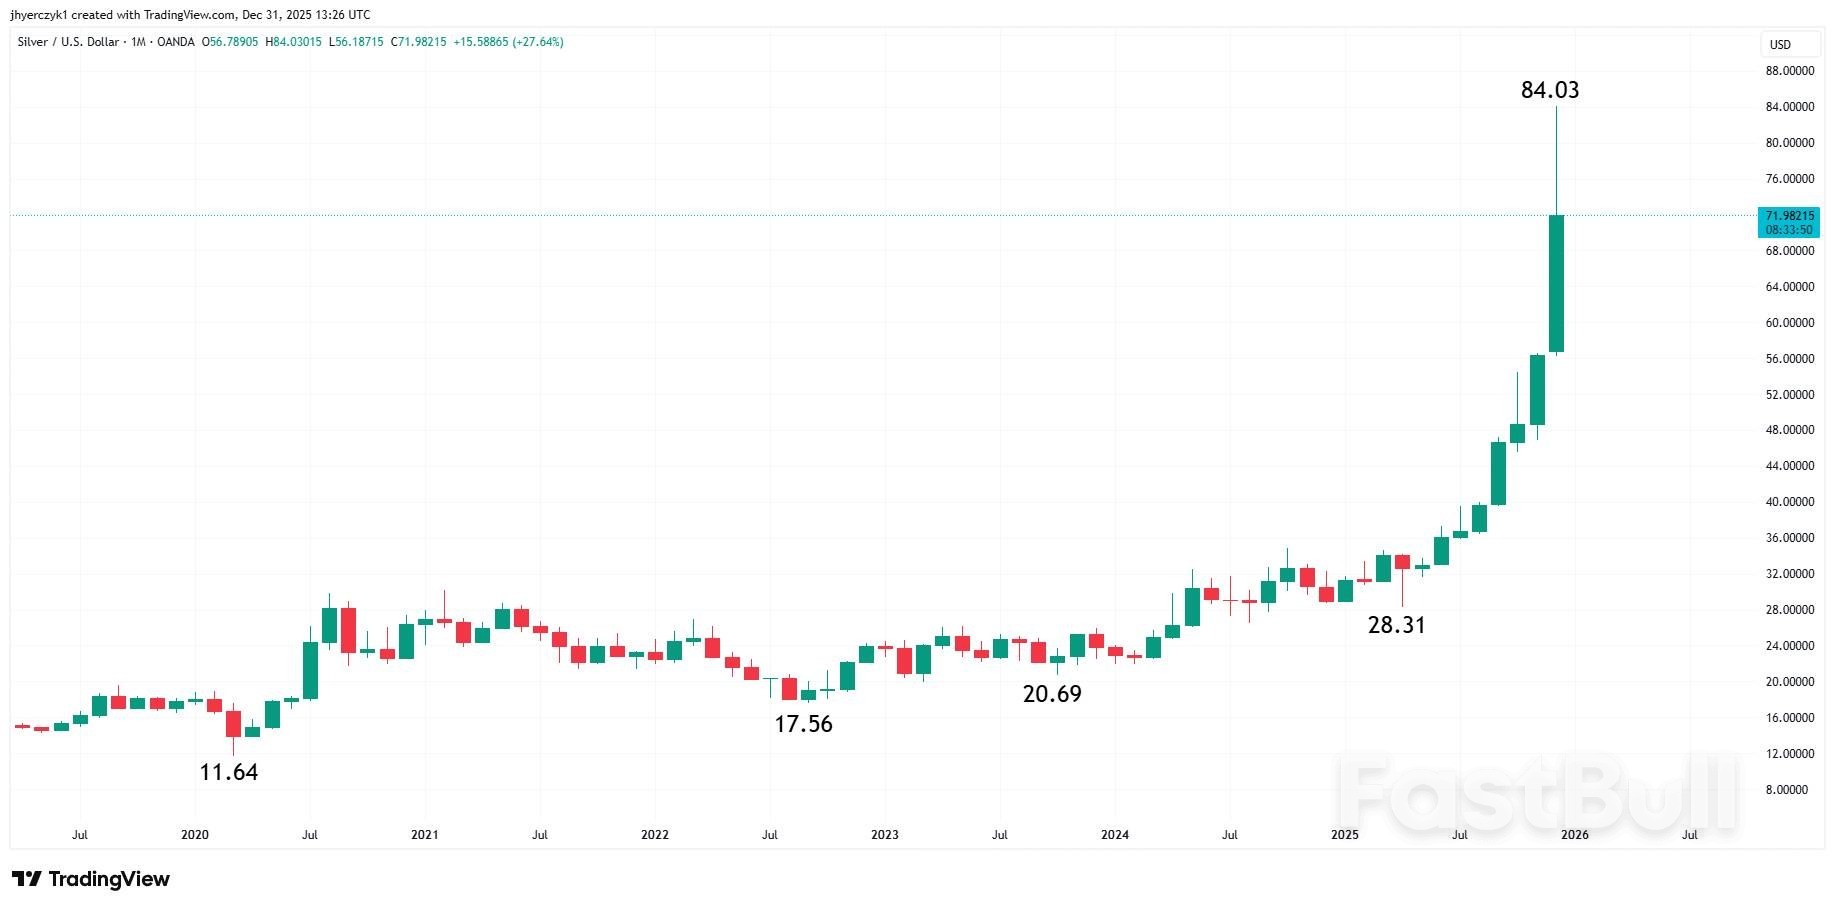
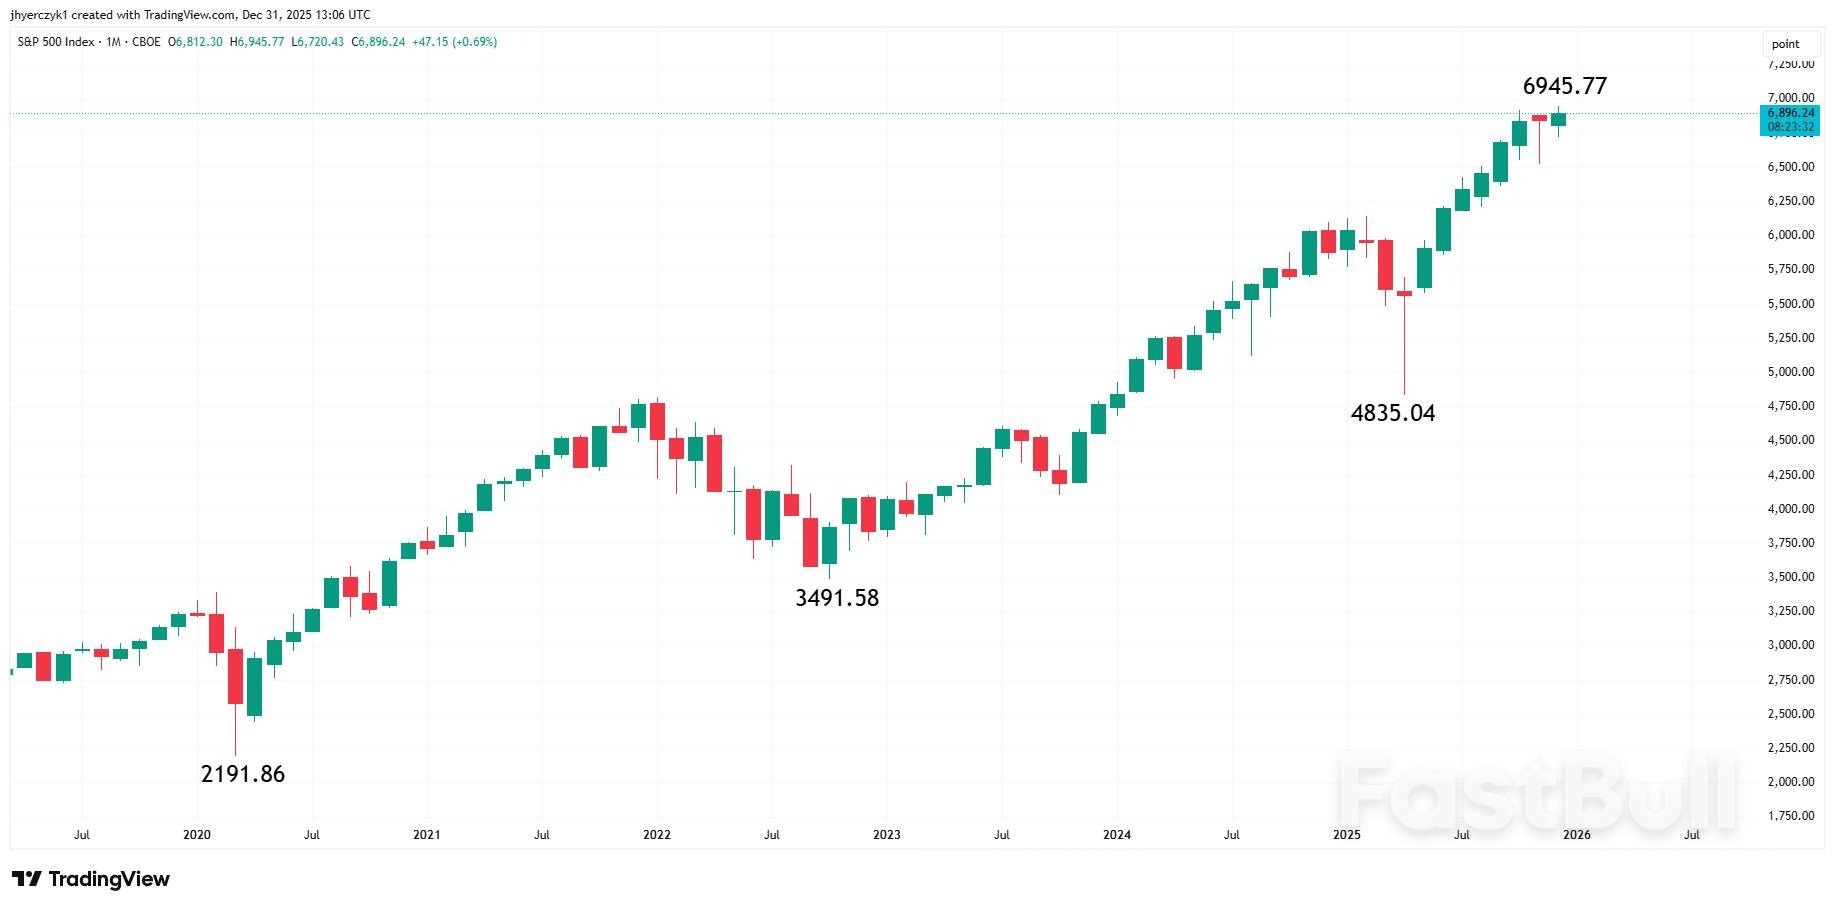
          As we head into the final stretch of 2025, both stocks and precious metals are trading near record highs. The S&P sits around 6,900. Gold is testing $4,600. Silver touched $84. But if you look at where the real conviction is right now — not the hope, the actual targets — the metal guys are a lot more certain than the equity guys.

          Richmond Lee, CFA and Senior Market Analyst at PU Prime commented:

          As markets move toward the final stretch of 2025, a striking divergence is emerging between financial assets and hard assets. Both U.S. equities and precious metals are trading near record highs, yet the degree of conviction behind future expectations differs materially. While equity forecasts remain conditional and tightly range-bound, projections for gold and silver continue to move higher with growing confidence.

          In precious metals, the narrative has become increasingly structural. Major institutions such as JPMorgan and Bank of America have lifted gold targets toward the 5,000 to 6,000 dollar range over the next two years, citing sustained central bank diversification, currency debasement, and long-term demand resilience. These forecasts are not framed as short-term trades, but as part of a longer regime shift in global reserve management. Gold now represents a larger share of central bank reserves than U.S. Treasuries for the first time in decades, reinforcing the idea of a structural reallocation rather than a cyclical move.

          Silver's case appears even more asymmetric. Prices have already exceeded many bank forecasts, forcing analysts to revise models upward as the market enters price discovery. Persistent supply deficits, combined with rising industrial demand from solar, electric vehicles, and data centers, leave little room for complacency. Unlike gold, silver's dual role as a monetary and industrial metal amplifies upside during periods of strong demand.

          Equities, by contrast, face a narrower margin for error. Wall Street targets for the S&P 500 cluster between 7,100 and 8,000, implying mid to low double-digit upside that depends on strong earnings growth, stable inflation, and supportive monetary policy. Valuations remain elevated, meaning disappointment rather than crisis could be enough to pressure returns.

          Looking into 2026, the contrast is clear. Equities require near-perfect execution, while metals simply require existing structural trends to persist. In the current macro regime, capital appears increasingly aligned with the latter.

          The Metal Bulls Keep Raising Targets

          JPMorgan's Natasha Kaneva isn't hedging. $5,000 gold by year-end 2026, heading toward $5,400 in 2027.

          "While this rally in gold has not, and will not, be linear, we believe the trends driving this rebasing higher in gold prices are not exhausted," Kaneva said. "The long-term trend of official reserve and investor diversification into gold has further to run."

          Ed Yardeni — whose calls have been right often enough that people listen — sits at $6,000 gold by the end of 2026, with $10,000 by the end of the decade. Bank of America is at $5,000.

          That's a directional consensus: $5,000 to $6,000. Even from today's levels, that's 10% to 30% upside. And the forecasts keep getting revised higher as the rally continues.

          Monthly Spot Gold (XAUUSD). Source: TradingView

          Silver? Wall Street Can't Keep Up.

          Silver is making a mockery of the forecasts. Most of the major bank targets for year-end 2026 have already been blown through.

          The problem isn't that analysts got it wrong. It's that they're scrambling to catch up with a market that's in price discovery mode. Citi's more aggressive models point toward $110 in the second half of 2026. Technical analysts are talking about $100-plus if the gold-to-silver ratio compression continues.

          Steven Orrell at OCM Gold Fund explained what's happening: "Historically, silver tends to lag gold early in a bull run and then experiences sharp catch-up rallies, which is what we're seeing now."

          That's the pattern playing out in real time. Silver doesn't follow gold — it amplifies gold. And when Wall Street's year-end targets are already behind the spot price, you're not in a normal bull market anymore. You're in a structural repricing.

          Monthly Spot Silver (XAGUSD). Source: TradingView

          The equity guys? They're hoping.

          Deutsche Bank has the highest target on the Street: 8,000 on the S&P 500. That's roughly 15% upside from current levels.

          Goldman Sachs sits at 7,600, forecasting $305 in earnings per share — 12% growth.

          JPMorgan's baseline is 7,500, with upside to 8,000 if the Fed cuts more aggressively. But listen to how Dubravko Lakos-Nujas frames it: "Despite AI bubble and valuation concerns, we see current elevated multiples correctly anticipating above-trend earnings growth, an AI capex boom, rising shareholder payouts and easier fiscal policy."

          Despite bubble concerns. That's not conviction. That's hope that valuations don't matter because earnings will bail everyone out.

          Bank of America is more honest. 7,100 target. $310 in earnings. But here's what matters:

          "Multiple expansion and earnings growth both pushed the S&P 500 up 15% this year. In 2026, earnings will do the lift with about 10pt PE contraction."

          Translation: don't expect the market to get more expensive. Expect it to get cheaper, and hope earnings growth offsets the valuation decline.

          The range across Wall Street: 7,100 to 8,000. That's 5% to 15% upside, and every forecast comes with conditions attached.

          Monthly S&P 500 Index (SPX). Source: TradingView

          Goldman's number "assumes strong profit growth, stable inflation, and rate cuts starting in mid-2026."

          Ned Davis Research sits at just 7,000 — barely 3% higher than today. Ed Clissold told CNBC he worries investors are on a "sugar high" and that changing Fed leadership in May could create volatility.

          One analyst put it bluntly: "At current valuation levels, stocks don't need a crisis to fall; they only need disappointment."

          This Isn't a Cycle. It's a Regime.

          I've been in this business for 43 years. I know what conviction looks like.

          When JPMorgan talks about a "long-term trend of official reserve diversification" that has "further to run," they're not talking about a six-month trade. They're talking about something structural.

          Ben McMillan at IDX Advisors called it what it is: "After Covid is when we started seeing central banks really step up buying gold to an unprecedented level, and it hasn't really waned. That was kind of a structural shift, not a shift along the demand curve for gold; that's a regime change."

          A regime change.

          For the first time since 1996, gold now accounts for a larger share of central bank reserves than U.S. Treasuries. That's not a trend line. That's a tectonic shift in how sovereign wealth views risk.

          Gold ETFs posted a record $26 billion inflow in Q3 2025 alone. Silver has been in a structural supply deficit for five consecutive years. Solar, EVs, AI data centers — they all need silver, and there's no substitute that performs as well.

          Meanwhile, the S&P 500 is trading at a forward P/E around 22 to 23 times earnings — well above the historical average of 15.3x. The bull case for stocks requires everything to go right: strong GDP, stable inflation, margin expansion, no policy mistakes, AI spending that actually translates to profits.

          The bull case for metals requires one thing: that central banks keep doing what they've been doing.

          The Setup for 2026

          Stocks could deliver 7%, 10%, maybe 12% if everything breaks right. But they could just as easily go sideways or down 10% if anything disappoints — and at these valuations, the margin for error is thin.

          Gold and silver? The structural drivers — currency dilution, central bank buying, supply deficits — aren't going away. The downside is limited. The upside is wide open.

          The stock guys are penciling in single-digit to low-teens returns if the stars align.

          The metal guys are already revising targets higher because the foundation shifted underneath the market.

          After watching every major turn since Volcker broke inflation's back, I've learned one thing: when equity forecasts come with asterisks and metal forecasts keep getting raised mid-cycle, the metals win.

          Stocks need perfect execution. Metals just need the system to keep being the system.

          I know which bet I'd take.

          Source: FX Empire

          Risk Warnings and Disclaimers
          You understand and acknowledge that there is a high degree of risk involved in trading. Following any strategies or investment methods may lead to potential losses. The content on the site is provided by our contributors and analysts for information purposes only. You are solely responsible for determining whether any trading assets, securities, strategy, or any other product is suitable for investing based on your own investment objectives and financial situation.
          Add to Favorites
          Share

          FTSE 100 at a new high📈 Those 3 sectors are powering UK stocks

          Adam

          Stocks

          UK FTSE100 index hit historic high yesterday, driven by mining and metals sectors and aerospace & defense. London stocks are slightly lower today, with the FTSE 100 expected to give back a small portion of its strong year-to-date run after hitting fresh records on Tuesday 30 December. The rally in 2025 has been powerful. The FTSE 100 is up roughly 22% year-to-date, following a more modest appx. 5% gain in 2024.
          Precious metal miners have been standout winners, led by Fresnillo, which is up roughly five-fold this year on the back of surging commodity prices. Fresnillo also hit a record high on Tuesday, underscoring how dominant the metals theme has been.
          Aerospace and defence stocks have enjoyed a strong year, with Babcock and Rolls-Royce roughly doubling and BAE Systems up around 50%. The sector remains supported by broader geopolitical trends and rising defence spending.
          UK banks have also contributed significantly to performance: LLoyds and Barclays gained almost 80% while Standard Chartered and HSBC gained 85% and 50% respectively
          Will FTSE100 outperform UK mid and small stocks?
          2026 is increasingly looking like another year where the FTSE 100 beats the FTSE 250. The large-cap index has the wind at its back, while UK-focused mid-caps face a tougher domestic backdrop.
          The performance gap is already massive. Over the last five years, the FTSE 100 is up roughly 50%, around five times more than the FTSE 250.
          The “UK reopening” story that helped the FTSE 250 in 2021 is gone, back then, the domestically-driven index benefited from post-lockdown momentum — but heading into 2026, there’s no similar feel-good catalyst.
          Both indices show similar earnings growth expectations (~9%), but the risk profile isn’t equal, the FTSE 250 looks more exposed to earnings downgrades given signs of weakness in the UK economy.
          UK consumer data is a warning signal; Barclays data suggests UK households are entering 2026 on a weaker footing, which doesn’t bode well for the more domestic FTSE 250.
          The FTSE 100’s structure is simply more attractive right now; it leans more international and defensive (with sectors like health care), which tends to hold up better when economic momentum softens.
          Even for mid-cap exposure, the FTSE 250 doesn’t stack up well versus Europe, the index lags European peers in expected earnings growth next year.
          Bloomberg Intelligence expects FTSE 100 earnings momentum to stay stronger than the Stoxx 600, which strenghthens the case for large-cap UK exposure vs broader Europe.
          Mining exposure is a major wildcard advantage for the FTSE 100, and if metals keep rallying, FTSE 100 names may benefit disproportionately. Fresnillo has already surged ~450% year-to-date, underlining how powerful this theme can be.
          Rising global defense spending continues to favor names like BAE Systems and Rolls-Royce, adding structural support to the FTSE 100.
          Limited room for BOE cuts is a tailwind for FTSE 100 banks. That setup tends to favor bank-heavy exposure, while it works against the FTSE 250’s heavier weighting in interest-rate-sensitive real estate.

          UK100 (D1 interval)

          FTSE 100 at a new high📈 Those 3 sectors are powering UK stocks_1

          Source: xtb

          Risk Warnings and Disclaimers
          You understand and acknowledge that there is a high degree of risk involved in trading. Following any strategies or investment methods may lead to potential losses. The content on the site is provided by our contributors and analysts for information purposes only. You are solely responsible for determining whether any trading assets, securities, strategy, or any other product is suitable for investing based on your own investment objectives and financial situation.
          Add to Favorites
          Share

          US Markets Reveal Wide YTD Dispersion Beneath Strong Headline Equity Returns

          Adam

          Economic

          YTD returns across major U.S. asset classes continue to reflect a highly concentrated market. The Finviz chart below does a nice job illustrating YTD returns across a wide array of futures contracts. Large-caps dominate YTD equity returns, while small- and mid-cap stocks lag amid tighter financial conditions and slower earnings growth.
          Outside of equities, YTD returns have been more muted. Bonds have stabilized as yields eased from their highs, offering modest diversification benefits, while cash remains competitive thanks to elevated short-term rates. Commodities and real assets have delivered mixed YTD returns as global growth slows and inflation pressures fade.
          The takeaway is clear: YTD returns viewed at a high level mask wide dispersion beneath the surface, making positioning and diversification far more critical than broad market exposure.
          US Markets Reveal Wide YTD Dispersion Beneath Strong Headline Equity Returns_1
          Fed Minutes Point to a Slower Path for Rate Cuts
          Minutes from the Fed’s December meeting show policymakers growing more cautious about cutting rates further in early 2026. Several officials noted that the decision to ease in December was “finely balanced,” with some preferring to hold rates steady as inflation progress shows signs of stalling.
          While labor market conditions have softened, economic growth and consumer spending remain resilient, complicating the policy outlook. As a result, many participants favored keeping rates unchanged for “some time” while assessing incoming data. That stance aligns with the Fed’s projections, which point to a slower and more data-dependent path for future cuts.

          Source: investing

          To stay updated on all economic events of today, please check out our Economic calendar
          Risk Warnings and Disclaimers
          You understand and acknowledge that there is a high degree of risk involved in trading. Following any strategies or investment methods may lead to potential losses. The content on the site is provided by our contributors and analysts for information purposes only. You are solely responsible for determining whether any trading assets, securities, strategy, or any other product is suitable for investing based on your own investment objectives and financial situation.
          Add to Favorites
          Share

          Oil News: Oil Demand Concerns Persist Despite Geopolitical Supply Disruption Fears

          Adam

          Commodity

          Crude Edges Higher in Thin Holiday Trade After 61.8% Rebound From December Low

          Light crude oil futures are inching higher on Wednesday on below average volume. The price action suggests traders may have packed it in for the New Year’s holiday.
          The month began with a steep drop from $60.36 on December 5 to $54.84 by December 16. Since that low was reached, however, prices have rebounded more than 61.8% to $58.88 on December 26 before pulling back to $56.65 the same day.

          Geopolitical Tensions Drive Short-Covering Rally Amid Bearish Supply Outlook

          The sell-off was fueled by a bearish supply outlook, while the rebound represents short-covering tied to escalating tensions between Russia and Ukraine, and the United States and Venezuela. Shorts took protection out of fear of a supply disruption. Tensions between Saudi Arabia and Yemen also contributed to the bid in the market this holiday-shortened week.

          Key Technical Levels: 50-Day MA at $58.78 Holds Cards for Direction

          Oil News: Oil Demand Concerns Persist Despite Geopolitical Supply Disruption Fears_1Daily Light Crude Oil Futures

          Today, traders will be looking for support at the first 50% level at $57.60. If that fails, they will likely lean on $56.86 to $56.65.
          On the upside, the resistance zone is $58.62 to $59.51. Inside this area is the 50-day moving average at $58.78. It is both resistance and a potential trigger point for an acceleration to the upside. More importantly, it is my short-term trend indicator.
          A breakout over the 50-day MA may not be enough to fuel a strong rally into the 200-day MA at $60.45. I think we are going to need to see a recovery and a support base built above the 50-day MA before we can be confident there are real buyers in there driving the price action.
          But for a bullish technical outlook to align with a bullish fundamental outlook, the supply/demand fundamentals are going to have to change. At this time, they are bearish because of oversupply. A supply disruption could alleviate some of this pressure, but disruptions tend to be short-term in nature.

          WTI Set for 19% Annual Decline as Oversupply Dominates Year-End Action

          Early expectations for 2026 are bearish, but with lingering geopolitical tensions propping up prices. Oil prices may be close to unchanged today, but for the year, they are set to fall more than 15%. Oversupply was the major concern throughout the year, driving prices lower until the nearby futures contract hit its lowest level since 2021 in December.
          Reuters is reporting that Light crude oil futures are down nearly 18% for the year, their most substantial annual percentage decline since 2020. Brent is also on track to finish a third year of losses, their longest-ever losing streak. West Texas Intermediate (WTI) crude, also known as Light Crude Oil, is headed for a 19% annual decline.

          2026 Forecast: Bearish Q1 Followed by Recovery, OPEC Cuts Limit Downside

          My outlook for 2026 calls for lower prices in the first quarter, with WTI hovering near $55.00 to $50.00 per barrel, then a recovery later in the year to $60.00 to $65.00.
          Volatility is likely to be skewed to the upside because of the possibility of an escalation in the geopolitical issues and the possibility of a prolonged supply disruption.
          What this means is that I don’t see prices falling below $50.00 for a lingering period, but the odds are we could spend some time over $65.00 if supply is disrupted for a long time. I believe that if prices were to fall substantially, OPEC would step in and cut production.

          Source: fxempire

          Risk Warnings and Disclaimers
          You understand and acknowledge that there is a high degree of risk involved in trading. Following any strategies or investment methods may lead to potential losses. The content on the site is provided by our contributors and analysts for information purposes only. You are solely responsible for determining whether any trading assets, securities, strategy, or any other product is suitable for investing based on your own investment objectives and financial situation.
          Add to Favorites
          Share

          30 Numbers From 2025 That Are Almost Too Crazy To Believe

          Devin

          Economic

          2025 has truly been a historic year. No matter which side of the fence that you are on, nobody can deny that we have witnessed seismic political changes over the last 12 months. Meanwhile, the AI revolution is transforming our lives in ways that we don't even understand. But despite all of our advanced technology, we can't stop the endless barrage of natural disasters that has been pummeling us in 2025, and hunger continues to spread all over the globe. Of course war has been a major theme from the very beginning of the year to the very end of the year. Humanity has been facing one major crisis after another, and people are steadily getting angrier and more frustrated.

          Our world is changing at a pace that is absolutely breathtaking.

          If you always wanted to live in "interesting" times, you have certainly gotten your wish.

          The following are 30 numbers from 2025 that are almost too crazy to believe…

          #1 As 1999 began, a Gallup survey found that 70 percent of Americans were satisfied with how things were going in the United States. As 2025 ends, only 24 percent of Americans are satisfied with how things are going in the United States.

          #2 In 1980, the fact that the U.S. national debt had reached a trillion dollars was a really big deal. But now our national debt has surpassed the 38 trillion dollar mark and there is seemingly no end in sight.

          #3 Globally, the total amount of debt in the world has reached an almost unbelievable total of 337 trillion dollars.

          #4 In 2025, more than half of all of the nations on the entire planet were either directly involved in military conflict or were funding it.

          #5 At the start of 2025, you could purchase an ounce of silver for about 30 dollars. As 2025 ends, an ounce of silver will cost you more than 70 dollars.

          #6 Crypto investors lost about $800,000,000,000 during the month of November alone.

          #7 After all this time, the Department of Justice is claiming that they have just "discovered" a million more Epstein documents.

          #8 In 2025, researchers in the United States and South Korea developed a version of the bird flu that has a 100 percent death rate in mammals.

          #9 According to the latest National Customer Rage Survey, 77 percent of U.S. consumers say that they have had a product or service problem within the last 12 months. That is a brand new all-time record high.

          #10 Earlier this year, we witnessed 494 earthquakes of magnitude 5.0 or greater within a 30 day period. That was about 4 times as many earthquakes of magnitude 5.0 or greater than we normally experience in a typical month.

          #11 Globally, natural disasters caused a total of $120,000,000,000 in economic damage in 2025.

          #12 The number of Americans that are dealing with food insecurity has almost doubled since 2021.

          #13 The United Nations is warning that nearly 10 percent of the entire population of the globe is now going to bed hungry each night.

          #14 Approximately 1.2 million foreign students are currently attending colleges and universities in the United States. How many U.S. students have been denied admission in order to make room for those students at our best schools?

          #15 In 2019, you could get a cheeseburger at McDonald's for a dollar. Today, the average price of a cheeseburger at McDonald's is $3.15.

          #16 Since 2019, the annual income needed to afford a median-priced home in rural U.S. counties has more than doubled.

          #17 According to a survey that was conducted by PNC Bank, 67 percent of U.S. workers are now living paycheck to paycheck.

          #18 Investopedia has determined that it now takes approximately 5 million dollars to live the American Dream over the course of a lifetime.

          #19 One study discovered that approximately 42 percent of Americans that belong to Generation Z have been diagnosed with "anxiety, depression, ADHD, PTSD" or some other mental health condition.

          #20 One recent survey found that 70 percent of U.S. adults are currently taking at least one pharmaceutical drug, and nearly a quarter of U.S. adults are currently taking at least four pharmaceutical drugs.

          #21 According to the CDC, an American now dies by suicide every 11 minutes.

          #22 Approximately 20 percent of high school students in the United States have had a relationship with an AI chatbot.

          #23 One recent survey found that almost two-thirds of all church leaders that prepare sermons "use AI tools in their sermon writing process".

          #24 Well over 50 percent of the global population lives in a nation where Christians are being violently persecuted.

          #25 U.S. farmers are facing the worst economic downturn that they have experienced in at least 50 years.

          #26 The size of the U.S. cattle herd has dropped to the lowest level in about 75 years.

          #27 According to Challenger, Gray & Christmas, U.S. employers have announced a grand total of almost 1.2 million job cuts in 2025.

          #28 The McKinsey Global Institute is warning that approximately 40 percent of all U.S. workers could potentially be replaced by AI.

          #29 In more than 50 percent of the nations on the entire planet, the total fertility rate is now below replacement level.

          #30 A recent YouGov survey discovered that nearly half of the U.S. population believes that a nuclear war is likely within the next 10 years.

          The pace of global events has accelerated significantly over the past year.

          It really does feel like we are building up to some sort of a crescendo.

          We are living at a time of a "perfect storm", and we just keep getting hammered by one crisis after another.

          As a result, much of the population has become numb to it all.

          Never before in human history have we been subjected to such an emotional overload.

          When you are being pulled in so many directions emotionally, it can be really easy to give in to the temptation to go numb.

          But I would encourage my readers not to do that.

          It is when times are the darkest that light is needed the most.

          As things get even darker in 2026, choose to be a light to those around you.

          All of human history has been building up to this time, and we get to be here for it.

          There is nowhere else that I would rather be than right here, and there is no other time that I would have rather lived than right now.

          Don't let all of the chaos that is going on all around us get you down.

          You were born for such a time as this, and now is the time to become everything that you were created to be.

          Source: Zero Hedge

          To stay updated on all economic events of today, please check out our Economic calendar
          Risk Warnings and Disclaimers
          You understand and acknowledge that there is a high degree of risk involved in trading. Following any strategies or investment methods may lead to potential losses. The content on the site is provided by our contributors and analysts for information purposes only. You are solely responsible for determining whether any trading assets, securities, strategy, or any other product is suitable for investing based on your own investment objectives and financial situation.
          Add to Favorites
          Share

          Engine of markets and US growth: AI steamrolled everything

          Adam

          Economic

          2025's performance is barely believable when you remember how Wall Street started the year, hit head-on by Donald Trump's tariffs. In early April, the S&P 500 even briefly slipped into a bear market (a 20% correction from peak to trough). A few months later, Donald Trump slightly eased the tariffs bill. And above all, US companies kept investing aggressively in artificial intelligence.
          All-in
          Capex by the five largest hyperscalers (Amazon, Alphabet, Meta, Microsoft and Oracle) is expected to reach nearly $400 billion in 2025. And that figure is set to rise in the years ahead. The central question now is return on investment.
          At this stage, the market seems fairly confident on that front. The cloud businesses of Amazon, Microsoft and Google (the three main players in this market) continue to grow rapidly. In the latest quarter, Azure's growth (Microsoft) was 40%, AWS's 20%, and Google's 32%. Those are striking numbers for companies whose market capitalizations are measured in trillions of dollars.
          Despite these growth rates, concerns about return on investment are legitimate. But the hyperscalers keep arguing they need to accelerate, that the main risk is under-investing, and that their main problem is a lack of capacity (data centers, chips…). It all feels a bit like venture-capital logic: you go for it because there is a lot to win at the end, even if some investments do not pay off.
          All the more so because these companies remain cash machines. And so the cost of being wrong is not that high. A recent example illustrates this perfectly: the metaverse. It was Facebook's big bet, and the company even renamed itself Meta in late 2021. It was more of a failure because, according to Financial Times calculations, the Reality Labs division would have lost nearly $70 billion cumulatively by the end of 2024. Yet that failed pivot only cost the company 12 to 18 months in the market wilderness. A few quarters in which the stock was dead money (no one wanted it anymore), before the AI train put the company back on track.
          Do not forget to return the money
          But that last point may no longer be so obvious, and the market has not yet realized it. For about a decade, these stocks have been investor darlings, mainly for two reasons: they are asset light (companies with few physical assets and therefore not burdened by the investments that come with them) and they are cash machines, able to return tens of billions through share buybacks.
          But does the AI shift not make that investment thesis obsolete? Because now, hundreds of billions of dollars must be spent to build physical infrastructure, namely data centers. Capital expenditures amortized over several years. But most of the investments are Nvidia chips, consumables that will likely need to be replaced fairly quickly. The hyperscalers believe server lifespans could run up to six years, which is far from obvious.
          All of this raises the question of shareholder returns. Will it be possible to roll out large share buyback programs again if the vast majority of cash flows must fund capital expenditures? According to BofA calculations, nearly 70% of hyperscalers' cash flow will be swallowed by capex this year and 80% next year. Over the previous ten years, it was more like 30% to 50%.
          Engine of markets and US growth: AI steamrolled everything_1
          In the same boat
          These companies therefore now have to turn to debt, which was not the case in the past. At the end of September, Oracle issued $18 billion in bonds; Meta raised $30 billion in late October; Alphabet $25 billion in early November; and Amazon announced in mid-November its intention to raise $15 billion. Nothing dramatic for companies with extremely strong balance sheets, but it is still a sign they need to seek financing elsewhere, that they are no longer able to shoulder all investments on their own.
          Beyond the amounts to finance and the growing reliance on debt, it is the circular nature of this ecosystem that raises questions: customers financing their suppliers, equity stakes taken in every direction… And in the middle of all that, one player: OpenAI, which is not profitable but whose funding needs are estimated at $1.4 trillion by 2029.
          Engine of markets and US growth: AI steamrolled everything_2
          The ecosystem's circularity may be the main risk. Because then, a slowdown at one player can turn into a vicious circle. But for now, the circle is virtuous. One firm's capex becomes another's revenue, and growth is there. Valuations are pricing in a bright future for everyone, and artificial intelligence carried the S&P 500 this year to the doorstep of 7,000 points and the Nasdaq beyond 25,000 points.
          A K-shaped economy
          And it is not just Wall Street that is being lifted by artificial intelligence; it is now the main engine of US growth. In the first half of 2025, GDP growth was 1.6%. Growth driven by AI-related investment, whose contribution to growth was 1.4 percentage points in the 1 st quarter and 1.5 points in the second quarter, according to Bank of America estimates.
          Engine of markets and US growth: AI steamrolled everything_3
          In short, excluding AI investment, GDP growth is almost zero over the first half. So there are a few sectors buoyed by the AI boom and the rest of the economy is stagnating. A finding confirmed by the data on capital spending.
          Engine of markets and US growth: AI steamrolled everything_4
          The AI boom has therefore brought back to life a concept that emerged with the Covid pandemic: the K-shaped economy. An economy in which some sectors rebounded strongly while others kept sinking. Today, while the US economy appears to be holding up well, it is in reality an economy in which AI drives investment and consumption depends mainly on the wealthiest slice.
          And the two are linked. The AI boom is driving a surge in equity markets. A surge that translates into an increase in household wealth, especially among the wealthiest, who own the most stocks. And when your wealth rises, you are encouraged to spend more. That is the wealth effect.
          This K-shaped economy concept also explains what we see in opinion polls: a majority of Americans dissatisfied with the economic situation. Despite Wall Street records, and despite strong economic growth. GDP in the third quarter rose 4.3% at an annualized rate. But at the same time, the "current economic conditions" component of the Michigan consumer sentiment index hit its lowest level in ten years in December. Because Americans are facing a cooling labor market (meaning more difficulty finding a job and fewer pay rises) and still-high prices. According to Politico, nearly half of Americans (46%) believe the cost of living is the worst they can remember.

          Source: marketscreener

          To stay updated on all economic events of today, please check out our Economic calendar
          Risk Warnings and Disclaimers
          You understand and acknowledge that there is a high degree of risk involved in trading. Following any strategies or investment methods may lead to potential losses. The content on the site is provided by our contributors and analysts for information purposes only. You are solely responsible for determining whether any trading assets, securities, strategy, or any other product is suitable for investing based on your own investment objectives and financial situation.
          Add to Favorites
          Share

          Russia's Top General Tells Troops To Keep Carving Out 'buffer Zones' In Ukraine

          James Whitman

          Political

          Russia-Ukraine Conflict

          ● Russia's top general visits command post
          ● Says buffer zones inside Ukraine needed to protect adjacent Russian land
          ● Ukraine says such buffer zones represent illegal land grab

          Russia's top general has told troops to keep carving out buffer zones in Ukraine's Sumy and Kharkiv regions in order to protect civilians in Russia's neighbouring Kursk and Belgorod regions from Ukrainian attacks.

          General Valery Gerasimov, chief of the General Staff, made the comments during a visit to a command post belonging to Russia's "North" military grouping, which the Defence Ministry publicised on Wednesday.

          The ministry did not say when Gerasimov made the comments or where the post was located.

          There was no immediate reaction from Ukraine to Gerasimov's comments, but Kyiv has repeatedly condemned Moscow's efforts to carve out buffer zones inside its territory, accusing Russia of using the pretext of security zones to illegally grab more of its territory.

          Ukrainian President Volodymyr Zelenskiy has said Moscow's plans for Sumy and Kharkiv are "mad" and will be resisted as Ukraine defends the two regions.

          Gerasimov said Russian forces had taken control of around 950 square kilometres (366 square miles) in the two provinces, including 32 settlements.

          Reuters could not verify his battlefield assertions.

          Russian President Vladimir Putin affirmed the idea of buffer zones after Ukraine staged a surprise incursion into Russia's Kursk region in August 2024, which Moscow's forces then repelled in months of fierce fighting which saw both sides suffer heavy losses.

          In a Kremlin meeting on December 29, Putin called work to carve out buffer zones very important and said it needed to continue in the new year.

          Source: Reuters

          Risk Warnings and Disclaimers
          You understand and acknowledge that there is a high degree of risk involved in trading. Following any strategies or investment methods may lead to potential losses. The content on the site is provided by our contributors and analysts for information purposes only. You are solely responsible for determining whether any trading assets, securities, strategy, or any other product is suitable for investing based on your own investment objectives and financial situation.
          Add to Favorites
          Share
          FastBull
          Copyright © 2026 FastBull Ltd

          728 RM B 7/F GEE LOK IND BLDG NO 34 HUNG TO RD KWUN TONG KLN HONG KONG

          TelegramInstagramTwitterfacebooklinkedin
          App Store Google Play Google Play
          Products
          Charts

          Chats

          Q&A with Experts
          Screeners
          Economic Calendar
          Data
          Tools
          Membership
          Features
          Function
          Markets
          Copy Trading
          Latest Signals
          Contests
          News
          Analysis
          24/7
          Columns
          Education
          Company
          Careers
          About Us
          Contact Us
          Advertising
          Help Center
          Feedback
          User Agreement
          Privacy Policy
          Personal Information Protection Statement
          Business

          White Label

          Data API

          Web Plug-ins

          Poster Maker

          Affiliate Program

          Risk Disclosure

          The risk of loss in trading financial instruments such as stocks, FX, commodities, futures, bonds, ETFs and crypto can be substantial. You may sustain a total loss of the funds that you deposit with your broker. Therefore, you should carefully consider whether such trading is suitable for you in light of your circumstances and financial resources.

          No decision to invest should be made without thoroughly conducting due diligence by yourself or consulting with your financial advisors. Our web content might not suit you since we don't know your financial conditions and investment needs. Our financial information might have latency or contain inaccuracy, so you should be fully responsible for any of your trading and investment decisions. The company will not be responsible for your capital loss.

          Without getting permission from the website, you are not allowed to copy the website's graphics, texts, or trademarks. Intellectual property rights in the content or data incorporated into this website belong to its providers and exchange merchants.

          Not Logged In

          Log in to access more features

          FastBull Membership

          Not yet

          Purchase

          Become a signal provider
          Help Center
          Customer Service
          Dark Mode
          Price Up/Down Colors

          Log In

          Sign Up

          Position
          Layout
          Fullscreen
          Default to Chart
          The chart page opens by default when you visit fastbull.com