• Trade
  • Markets
  • Copy
  • Contests
  • News
  • 24/7
  • Calendar
  • Q&A
  • Chats
Trending
Screeners
SYMBOL
LAST
BID
ASK
HIGH
LOW
NET CHG.
%CHG.
SPREAD
SPX
S&P 500 Index
6857.13
6857.13
6857.13
6865.94
6827.13
+7.41
+ 0.11%
--
DJI
Dow Jones Industrial Average
47850.93
47850.93
47850.93
48049.72
47692.96
-31.96
-0.07%
--
IXIC
NASDAQ Composite Index
23505.13
23505.13
23505.13
23528.53
23372.33
+51.04
+ 0.22%
--
USDX
US Dollar Index
98.850
98.930
98.850
98.980
98.840
-0.130
-0.13%
--
EURUSD
Euro / US Dollar
1.16569
1.16577
1.16569
1.16590
1.16408
+0.00124
+ 0.11%
--
GBPUSD
Pound Sterling / US Dollar
1.33447
1.33456
1.33447
1.33472
1.33165
+0.00176
+ 0.13%
--
XAUUSD
Gold / US Dollar
4224.48
4224.89
4224.48
4229.22
4194.54
+17.31
+ 0.41%
--
WTI
Light Sweet Crude Oil
59.288
59.325
59.288
59.469
59.187
-0.095
-0.16%
--

Community Accounts

Signal Accounts
--
Profit Accounts
--
Loss Accounts
--
View More

Become a signal provider

Sell trading signals to earn additional income

View More

Guide to Copy Trading

Get started with ease and confidence

View More

Signal Accounts for Members

All Signal Accounts

Best Return
  • Best Return
  • Best P/L
  • Best MDD
Past 1W
  • Past 1W
  • Past 1M
  • Past 1Y

All Contests

  • All
  • Trump Updates
  • Recommend
  • Stocks
  • Cryptocurrencies
  • Central Banks
  • Featured News
Top News Only
Share

Sri Lanka's CSE All Share Index Down 1.2%

Share

Iw Institute: German Economy Faces Tepid Growth In 2026 Due To Global Trade Slowdown

Share

Stats Office - Seychelles November Inflation At 0.02% Year-On-Year

Share

[Market Update] Spot Silver Prices Rose 2.00% Intraday, Currently Trading At $58.27 Per Ounce

Share

S.Africa's Gross Reserves At $72.068 Billion At End November - Central Bank

Share

[Market Update] Spot Silver Broke Through $58/ounce, Up 1.56% On The Day

Share

Dollar/Yen Down 0.33% To 154.61

Share

Kremlin Says No Plans For Putin-Trump Call For Now

Share

Kremlin Says Moscow Is Waiting For USA Reaction After Putin-Witkoff Meeting

Share

Cctv - China, France: Say Both Sides Support All Efforts For A Ceasefire, Restore Peace According To Intl Law

Share

[Chinese Ambassador To The US Xie Feng Hopes Chinese And American Business Communities Will Focus On Three Lists] On December 4, Chinese Ambassador To The US Xie Feng Delivered A Speech At The China-US Economic And Trade Cooperation Forum Jointly Hosted By The China Council For The Promotion Of International Trade And The Meridian International Center. Xie Feng Said That In November 2026, China Will Host The APEC Leaders' Informal Meeting For The Third Time In Shenzhen, Guangdong Province. In December 2026, The United States Will Also Host The G20 Meeting. Regarding How Chinese And American Business Communities Can Seize These Opportunities, He Suggested Focusing On Three Lists: First, Continue To Expand The Dialogue List; Second, Continuously Lengthen The Cooperation List; And Third, Constantly Reduce The Problem List

Share

India's Nifty Financial Services Index Extends Gains, Last Up 0.75%

Share

Eni : Jp Morgan Cuts To Underweight From Overweight

Share

Cctv - China, France: Signed Protocol On Sanitary, Phytosanitary Requirements For Export Of French Alfalfa Grass

Share

India's NIFTY IT Index Last Up 1.3%

Share

India's Nifty 50 Index Rises 0.35%

Share

Israel Sets 2026 Defence Budget At $34 Billion

Share

Russia Says Azov Sea's Port Of Temryuk Damaged In Ukrainian Attack

Share

Israel's Defense Budget For 2026 Will Be 112 Billion Israeli Shekels - Defense Minister Office

Share

One India Rate Panel Member Ram Singh Was Of View That Stance Should Be Changed To 'Accommodative' From 'Neutral' - Monetary Policy Committee Statement

TIME
ACT
FCST
PREV
Turkey Trade Balance

A:--

F: --

P: --

Germany Construction PMI (SA) (Nov)

A:--

F: --

P: --

Euro Zone IHS Markit Construction PMI (Nov)

A:--

F: --

P: --

Italy IHS Markit Construction PMI (Nov)

A:--

F: --

P: --

U.K. Markit/CIPS Construction PMI (Nov)

A:--

F: --

P: --

France 10-Year OAT Auction Avg. Yield

A:--

F: --

P: --

Euro Zone Retail Sales MoM (Oct)

A:--

F: --

P: --

Euro Zone Retail Sales YoY (Oct)

A:--

F: --

P: --

Brazil GDP YoY (Q3)

A:--

F: --

P: --

U.S. Challenger Job Cuts (Nov)

A:--

F: --

P: --

U.S. Challenger Job Cuts MoM (Nov)

A:--

F: --

P: --

U.S. Challenger Job Cuts YoY (Nov)

A:--

F: --

P: --

U.S. Initial Jobless Claims 4-Week Avg. (SA)

A:--

F: --

P: --

U.S. Weekly Initial Jobless Claims (SA)

A:--

F: --

P: --

U.S. Weekly Continued Jobless Claims (SA)

A:--

F: --

P: --

Canada Ivey PMI (SA) (Nov)

A:--

F: --

P: --

Canada Ivey PMI (Not SA) (Nov)

A:--

F: --

P: --

U.S. Non-Defense Capital Durable Goods Orders Revised MoM (Excl. Aircraft) (SA) (Sept)

A:--

F: --

P: --
U.S. Factory Orders MoM (Excl. Transport) (Sept)

A:--

F: --

P: --

U.S. Factory Orders MoM (Sept)

A:--

F: --

P: --

U.S. Factory Orders MoM (Excl. Defense) (Sept)

A:--

F: --

P: --

U.S. EIA Weekly Natural Gas Stocks Change

A:--

F: --

P: --

Saudi Arabia Crude Oil Production

A:--

F: --

P: --

U.S. Weekly Treasuries Held by Foreign Central Banks

A:--

F: --

P: --

Japan Foreign Exchange Reserves (Nov)

A:--

F: --

P: --

India Repo Rate

A:--

F: --

P: --

India Benchmark Interest Rate

A:--

F: --

P: --

India Reverse Repo Rate

A:--

F: --

P: --

India Cash Reserve Ratio

A:--

F: --

P: --

Japan Leading Indicators Prelim (Oct)

A:--

F: --

P: --

U.K. Halifax House Price Index YoY (SA) (Nov)

--

F: --

P: --

U.K. Halifax House Price Index MoM (SA) (Nov)

--

F: --

P: --

France Current Account (Not SA) (Oct)

--

F: --

P: --

France Trade Balance (SA) (Oct)

--

F: --

P: --

France Industrial Output MoM (SA) (Oct)

--

F: --

P: --

Italy Retail Sales MoM (SA) (Oct)

--

F: --

P: --

Euro Zone Employment YoY (SA) (Q3)

--

F: --

P: --

Euro Zone GDP Final YoY (Q3)

--

F: --

P: --

Euro Zone GDP Final QoQ (Q3)

--

F: --

P: --

Euro Zone Employment Final QoQ (SA) (Q3)

--

F: --

P: --

Euro Zone Employment Final (SA) (Q3)

--

F: --

P: --
Brazil PPI MoM (Oct)

--

F: --

P: --

Mexico Consumer Confidence Index (Nov)

--

F: --

P: --

Canada Unemployment Rate (SA) (Nov)

--

F: --

P: --

Canada Labor Force Participation Rate (SA) (Nov)

--

F: --

P: --

Canada Employment (SA) (Nov)

--

F: --

P: --

Canada Part-Time Employment (SA) (Nov)

--

F: --

P: --

Canada Full-time Employment (SA) (Nov)

--

F: --

P: --

U.S. Dallas Fed PCE Price Index YoY (Sept)

--

F: --

P: --

U.S. PCE Price Index YoY (SA) (Sept)

--

F: --

P: --

U.S. PCE Price Index MoM (Sept)

--

F: --

P: --

U.S. Personal Outlays MoM (SA) (Sept)

--

F: --

P: --

U.S. Core PCE Price Index MoM (Sept)

--

F: --

P: --

U.S. UMich 5-Year-Ahead Inflation Expectations Prelim YoY (Dec)

--

F: --

P: --

U.S. Core PCE Price Index YoY (Sept)

--

F: --

P: --

U.S. 5-10 Year-Ahead Inflation Expectations (Dec)

--

F: --

P: --

U.S. UMich Current Economic Conditions Index Prelim (Dec)

--

F: --

P: --

U.S. UMich Consumer Sentiment Index Prelim (Dec)

--

F: --

P: --

U.S. UMich 1-Year-Ahead Inflation Expectations Prelim (Dec)

--

F: --

P: --

U.S. UMich Consumer Expectations Index Prelim (Dec)

--

F: --

P: --

Q&A with Experts
    • All
    • Chatrooms
    • Groups
    • Friends
    Connecting
    .
    .
    .
    Type here...
    Add Symbol or Code

      No matching data

      All
      Trump Updates
      Recommend
      Stocks
      Cryptocurrencies
      Central Banks
      Featured News
      • All
      • Russia-Ukraine Conflict
      • Middle East Flashpoint
      • All
      • Russia-Ukraine Conflict
      • Middle East Flashpoint
      Search
      Products

      Charts Free Forever

      Chats Q&A with Experts
      Screeners Economic Calendar Data Tools
      Membership Features
      Data Warehouse Market Trends Institutional Data Policy Rates Macro

      Market Trends

      Market Sentiment Order Book Forex Correlations

      Top Indicators

      Charts Free Forever
      Markets

      News

      News Analysis 24/7 Columns Education
      From Institutions From Analysts
      Topics Columnists

      Latest Views

      Latest Views

      Trending Topics

      Top Columnists

      Latest Update

      Signals

      Copy Rankings Latest Signals Become a signal provider AI Rating
      Contests
      Brokers

      Overview Brokers Assessment Rankings Regulators News Claims
      Broker listing Forex Brokers Comparison Tool Live Spread Comparison Scam
      Q&A Complaint Scam Alert Videos Tips to Detect Scam
      More

      Business
      Events
      Careers About Us Advertising Help Center

      White Label

      Data API

      Web Plug-ins

      Affiliate Program

      Awards Institution Evaluation IB Seminar Salon Event Exhibition
      Vietnam Thailand Singapore Dubai
      Fans Party Investment Sharing Session
      FastBull Summit BrokersView Expo
      Recent Searches
        Top Searches
          Markets
          News
          Analysis
          User
          24/7
          Economic Calendar
          Education
          Data
          • Names
          • Latest
          • Prev

          View All

          No data

          Scan to Download

          Faster Charts, Chat Faster!

          Download App
          English
          • English
          • Español
          • العربية
          • Bahasa Indonesia
          • Bahasa Melayu
          • Tiếng Việt
          • ภาษาไทย
          • Français
          • Italiano
          • Türkçe
          • Русский язык
          • 简中
          • 繁中
          Open Account
          Search
          Products
          Charts Free Forever
          Markets
          News
          Signals

          Copy Rankings Latest Signals Become a signal provider AI Rating
          Contests
          Brokers

          Overview Brokers Assessment Rankings Regulators News Claims
          Broker listing Forex Brokers Comparison Tool Live Spread Comparison Scam
          Q&A Complaint Scam Alert Videos Tips to Detect Scam
          More

          Business
          Events
          Careers About Us Advertising Help Center

          White Label

          Data API

          Web Plug-ins

          Affiliate Program

          Awards Institution Evaluation IB Seminar Salon Event Exhibition
          Vietnam Thailand Singapore Dubai
          Fans Party Investment Sharing Session
          FastBull Summit BrokersView Expo

          GBP/USD Pushes Higher—Will the Rally Continue?

          Alex

          Economic

          Forex

          Summary:

          GBP/USD started a decent increase above the 1.2800 resistance zone. A key bullish trend line is forming with support at 1.2720 on the 4-hour chart. EUR/USD climbed above the 1.0880 resistance zone. Bitcoin failed to recover above the $85,000 resistance zone.

          GBP/USD started a decent increase above the 1.2800 resistance zone.
          A key bullish trend line is forming with support at 1.2720 on the 4-hour chart.
          EUR/USD climbed above the 1.0880 resistance zone.
          Bitcoin failed to recover above the $85,000 resistance zone.

          GBP/USD Technical Analysis

          The British Pound formed a base and started a fresh increase above 1.2800 against the US Dollar. GBP/USD broke the 1.2850 resistance to enter a positive zone.

          Looking at the 4-hour chart, the pair settled above the 1.2850 level, the 100 simple moving average (red, 4-hour), and the 200 simple moving average (green, 4-hour). The pair even cleared the 1.2920 resistance zone.

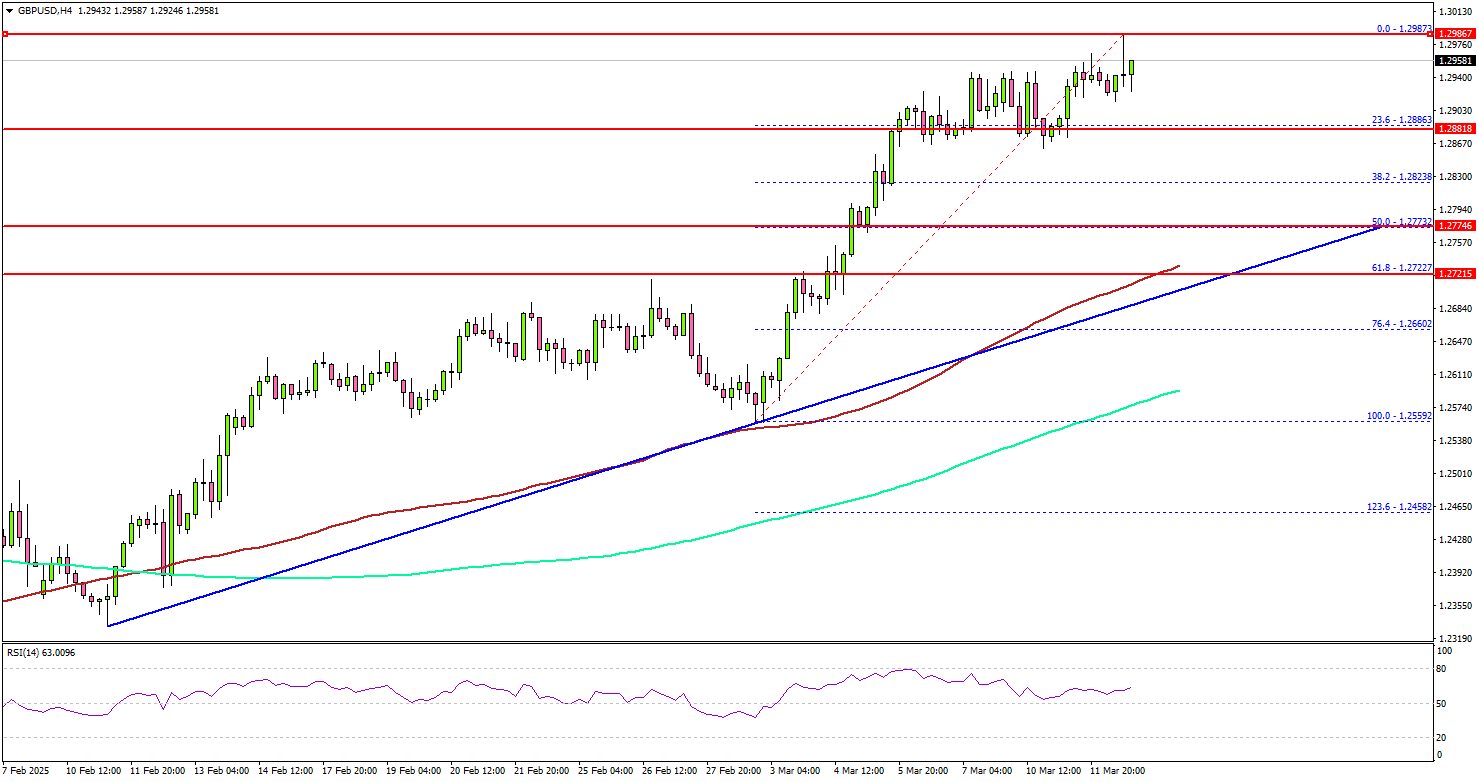
          It seems to be aiming for a move above the 1.3000 resistance zone, which is a major hurdle for the bulls. The next major resistance is near the 1.3050 level.

          The main resistance is now forming near the 1.3120 zone. A close above the 1.3120 level could set the tone for another increase. In the stated case, the pair could even clear the 1.3200 resistance.

          On the downside, immediate support sits near the 1.2880 level. The next key support sits near the 1.2850 level. Any more losses could send the pair toward the 1.2800 level. The main support could be 1.2740. There is also a key bullish trend line forming with support at 1.2720 on the same chart.

          Looking at EUR/USD, the pair also started a decent increase and the pair could now aim for a move toward the 1.1000 resistance.

          Upcoming Economic Events:

          US Initial Jobless Claims – Forecast 225K, versus 221K previous.
          US Producer Price Index for Feb 2025 (YoY) – Forecast +3.3%, versus +3.5% previous.

          Source: ACTIONFOREX

          To stay updated on all economic events of today, please check out our Economic calendar
          Risk Warnings and Disclaimers
          You understand and acknowledge that there is a high degree of risk involved in trading. Following any strategies or investment methods may lead to potential losses. The content on the site is provided by our contributors and analysts for information purposes only. You are solely responsible for determining whether any trading assets, securities, strategy, or any other product is suitable for investing based on your own investment objectives and financial situation.
          Add to Favorites
          Share

          March 13th Financial News

          FastBull Featured

          Daily News

          [Quick Facts]

          U.S. budget deficit hits $1.1 trillion, a record high for the same period.
          Russia is not informed of U.S.-Ukraine negotiation results, it's "too early" to discuss a truce.
          The U.S. government faces another shutdown as Democrats and Republicans struggle to reach an agreement.
          Former Bank of England Governor Mark Carney to assume office as Canadian Prime Minister on Friday, Cabinet size potentially halved.
          Bank of Canada reduces policy rate by 25 basis points as expected, adopts "Cautious" approach to tariff impacts.
          U.S. CPI cools but underlying concerns remain.

          [News Details]

          U.S. budget deficit hits $1.1 trillion, a record high for the same period
          The U.S. budget deficit continued to expand in February, pushing the deficit for the first five months of the fiscal year to 1.15 trillion, driven primarily by rising Medicare costs and government debt servicing expenses. Data released by the Treasury on Wednesday showed a February deficit of 307 billion alone. Adjusted for calendar differences, the budget deficit for the fiscal year starting October 1st is 17% higher than the same period last year. The widening deficit could complicate President Donald Trump's efforts to extend and expand the 2017 tax cuts, most of which expire at the end of this year.
          Russia is not informed of U.S.-Ukraine negotiation results, it's "too early" to discuss a truce
          On March 12, Russian Ambassador to France Alexey Meshkov stated in a media interview that Russia has not yet been informed of the results of U.S.-Ukraine negotiations, making it "too early" to discuss a truce. Russia needs more details and hopes to resolve the conflict through diplomatic means. Meshkov reiterated Russia's stance on resolving the Ukraine conflict, which includes Ukraine not joining NATO, no deployment of NATO troops on Ukrainian territory, and NATO refraining from any form of military exercises or training in Ukraine.
          The U.S. government faces another shutdown as Democrats and Republicans struggle to reach an agreement
          Senate Democrats gathered on Wednesday to discuss a temporary funding bill passed by the Republican-controlled House (which requires 60 votes to advance in the Senate, where Republicans hold 53 seats). With just two days left before a partial government shutdown, Senate Democratic Leader Chuck Schumer called for a one-month extension of current spending to allow time to complete a more comprehensive funding bill for the year, but this strategy is unlikely to succeed.
          Schumer warned that all 47 Democratic senators oppose the House-passed six-month funding bill, with only one House Democrat voting in favor. In a brief speech to the Senate, Schumer said, "I am hopeful Democrats will join Republicans to prevent a possible shutdown on Friday." Republican Senator Markwayne Mullin stated that if a shutdown occurs, it would be "100% Schumer's fault."
          Former Bank of England Governor Mark Carney to assume office as Canadian Prime Minister on Friday, Cabinet size potentially halved
          According to sources, former Bank of England Governor Mark Carney will be sworn in as Canada’s 24th Prime Minister on Friday, with the new cabinet potentially halved in size compared to Trudeau’s administration. One source indicated that the cabinet is expected to have between 15 and 20 ministers, down from 37 currently including the prime minister. The 59-year-old Carney takes office as U.S. President Donald Trump’s tariff policies create global economic turbulence and disrupt U.S. trade partners. Carney stated on Wednesday that he is prepared to engage in dialogue with Trump if Canada’s sovereignty is respected. It remains unclear whether the Finance Minister, Foreign Minister, and Industry Minister will retain their positions, as all three have been actively involved in trade responses to the U.S.
          Bank of Canada reduces policy rate by 25 basis points as expected, adopts "Cautious" approach to tariff impacts
          The Bank of Canada announced on Wednesday a 25-basis-point rate cut to 2.75%, the lowest level since September 2022. The monetary policy statement indicated that the Canadian economy is on a solid footing in 2025, with inflation close to the 2% target and strong GDP growth. However, escalating trade tensions and U.S. tariffs could slow economic activity and increase inflationary pressures.
          The economic outlook faces more uncertainty than usual due to rapidly changing policy environments. The pervasive uncertainty created by continuously changing US tariff threats is restraining consumers’ spending intentions and businesses' plans to hire and invest. Against this background, and with inflation close to the 2% target, the Governing Council decided to reduce the policy rate by a further 25 basis points.
          While trade wars bring cost pressures and potential inflationary shocks, policy interventions cannot fully offset their impacts but can ensure price increases do not lead to long-term inflation. The Bank will closely monitor how cost pressures translate into consumer prices. Recent surveys show consumers widely expect tariffs to push prices higher, raising inflation expectations.
          At a later press conference, Bank of Canada Governor Tiff Macklem stated, "We are facing a new crisis. Depending on the extent and duration of new U.S. tariffs, the economic impact could be severe." The uncertainty surrounding the current tariff dispute is "ubiquitous" and has already negatively impacted economic activity.
          The Bank will cautiously adjust policy rates, fully assessing the upside inflation pressures from rising costs and the downside pressures from weak demand.
          U.S. CPI cools but underlying concerns remain
          The U.S. February CPI rose 2.8% year-on-year (previous reading was 3% vs expected 2.9%) and 0.2% month-on-month (previous reading was 0.5% vs expected 0.3%). Core CPI increased 3.1% year-on-year (previous reading was 3.3% vs expected: 3.2%) and 0.2% month-on-month (previous reading was 0.4% vs expected: 0.3%).
          The data, which fell below expectations and previous readings, reflects a continued cooling trend in U.S. inflation. Against the backdrop of a sharp sell-off in U.S. stocks, Wall Street paid close attention to this CPI report. Following the release, traders increased bets on Fed rate cuts, expecting at least two cuts this year, with the first likely in June.
          However, the February CPI did not reflect the inflationary impact of U.S. tariffs, leaving market concerns about the U.S. inflation outlook unresolved. Before details of reciprocal tariffs are revealed, the data gives a sense of "calm before the storm." The longer inflation remains above the Fed's target, even if due to temporary factors like tariffs, the greater the likelihood of upward revisions to expectations.
          As inflationary risks from Trump's tariff plans gradually emerge, recent economic data has shown volatility, and consumer concerns have risen. For the Fed, the challenge of balancing economic growth and price stability through monetary policy will become increasingly severe.

          [Today's Focus]

          UTC+8 10:30 Reserve Bank of Australia assistant Governor Jones Speaks
          UTC+8 17:00 IEA releases monthly Oil Market Report
          UTC+8 17:15 ECB Vice President Guindos speaks
          UTC+8 20:30 U.S. February PPI
          Risk Warnings and Disclaimers
          You understand and acknowledge that there is a high degree of risk involved in trading. Following any strategies or investment methods may lead to potential losses. The content on the site is provided by our contributors and analysts for information purposes only. You are solely responsible for determining whether any trading assets, securities, strategy, or any other product is suitable for investing based on your own investment objectives and financial situation.
          Add to Favorites
          Share

          Issuance Pressure Remains on the Increase

          Owen Li

          Economic

          Germany's fiscal plans will have their first reading in parliament. Despite recent stumbling blocks, yield levels and curves have retraced only very little, and Bunds have even softened again versus swaps. The fiscal story also remains tense in the US, as latest fiscal numbers show an ever-widening deficit. DOGE has quite a task at hand.

          Germany's fiscal reset goes to parliament

          EUR rates levels and curves managed to retrace somewhat on Wednesday with fewer headlines out of Germany to drive the market, but attention turned towards tariffs. It still remains a decoupling theme in the sense that US rates have taken the opposite direction on Wednesday, allowing the 10y UST/Bund spread to climb above 140bp again.
          Germany will remain the big driver in the background for EUR rates, though. Parliament will convene in a special session for the first reading regarding the defence and infrastructure plans. This is a first debate of the proposal by the SPD and CDU/CSU, but also of the initiatives by the Greens and FDP. No decisions will be taken in this session, and the proposals will be delegated to the budget committee for deliberation before a second reading and vote in parliament next week.
          To recap, the proposals that are on this session's agenda are:
          SPD and CDU/CSU: Exempt defence spending greater than 1% of GDP from the debt brake and allow the German federal states to incur deficits of 0.35%. Creation of a €500bn special fund for infrastructure investments of which €100bn would be reserved for the federal states.
          Greens: Exempt defence spending greater than 1.5% of GDP from the debt brake with a broader definition of defence spending.
          FDP: Increase the existing defence special fund to €300bn, with the condition that it can be tapped only for defence expenditures exceeding 2% of GDP.
          The Greens are basically proposing to separate the package into the more pressing defence issue for immediate decision still within the old Bundestag, while leaving it to the next Bundestag to take up the infrastructure plans. Then also the votes of the Left would be needed. On Wednesday the informal conference of the 16 federal heads of state called for the package not to be separated. Eventually, the states will have to pass and decision in the Bundesrat.
          German Bunds have been trading gradually softer again over the past sessions with 10y Bunds now yielding 15bp over swaps. That is still off from last week’s cheapest levels where the spread was as high as 18bp, but it had temporarily recovered back towards 12bp. In all, the market is eyeing a compromise to a still sizeable package or a least a lasting change in Germany’s fiscal attitudes.

          US fiscal numbers continue to place pressure on Treasuries

          The US fiscal deficit for February came in at $307bn. That’s up from $296bn for the same month last year. Not dramatically up, but still up. The running numbers don’t look great. Total spending in the current fiscal year is running at 13% above last year, while receipts are only up 2%. The overall fiscal deficit cumulates to $1.15tn for the first five months of the current fiscal year, compared with $0.83tn for the same period last year. No magic DOGE pill here as of yet!Funding requirements are only under upward pressure here.
          Already over 22% of the debt is financed with bills, partly to keep it from pressuring coupon issuance by too much. These data keep the pressure on, even as Scott Bessent has promised no change in the coupon issuance profile in the coming quarters. So that must mean even more bills issuance. Even tougher as we continue to bang against the debt ceiling. The last thing needed now from a sentiment perspective is a government shutdown of some description, which is risk should the Senate decide not to pass the continuation bill in the coming days. Tough days continue. Not great for Treasuries overall.

          Thursday's events and market view

          German politics could dominate as the fiscal package gets a first reading in parliament. There is also busy slate of European Central Bank speakers across the dove-hawk spectrum including Holzmann, Villeroy and Nagel, but there is very little in terms of guidance policymakers will be willing to give in these highly uncertain times. The only data of note is industrial production for January.
          Over in the US producer prices will provide more details to the inflation picture after the cooler-than-expected CPI reading. The jobless claims will provide a more contemporaneous read of labour market conditions, but consensus is looking for only little change.
          In primary markets, Greece should be active after having mandated a dual tranche syndication, reopening 13y and 30y bond lines. Italy will auction a new 3y bond alongside taps of a 7y green bond as well as 8y and 30y regular bonds (up to €8.25bn in total). the US Treasury will auction 30y bonds (US$22bn).
          To stay updated on all economic events of today, please check out our Economic calendar
          Risk Warnings and Disclaimers
          You understand and acknowledge that there is a high degree of risk involved in trading. Following any strategies or investment methods may lead to potential losses. The content on the site is provided by our contributors and analysts for information purposes only. You are solely responsible for determining whether any trading assets, securities, strategy, or any other product is suitable for investing based on your own investment objectives and financial situation.
          Add to Favorites
          Share

          The Commodities Feed: Big Drop in US Gasoline Stocks

          ING

          Economic

          Oil prices bounced higher yesterday on a constructive weekly inventory report from the Energy Information Administration.

          Energy – Kazakhstan oil production surges

          Oil prices strengthened yesterday with ICE Brent seeing its biggest gain since the end of February, settling 2% up on the day, taking it back above US$70/bbl. A lower-than-expected increase in US crude oil inventories supported the market, while better-than-expected US consumer price inflation data also helped sentiment.Energy Information Administration (EIA) data shows that US commercial crude oil inventories increased by 1.45m barrels over the last week.
          That’s less than the roughly 2m barrel build the market was expecting – and below the 4.2m barrel increase the American Petroleum Institute (API) reported the previous day. Refiners increased operating rates over the week, with crude oil inputs increasing by 321k b/d. Yet despite stronger refinery activity, refined product stocks declined. Gasoline inventories fell by 5.74m barrels, while distillate stocks decreased by 1.56m barrels. Implied demand for oil products grew by 1.06m b/d week on week, with implied gasoline demand up 305k b/d. Overall, the data was constructive, especially the large drop in gasoline stocks.OPEC’s latest monthly oil market report, released yesterday, left both demand and supply estimates unchanged for 2025 and 2026. OPEC continues to forecast that 2025 oil demand will grow by 1.45m b/d year on year, while demand grows at 1.43m b/d next year. OPEC remains fairly bullish on demand, with their numbers above both the EIA and the International Energy Agency (IEA).Meanwhile, OPEC production grew by 154k b/d MoM to 26.86m b/d in February.
          Nigeria and Iran were the key drivers behind this supply growth. Looking at broader OPEC+, supply grew by 363k b/d. Kazakh output surged by 198k b/d to 1.77m b/d, well above its production target of 1.47m b/d. Kazakhstan has said it will cut output in the future to compensate for this overproduction.In natural gas, investment funds continued to cut their net long in the Title Transfer Facility (TTF) over the last week, selling 48.1TWh, leaving them with a net long of 126.7TWh. That’s the smallest net long held since May 2024. The move over the last week was driven by fresh shorts entering the market, rather than longs liquidating.

          Agriculture – Indian sugar production to fall

          The latest estimates from the Indian Sugar and Bio-energy Manufacturers Association (ISMA) show that gross sugar output (excluding sugar diverted for ethanol production) could fall to around 26.4mt in 2024/25, That compared to its previous forecast of 27.3mt. Lower cane yields in some major producing regions were primarily responsible for the lower output estimates. Sugar allocation for ethanol production is expected to fall to 3.5mt, compared with an earlier estimate of 3.8mt. Sugar consumption might average around 28mt. The country will likely export 1mt of sugar this season. 2024/25 ending stocks are estimated at at 5.4mt.
          To stay updated on all economic events of today, please check out our Economic calendar
          Risk Warnings and Disclaimers
          You understand and acknowledge that there is a high degree of risk involved in trading. Following any strategies or investment methods may lead to potential losses. The content on the site is provided by our contributors and analysts for information purposes only. You are solely responsible for determining whether any trading assets, securities, strategy, or any other product is suitable for investing based on your own investment objectives and financial situation.
          Add to Favorites
          Share

          Is Bitcoin Price Going to Crash Again?

          Warren Takunda

          Cryptocurrency

          Bitcoin (BTC) tapped $83,700 during the early Asian hours on March 12 after reaching a low of $76,600 on March 11 amid a slight improvement in market sentiment.
          BTC/USD facing rejection from the $84,000 level raises questions about whether BTC price could drop further over the next few days.Is Bitcoin Price Going to Crash Again?_1

          BTC/USD hourly chart. Source: Cointelegraph/TradingView

          Demand for Bitcoin remains weak

          Spot Bitcoin exchange-traded funds (ETF) outflows have played a big role in the BTC price drop since late February, surpassing $1.5 billion over the last two weeks.
          Meanwhile, Bitcoin’s apparent demand remains low, implying a decline in risk appetite from potential investors, according to data from market intelligence firm CryptoQuant,
          What to know:
          Apparent demand is the difference between production and changes in inventory.
          Production refers to BTC mining issuance, while inventory refers to inactive supply for over a year.
          Apparent demand weakens if production exceeds inventory reduction.
          After a period of acceleration between November 2024 and December 2024, fueled by President Donald Trump’s victory, Bitcoin apparent demand dropped from 279,000 BTC on Dec. 4 to 10,000 on Feb. 26.
          On Feb. 27, the metric turned negative for the first time since September 2024.
          It currently stands at -93,700 BTC at the time of writing.
          If the trend continues, the price could dip lower, just as it happened in July 2024.
          The chart below shows that Bitcoin apparent demand was at similar levels on July 27, 2024, after which BTC price dropped a further 30% to $49,000 on Aug. 5, 2024.Is Bitcoin Price Going to Crash Again?_2

          Bitcoin apparent demand. Source: CryptoQuant

          However, this metric does not always guarantee more downside in the future. For example, it was also negative in late May 2024 and late October 2024 before the price rallied 7% and 73%, respectively.

          Bitcoin valuation metrics hint at deeper correction

          Data from Cointelegraph Markets Pro and TradingView show Bitcoin price trading 7% above its four-month low of $76,600 reached on March 12.
          Despite this rebound, several valuation metrics are still leaning bearish, suggesting a deeper correction is possible, according to CryptoQuant.
          The Bitcoin bull-bear market cycle Indicator is at its “most bearish level" of this cycle.
          The bull/bear market cycle indicator is a momentum metric that measures the difference between the P&L Index and its 365-day moving average.
          Values above 0 show that BTC is in a bull market, while values below 0 indicate a bear market.
          The current value of -0.067 is at the lowest level since May 2023, when Bitcoin’s price embarked on a sustained recovery.Is Bitcoin Price Going to Crash Again?_3

          Bitcoin: Bull-bear market cycle indicator. Source: CryptoQuant

          Meanwhile, the MVRV ratio Z-score has crossed below its 365-day moving average, indicating that the upward price trend has lost momentum.
          The MVRV ratio Z-score is a key metric used to assess whether Bitcoin is overvalued or undervalued.
          “Historically, valuation metrics at these levels have signaled either a sharp correction or the start of a bear market.”

          Bitcoin price bear flag hints at $68,400

          From a technical perspective, BTC price is trading within a bearish continuation pattern that indicates a potential correction ahead.
          Key points:
          BTC is trading within a bear flag pattern, indicating the possibility of more downside if key support levels don’t hold.
          The bear flag developed after Bitcoin dropped from $92,000 to a local low of $76,600 between March 6 and 11.
          The consolidation within the bear flag has BTC trading in an ascending parallel channel, with today’s drop testing critical support levels, including the lower boundary of the flag at $82,000.Is Bitcoin Price Going to Crash Again?_4

          BTC/USD four-hour chart. Source: Cointelegraph/TradingView

          A breakdown of this level could trigger another price crash.
          The bear flag’s downside target, derived from the height of the previous drop, is approximately $68,400, representing a 17% drop from the current price.
          CryptoQuant analysts, meanwhile, say that if the current support zone between $75,000 and $78,000 doesn’t hold, Bitcoin could go even lower to $63,000.

          Source: Cointelegraph

          Risk Warnings and Disclaimers
          You understand and acknowledge that there is a high degree of risk involved in trading. Following any strategies or investment methods may lead to potential losses. The content on the site is provided by our contributors and analysts for information purposes only. You are solely responsible for determining whether any trading assets, securities, strategy, or any other product is suitable for investing based on your own investment objectives and financial situation.
          Add to Favorites
          Share

          Pound-to-Euro: Stabilisation as EU Enters Tariff War

          Warren Takunda

          Economic

          The Pound-to-Euro exchange rate (GBP/EUR) extended losses to 1.1852 midweek following six consecutive days of losses, but we see the prospect for consolidation.
          The Relative Strength Index (RSI) on the daily chart has reached 30 (see the lower panel in the chart), triggering an oversold signal.
          The development comes as GBP/EUR approaches a clear graphical support zone at 1.1820, where the January selloff also faded and ultimately reversed. The level also came into play in June and September 2024 and forms the bottom of a medium-term range.
          Pound-to-Euro: Stabilisation as EU Enters Tariff War_1

          Above: GBP/EUR at daily intervals.

          Given the technical challenges to further gains by the Euro, a consolidation becomes likely.
          For now, the prospect of a rebound is less assured than in January, when a similar selloff appeared to be driven by the unwinding of 'long' GBP positioning.
          This time around, the European economic outlook has been significantly reappraised as Germany prepares to spend more on defence and infrastructure investments. Economists say this is a' game-changer' moment for the single currency.
          "Germany is setting in motion a significant shift in modern history, potentially transforming it from a fiscal detractor to a fiscal stimulator. Markets should take note!" says Vasileios Gkionakis, Senior Economist and Strategist at Aviva Investors.
          The fundamental shift in favour of the Euro we have seen in the past week leaves us wary of a breakdown of GBP/EUR support at 1.1820 in the event of further Euro outperformance.
          However, the conditions for a pause in the selloff are building as investors still have to grapple with the uncertainty of U.S. tariffs and their impact on the European economy.
          The EU and U.S. officially entered a trade war on March 12 as the European Commission announced it was to retaliate against U.S. tariffs, announcing tariffs worth $28BN on U.S. goods.
          "We expect the EUR-USD exchange rate to fall back somewhat in the coming weeks," says Ulrich Leuchtmannm, Head of FX and Commodity Research at Commerzbank.
          The EU said it is a countermeasure for the €26BN tariff announced by the U.S. last month.
          The rump of the EU's package is nothing new: Tariffs imposed under Trump's first presidency were suspended during the Biden administration. The EU will let that suspension lapse in April.
          However, an additional package of new countermeasures on U.S. exports will come into force by mid-April, following consultation with Member States and stakeholders.
          The market impact has been relatively muted in response, with the EU signalling it is ready to negotiate, which Donald Trump tends to respond positively to.
          "We will always remain open to negotiation. We firmly believe that in a world fraught with geopolitical and economic uncertainties, it is not in our common interest to burden our economies with tariffs," said EU Commission President Ursula von der Leyen.
          On April 02, the U.S. is set to announce its biggest tariff package yet, something that will keep markets nervous and potentially limit the Euro's recent impressive rebound.
          "While downside risks for the EUR and euro-zone economy have diminished, they have not completely gone away," says Lee Hardman, currency analyst at MUFG Bank Ltd.
          "Tariffs are a massive near-term risk," says Bill Diviney, an economist at ABN AMRO.

          Source: Poundsterlinglive

          To stay updated on all economic events of today, please check out our Economic calendar
          Risk Warnings and Disclaimers
          You understand and acknowledge that there is a high degree of risk involved in trading. Following any strategies or investment methods may lead to potential losses. The content on the site is provided by our contributors and analysts for information purposes only. You are solely responsible for determining whether any trading assets, securities, strategy, or any other product is suitable for investing based on your own investment objectives and financial situation.
          Add to Favorites
          Share

          Fresh Tariff Threats Hit U.S. Dollar

          Warren Takunda

          Economic

          The Dollar extended losses against the Euro, Pound Sterling and other major currencies after U.S. President Donald Trump fired another tariff broadside and ramped up uncertainty for investors and U.S. businesses.
          He announced on social media that he would increase steel and aluminum tariffs for Canada to 50%, starting tomorrow, and declared a "national emergency on electricity".
          He said the taxes would stay in place until Canada removed its trade barriers on dairy and electricity.
          In addition, he said he would also "substantially increase" tariffs on Canadian automobile parts on April 2 if the country does not drop tariffs on dairy products and other U.S. goods.
          Trump's ad-hoc, reactionary and seemingly random approach to tariffs has been a major factor behind a loss in market confidence, which has resulted in a sharp selloff in U.S. stocks.
          The Dollar has also fallen, as markets see higher inflation and lower growth on the horizon.
          The Pound-to-Dollar exchange rate is at 1.2937, putting it on the cusp of fresh four-month highs. The Euro-to-Dollar exchange rate extends its surge, hitting 1.0916.
          "Tariffs can have a triple whammy, adding to worries about inflation, growth and denting confidence," says Gerard Lyons, Chief Economic Strategist at Netwealth.
          "It's ridiculous for anyone to claim that foreign nations have more to lose from a trade war than the U.S. Tariffs are taxes on imports. The U.S. is more dependent on imports than any other nation. Therefore, the U.S. has more to lose from a trade war than any other nation!" explains Peter Schiff, Chief Economist and Global Strategist at Euro Pacific.
          Data released Tuesday showed small business sentiment moderated further amid this increasing economic uncertainty.
          The NFIB Small Business Optimism Index fell for the second consecutive month in February to 100.7 as the uncertainty index rose to its second highest level on record.
          "Although economic perceptions remain much more constructive than in recent years, the recent flurry of tariff activity appears to have dented economic expectations and put upward pressure on small business prices," says Charlie Dougherty, Senior Economist at Wells Fargo.
          Fresh Tariff Threats Hit U.S. Dollar_1
          The net share of small firms raising their selling prices leapt 10 points in February to 32%, its highest level since May 2023.
          In addition, the labour market reemerged as the top concern facing small firms, causing hiring plans to dip three points in February.
          U.S. job openings (JOLTS) rose to 7,740K in January from a downwardly revised 7,508K in December, but this was above the consensus expectation for 7,600K.
          According to Viraj Patel, Strategist at Vanda Research, the figures suggest U.S. private sector jobs market is in paralysis.
          He points to a flat hire rate (has been flat for 4 months in a row) and a slightly higher quit rate (but running at cycle lows).
          The layoff rate is also flat and "shows how the U.S. labor market is flatlining," says Patel.
          Incoming data continues to point to a slowdown in U.S. economic activity, with the Atlanta Federal Reserve's real-time measure of GDP growth now forecasting that U.S. GDP growth for the first quarter has dropped to -2.8% from -1.5%.
          The deterioration has encouraged markets to raise expectations for the number of incoming Federal Reserve rate cuts, which has weighed on U.S. bond yields and triggered weakness in the Dollar.
          Further uncertainty into the April 02 tariff announcements should keep the current themes in play.

          Source: Poundsterlinglive

          To stay updated on all economic events of today, please check out our Economic calendar
          Risk Warnings and Disclaimers
          You understand and acknowledge that there is a high degree of risk involved in trading. Following any strategies or investment methods may lead to potential losses. The content on the site is provided by our contributors and analysts for information purposes only. You are solely responsible for determining whether any trading assets, securities, strategy, or any other product is suitable for investing based on your own investment objectives and financial situation.
          Add to Favorites
          Share
          FastBull
          Copyright © 2025 FastBull Ltd

          728 RM B 7/F GEE LOK IND BLDG NO 34 HUNG TO RD KWUN TONG KLN HONG KONG

          TelegramInstagramTwitterfacebooklinkedin
          App Store Google Play Google Play
          Products
          Charts

          Chats

          Q&A with Experts
          Screeners
          Economic Calendar
          Data
          Tools
          Membership
          Features
          Function
          Markets
          Copy Trading
          Latest Signals
          Contests
          News
          Analysis
          24/7
          Columns
          Education
          Company
          Careers
          About Us
          Contact Us
          Advertising
          Help Center
          Feedback
          User Agreement
          Privacy Policy
          Business

          White Label

          Data API

          Web Plug-ins

          Poster Maker

          Affiliate Program

          Risk Disclosure

          The risk of loss in trading financial instruments such as stocks, FX, commodities, futures, bonds, ETFs and crypto can be substantial. You may sustain a total loss of the funds that you deposit with your broker. Therefore, you should carefully consider whether such trading is suitable for you in light of your circumstances and financial resources.

          No decision to invest should be made without thoroughly conducting due diligence by yourself or consulting with your financial advisors. Our web content might not suit you since we don't know your financial conditions and investment needs. Our financial information might have latency or contain inaccuracy, so you should be fully responsible for any of your trading and investment decisions. The company will not be responsible for your capital loss.

          Without getting permission from the website, you are not allowed to copy the website's graphics, texts, or trademarks. Intellectual property rights in the content or data incorporated into this website belong to its providers and exchange merchants.

          Not Logged In

          Log in to access more features

          FastBull Membership

          Not yet

          Purchase

          Become a signal provider
          Help Center
          Customer Service
          Dark Mode
          Price Up/Down Colors

          Log In

          Sign Up

          Position
          Layout
          Fullscreen
          Default to Chart
          The chart page opens by default when you visit fastbull.com