• Trade
  • Markets
  • Copy
  • Contests
  • News
  • 24/7
  • Calendar
  • Q&A
  • Chats
Trending
Screeners
SYMBOL
LAST
BID
ASK
HIGH
LOW
NET CHG.
%CHG.
SPREAD
SPX
S&P 500 Index
6827.42
6827.42
6827.42
6899.86
6801.80
-73.58
-1.07%
--
DJI
Dow Jones Industrial Average
48458.04
48458.04
48458.04
48886.86
48334.10
-245.98
-0.51%
--
IXIC
NASDAQ Composite Index
23195.16
23195.16
23195.16
23554.89
23094.51
-398.69
-1.69%
--
USDX
US Dollar Index
97.930
98.010
97.930
98.070
97.810
-0.020
-0.02%
--
EURUSD
Euro / US Dollar
1.17446
1.17453
1.17446
1.17596
1.17262
+0.00052
+ 0.04%
--
GBPUSD
Pound Sterling / US Dollar
1.33829
1.33839
1.33829
1.33961
1.33546
+0.00122
+ 0.09%
--
XAUUSD
Gold / US Dollar
4334.57
4334.98
4334.57
4350.16
4294.68
+35.18
+ 0.82%
--
WTI
Light Sweet Crude Oil
56.947
56.977
56.947
57.601
56.789
-0.286
-0.50%
--

Community Accounts

Signal Accounts
--
Profit Accounts
--
Loss Accounts
--
View More

Become a signal provider

Sell trading signals to earn additional income

View More

Guide to Copy Trading

Get started with ease and confidence

View More

Signal Accounts for Members

All Signal Accounts

Best Return
  • Best Return
  • Best P/L
  • Best MDD
Past 1W
  • Past 1W
  • Past 1M
  • Past 1Y

All Contests

  • All
  • Trump Updates
  • Recommend
  • Stocks
  • Cryptocurrencies
  • Central Banks
  • Featured News
Top News Only
Share

Fed Data - USA Effective Federal Funds Rate At 3.64 Percent On 12 December On $102 Billion In Trades Versus 3.64 Percent On $99 Billion On 11 December

Share

Brazil's Petrobras Says No Impact Seen On Oil, Petroleum Products Output As Workers Start Planned Strike

Share

Statement: US Travel Group Warns New Proposed Trump Administration Requirements For Foreign Tourists To Provide Social Media Histories Could Mean Millions Of People Opting Not To Visit

Share

Blackrock: Kerry White Will Become Head Of Citi Investment Management At Citi Wealth

Share

Blackrock: Rob Jasminski, Head Of Citi Investment Management, Has Joined With Team

Share

Blackrock: Effective Dec 15, Citi Investment Management Employees Will Join Blackrock

Share

Blackrock: Formally Launch Citi Portfolio Solutions Powered By Blackrock

Share

According To Data From The Federal Reserve Bank Of New York, The Secured Overnight Funding Rate (Sofr) Was 3.67% On The Previous Trading Day (December 15), Compared To 3.66% The Day Before

Share

Peru Energy And Mines Ministry: Copper Production Up 4.8% Year-On-Year In October To 248192 Metric Tons

Share

Security Source: Ukrainian Drones Hits Russian Oil Infrastructure In Caspian Sea For Third Time

Share

Spot Palladium Extends Gains, Last Up 5% To $1562.7/Oz

Share

Mexico's Economy Ministry Announces Start Of Anti-Dumping Investigation And Anti-Subsidy Investigations Into USA Pork Imports

Share

Canada Nov CPI Common +2.8%, CPI Median +2.8%, CPI Trim +2.8% On Year

Share

NY Fed's Empire State Prices Paid Index +37.6 In December Versus+49.0 In November

Share

Canada Nov Consumer Prices +0.1% On Month, +2.2% On Year

Share

Canada Nov CPI Core -0.1% On Month, +2.9% On Year

Share

Canada Nov Core CPI, Seasonally Adjusted +0.2% On Month, Oct +0.3% (Unrevised)

Share

UK Health Minister Streeting On Doctors' Strike: Vote To Go Ahead Reveals The Bma's Shocking Disregard For Patient Safety

Share

Venezuelan State Oil Company Pdvsa Says Was Subject To Cyber Attack But Operations Unaffected

Share

Russia Central Bank Says January-October Current Account Surplus At $37.1 Billion

TIME
ACT
FCST
PREV
Japan Tankan Small Manufacturing Outlook Index (Q4)

A:--

F: --

P: --

Japan Tankan Large Non-Manufacturing Outlook Index (Q4)

A:--

F: --

P: --

Japan Tankan Large Manufacturing Outlook Index (Q4)

A:--

F: --

P: --

Japan Tankan Small Manufacturing Diffusion Index (Q4)

A:--

F: --

P: --

Japan Tankan Large Manufacturing Diffusion Index (Q4)

A:--

F: --

P: --

Japan Tankan Large-Enterprise Capital Expenditure YoY (Q4)

A:--

F: --

P: --

U.K. Rightmove House Price Index YoY (Dec)

A:--

F: --

P: --

China, Mainland Industrial Output YoY (YTD) (Nov)

A:--

F: --

P: --

China, Mainland Urban Area Unemployment Rate (Nov)

A:--

F: --

P: --

Saudi Arabia CPI YoY (Nov)

A:--

F: --

P: --

Euro Zone Industrial Output YoY (Oct)

A:--

F: --

P: --

Euro Zone Industrial Output MoM (Oct)

A:--

F: --

P: --

Canada Existing Home Sales MoM (Nov)

A:--

F: --

P: --

Canada National Economic Confidence Index

A:--

F: --

P: --

Canada New Housing Starts (Nov)

A:--

F: --

P: --
U.S. NY Fed Manufacturing Employment Index (Dec)

A:--

F: --

P: --

U.S. NY Fed Manufacturing Index (Dec)

A:--

F: --

P: --

Canada Core CPI YoY (Nov)

A:--

F: --

P: --

Canada Manufacturing Unfilled Orders MoM (Oct)

A:--

F: --

P: --

U.S. NY Fed Manufacturing Prices Received Index (Dec)

A:--

F: --

P: --

U.S. NY Fed Manufacturing New Orders Index (Dec)

A:--

F: --

P: --

Canada Manufacturing New Orders MoM (Oct)

A:--

F: --

P: --

Canada Core CPI MoM (Nov)

A:--

F: --

P: --

Canada Trimmed CPI YoY (SA) (Nov)

A:--

F: --

P: --

Canada Manufacturing Inventory MoM (Oct)

A:--

F: --

P: --

Canada CPI YoY (Nov)

A:--

F: --

P: --

Canada CPI MoM (Nov)

A:--

F: --

P: --

Canada CPI YoY (SA) (Nov)

A:--

F: --

P: --

Canada Core CPI MoM (SA) (Nov)

A:--

F: --

P: --

Canada CPI MoM (SA) (Nov)

A:--

F: --

P: --

Federal Reserve Board Governor Milan delivered a speech
U.S. NAHB Housing Market Index (Dec)

--

F: --

P: --

Australia Composite PMI Prelim (Dec)

--

F: --

P: --

Australia Services PMI Prelim (Dec)

--

F: --

P: --

Australia Manufacturing PMI Prelim (Dec)

--

F: --

P: --

Japan Manufacturing PMI Prelim (SA) (Dec)

--

F: --

P: --

U.K. 3-Month ILO Employment Change (Oct)

--

F: --

P: --

U.K. Unemployment Claimant Count (Nov)

--

F: --

P: --

U.K. Unemployment Rate (Nov)

--

F: --

P: --

U.K. 3-Month ILO Unemployment Rate (Oct)

--

F: --

P: --

U.K. Average Weekly Earnings (3-Month Average, Including Bonuses) YoY (Oct)

--

F: --

P: --

U.K. Average Weekly Earnings (3-Month Average, Excluding Bonuses) YoY (Oct)

--

F: --

P: --

France Services PMI Prelim (Dec)

--

F: --

P: --

France Composite PMI Prelim (SA) (Dec)

--

F: --

P: --

France Manufacturing PMI Prelim (Dec)

--

F: --

P: --

Germany Services PMI Prelim (SA) (Dec)

--

F: --

P: --

Germany Manufacturing PMI Prelim (SA) (Dec)

--

F: --

P: --

Germany Composite PMI Prelim (SA) (Dec)

--

F: --

P: --

Euro Zone Composite PMI Prelim (SA) (Dec)

--

F: --

P: --

Euro Zone Services PMI Prelim (SA) (Dec)

--

F: --

P: --

Euro Zone Manufacturing PMI Prelim (SA) (Dec)

--

F: --

P: --

U.K. Services PMI Prelim (Dec)

--

F: --

P: --

U.K. Manufacturing PMI Prelim (Dec)

--

F: --

P: --

U.K. Composite PMI Prelim (Dec)

--

F: --

P: --

Euro Zone ZEW Economic Sentiment Index (Dec)

--

F: --

P: --

Germany ZEW Current Conditions Index (Dec)

--

F: --

P: --

Germany ZEW Economic Sentiment Index (Dec)

--

F: --

P: --

Euro Zone Trade Balance (Not SA) (Oct)

--

F: --

P: --

Euro Zone ZEW Current Conditions Index (Dec)

--

F: --

P: --

Euro Zone Trade Balance (SA) (Oct)

--

F: --

P: --

U.S. Retail Sales MoM (Excl. Automobile) (SA) (Oct)

--

F: --

P: --

Q&A with Experts
    • All
    • Chatrooms
    • Groups
    • Friends
    Connecting
    .
    .
    .
    Type here...
    Add Symbol or Code

      No matching data

      All
      Trump Updates
      Recommend
      Stocks
      Cryptocurrencies
      Central Banks
      Featured News
      • All
      • Russia-Ukraine Conflict
      • Middle East Flashpoint
      • All
      • Russia-Ukraine Conflict
      • Middle East Flashpoint
      Search
      Products

      Charts Free Forever

      Chats Q&A with Experts
      Screeners Economic Calendar Data Tools
      Membership Features
      Data Warehouse Market Trends Institutional Data Policy Rates Macro

      Market Trends

      Market Sentiment Order Book Forex Correlations

      Top Indicators

      Charts Free Forever
      Markets

      News

      News Analysis 24/7 Columns Education
      From Institutions From Analysts
      Topics Columnists

      Latest Views

      Latest Views

      Trending Topics

      Top Columnists

      Latest Update

      Signals

      Copy Rankings Latest Signals Become a signal provider AI Rating
      Contests
      Brokers

      Overview Brokers Assessment Rankings Regulators News Claims
      Broker listing Forex Brokers Comparison Tool Live Spread Comparison Scam
      Q&A Complaint Scam Alert Videos Tips to Detect Scam
      More

      Business
      Events
      Careers About Us Advertising Help Center

      White Label

      Data API

      Web Plug-ins

      Affiliate Program

      Awards Institution Evaluation IB Seminar Salon Event Exhibition
      Vietnam Thailand Singapore Dubai
      Fans Party Investment Sharing Session
      FastBull Summit BrokersView Expo
      Recent Searches
        Top Searches
          Markets
          News
          Analysis
          User
          24/7
          Economic Calendar
          Education
          Data
          • Names
          • Latest
          • Prev

          View All

          No data

          Scan to Download

          Faster Charts, Chat Faster!

          Download App
          English
          • English
          • Español
          • العربية
          • Bahasa Indonesia
          • Bahasa Melayu
          • Tiếng Việt
          • ภาษาไทย
          • Français
          • Italiano
          • Türkçe
          • Русский язык
          • 简中
          • 繁中
          Open Account
          Search
          Products
          Charts Free Forever
          Markets
          News
          Signals

          Copy Rankings Latest Signals Become a signal provider AI Rating
          Contests
          Brokers

          Overview Brokers Assessment Rankings Regulators News Claims
          Broker listing Forex Brokers Comparison Tool Live Spread Comparison Scam
          Q&A Complaint Scam Alert Videos Tips to Detect Scam
          More

          Business
          Events
          Careers About Us Advertising Help Center

          White Label

          Data API

          Web Plug-ins

          Affiliate Program

          Awards Institution Evaluation IB Seminar Salon Event Exhibition
          Vietnam Thailand Singapore Dubai
          Fans Party Investment Sharing Session
          FastBull Summit BrokersView Expo

          GBPUSD Falls Below The 100 Day MA. Technical Bias Shifts With The Break.

          Blue River

          Economic

          Forex

          Technical Analysis

          Summary:

          The GBPUSD is moving to a new low for the day ahead of the Fed rate decision.

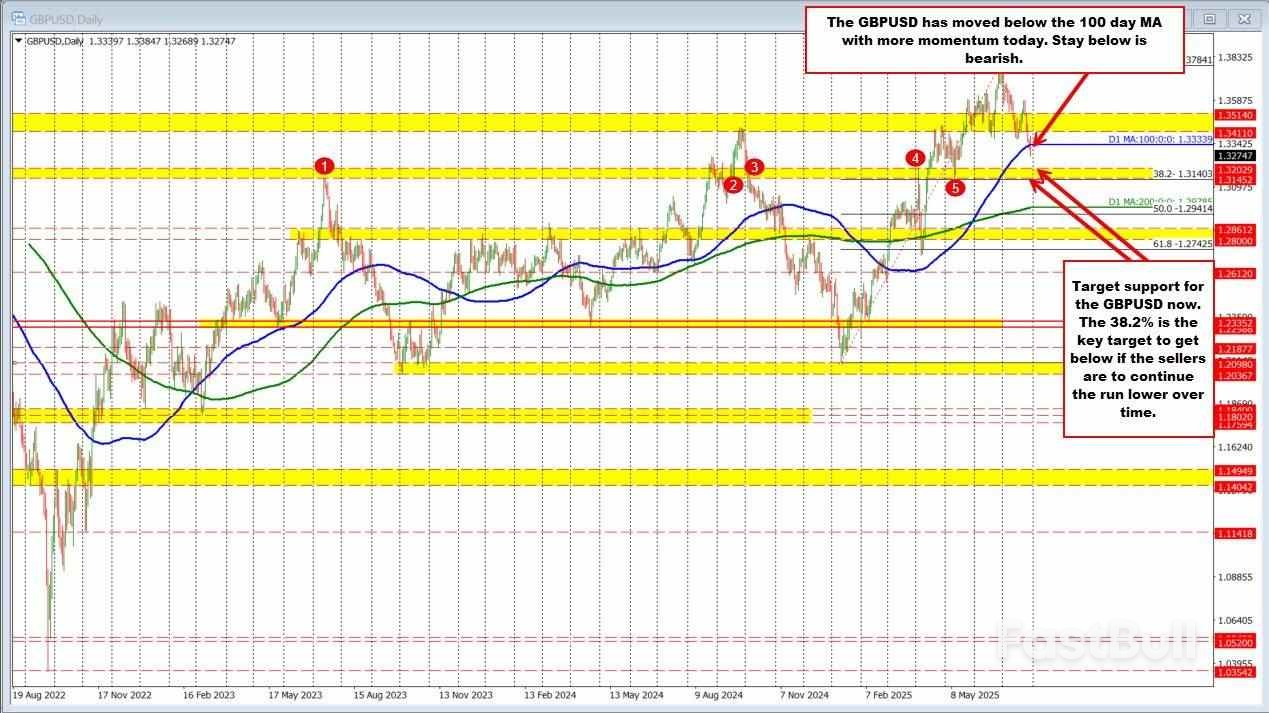
          The GBPUSD is extending to a new low today, as bearish pressure intensifies technically. This move is significant because the pair is now trading below its 100-day moving average, currently at 1.33339. That level had acted as a temporary floor yesterday, with buyers stepping in to defend it. However, today's price action shows a shift in sentiment, with sellers gaining more control and pushing the pair lower.

          The break below the 100-day moving average tilts the technical outlook more negatively. As long as price stays below that key moving average, bearish bias remains in play. The next major downside focus is the 38.2% retracement of the 2025 move up—from the low to the high—which comes in at 1.31403.

          That retracement level is further supported by a key swing area between 1.3145 and 1.3202, making it an important target and potential support zone. If sellers can drive through that region, the downside momentum could accelerate. For now, the battle lines are drawn between the 100-day MA above and a wide target of 1.3140–1.3200 below.

          The FOMC will meet later today with the Fed expected to leave rates unchanged. The question is will the Fed shift to a more dovish stance ahead of what will likely be a tick up in inflation due the tariff?

          Source: ForexLive

          To stay updated on all economic events of today, please check out our Economic calendar
          Risk Warnings and Disclaimers
          You understand and acknowledge that there is a high degree of risk involved in trading. Following any strategies or investment methods may lead to potential losses. The content on the site is provided by our contributors and analysts for information purposes only. You are solely responsible for determining whether any trading assets, securities, strategy, or any other product is suitable for investing based on your own investment objectives and financial situation.
          Add to Favorites
          Share

          The Two Simplest Reasons Not To Cut Rates

          Thomas

          Central Bank

          It’s safe to expect that we aren’t going to get a rate cut, and it’s safe to expect that the president will be unhappy about that. Besides that, probably the only drama to watch for will be whether we get dissents from Waller and Bowman. If that happens it would be the first time since 1993 that two Fed governors voted against the chair.

          Anyway, one reason we’re not going to get a rate cut today is that basically the economy seems to be doing fine, or at least a lot better than expected. This morning we got the first look at second quarter GDP, and it came in at 3.0% vs. expectations of just 2.6%. We also got the ADP employment report, which showed that private businesses added 104,000 jobs in July, which was higher than the 76,000 that economists had expected.

          Now yeah, sure, ADP doesn’t have a great track record of anticipating the government’s Non-Farm Payrolls report (which comes out Friday) but it adds to the data showing labor market resilience. Initial Jobless Claims have been coming down for weeks. Yesterday we got the Dallas Fed’s Services Activity survey, which showed a broad rebound across several measures, including hiring, which turned positive.

          It’s not that the economy is doing great, per se, but with measures of inflation still on the warm side, there’s no acute sign of labor market distress that warrant immediate attention.

          The other thing about rate cuts is that, even if we were to get them soon, they won’t accomplish what Trump wants them to, which is to make it easier for people to buy or refi their homes.

          Here’s what he posted on Truth Social today:

          You can lower rates in the short-term all you want, but if the market perceives that higher rates will be needed in the future in order to maintain the 2% inflation target, then rates at the long end (which is what mortgages or refis are linked to) will remain near today’s elevated level that constrains housing activity (and it is constraining housing activity, so Trump’s concern here is understandable).

          Earlier in this spring, there were clearer signs of economic deceleration, but concerns over tariff policy were making the Fed reluctant to react aggressively. Noe the picture is different. While tariff policy still seems to be changing by the day, the range of potential outcomes is narrowing as various deals get announced or signed. Meanwhile, the underlying data just isn’t looking as wobbly as it was, giving the Fed further scope to be patient.

          Source: Bloomberg Europe

          Risk Warnings and Disclaimers
          You understand and acknowledge that there is a high degree of risk involved in trading. Following any strategies or investment methods may lead to potential losses. The content on the site is provided by our contributors and analysts for information purposes only. You are solely responsible for determining whether any trading assets, securities, strategy, or any other product is suitable for investing based on your own investment objectives and financial situation.
          Add to Favorites
          Share

          Long Duration Bonds Could Be Poised for a Bullish Rebound

          Adam

          Bond

          Yesterday, we touched on the continued market bullishness, which seems unstoppable. However, one market area that has seen continued “bearishness” has been longer-duration bonds. Following the significant surge in 2024, bonds’ weakness has been the source for various media narratives of the “loss of US exceptionalism” and the “end of the debt bubble.”
          Bond yields currently trade in alignment with economic growth and inflation. However, there is a concern that economic growth is slowing, which would lead to lower bond yields and higher prices. The price chart of the iShares 20+ Year Treasury Bond ETF (NASDAQ:TLT) may suggest the same.
          However, from a trading perspective, bonds have been basing since January and have recently formed an inverse “head and shoulders” pattern. That consolidation pattern is a bullish setup for investors, and a break above 88 on the index will likely see significantly stronger bond prices emerge.
          Long Duration Bonds Could Be Poised for a Bullish Rebound_1
          Given that bonds are both a “risk-off” asset and a store for reserve currencies, we also see support for bond prices building in the US Dollar, which is also forming a base. If the dollar strengthens, this should lead to inflows into US bonds, helping support higher bond prices.
          Long Duration Bonds Could Be Poised for a Bullish Rebound_2
          With the building of exuberance in the stock market, a reversion in speculative assets could result in a rotation into currently undervalued assets. Given the long duration of time these assets have been under pressure, it is worth considering the potential for such a rotation. Historically, reversions to the mean tend to be significant moves, just like in the stock market. The Dollar Remains Dominant
          The graph below, courtesy of GaveKal Research, is making the rounds on X. The point is that the dollar is gaining global market share versus the Euro. Such is also true of the dollar versus other currencies. For those in the imminent dollar demise camp, here are a few facts worth considering:
          Per SWIFT, the dollar’s share of global payments is up to 48%, the highest in 13 years, as shown below. For those thinking the Chinese yuan could supplant the dollar, the yuan is roughly 3% of global payments.
          Almost 60% of global FX reserves are in dollars. That is about 3x gold and the next largest FX reserve, the euro.
          The US Dollar is also involved in nearly 90% of all foreign exchange transactions.
          The US economy accounts for about a quarter of the global economy. Additionally, throw in the fact that the US financial markets are the most liquid in the world, and it’s little wonder that there is no viable replacement for the dollar, despite the desires of some countries looking for one and some dollar bears calling for the immediate demise of the dollar.
          Long Duration Bonds Could Be Poised for a Bullish Rebound_3
          The graph below, from Michael Green, is the best way to show the logic that drives a Ponzi scheme in Bitcoin.
          The Ponzi scheme graph illustrates that there is a robust correlation between changes in the amount of Bitcoin held in funds (ETFs) and the price change. Simply, as new capital is used to buy Bitcoin, the price goes up. Conversely, when they sell, the price goes down. The graph below allows us to quantify that change. Per his research:
          Buying 50k in Bitcoin in a month raises the price of Bitcoin by about 18%.
          MicroStrategy (NASDAQ:MSTR), as we previously wrote HERE, is a money-losing company. However, they (and others) have been issuing stock and using the proceeds to buy Bitcoin. The graph illustrates that as funds accumulate, the price of Bitcoin increases reliably.
          Fund flows and prices of most other assets are not nearly as statistically correlated as the relationship shared below. However, what the graph doesn’t show is that as MicroStrategy and others add to their hoards, the profits on MicroStrategy’s existing Bitcoin holdings increase. For example, the company just issued $2.5 billion of preferred stock. That will allow MicroStrategy to buy approximately 21k Bitcoin. Based on the graph, that purchase should increase Bitcoin prices by over 7%. Here is the kicker: MicroStrategy already owns 607k Bitcoins. Thus, the $2.5 billion purchase is expected to result in a $5 billion gain on its existing holdings.
          As long as funds and companies like MicroStrategy and others continue to accumulate in aggregate, and the statistical correlation holds, the Ponzi scheme will work. However, selling, or even the threat of selling, could be very problematic and would reverse the Ponzi scheme spectacularly. Like all Ponzi schemes, this one will not last forever. In the words of legendary investor John Bogle:
          All Ponzi schemes ultimately fail because they depend on an ever-increasing flow of new money to sustain the illusion of profitability.
          Long Duration Bonds Could Be Poised for a Bullish Rebound_4

          Source: investing

          Risk Warnings and Disclaimers
          You understand and acknowledge that there is a high degree of risk involved in trading. Following any strategies or investment methods may lead to potential losses. The content on the site is provided by our contributors and analysts for information purposes only. You are solely responsible for determining whether any trading assets, securities, strategy, or any other product is suitable for investing based on your own investment objectives and financial situation.
          Add to Favorites
          Share

          Forex Market Alert: Dollar’s Vulnerable Position Ahead Of Crucial Fed Decision

          Samantha Luan

          Economic

          Forex

          Forex Market Alert: Dollar’s Vulnerable Position Ahead of Crucial Fed Decision

          As the world anticipates a pivotal Fed Decision Impact, the ripples are already being felt across currency markets, signaling potential implications for Bitcoin and altcoins. This article delves into the current state of the dollar and euro, examining the forces at play and what the upcoming central bank announcements might mean for global finance.

          Understanding the Pivotal Fed Decision Impact

          The Federal Reserve, often simply called ‘the Fed,’ stands as the central bank of the United States, wielding immense power over global financial markets. Its mandate includes fostering maximum employment, stable prices, and moderate long-term interest rates. The decisions made by the Federal Open Market Committee (FOMC), particularly concerning the federal funds rate, resonate far beyond U.S. borders, directly influencing the US Dollar Strength and, by extension, the entire global economy.

          So, why is this particular Fed decision so pivotal? In an environment grappling with persistent inflation and fluctuating economic growth, the Fed’s stance on monetary policy becomes a critical determinant of market direction. A hawkish stance (implying higher interest rates) typically strengthens the dollar as it makes dollar-denominated assets more attractive to foreign investors seeking higher returns. Conversely, a dovish pivot (suggesting lower rates or a pause in hikes) can weaken the dollar. The market’s anticipation of this decision, and any subtle shifts in the Fed’s language or ‘dot plot’ projections, can trigger significant currency movements even before the official announcement.

          Historically, moments leading up to Fed decisions are characterized by heightened volatility. Traders and investors meticulously analyze every piece of economic data – from inflation figures like the Consumer Price Index (CPI) and Producer Price Index (PPI) to employment reports suchances as Non-Farm Payrolls and GDP growth – trying to predict the Fed’s next move. A decision to pause rate hikes, or even hint at future cuts, could signal a shift in the Interest Rate Outlook, potentially easing financial conditions and impacting everything from bond yields to equity valuations and, crucially, currency valuations.

          Deconstructing the US Dollar Strength Conundrum

          The US Dollar Strength has been a defining feature of global finance for much of the past year, driven by aggressive interest rate hikes from the Federal Reserve aimed at taming inflation. However, recent economic data and evolving market expectations have started to chip away at this dominance, causing the dollar to slip slightly against a basket of major currencies. What factors are contributing to this conundrum?

          ● Cooling Inflation Signals: While inflation remains elevated, recent reports have shown signs of cooling, leading some market participants to believe that the Fed might be nearing the end of its tightening cycle. If inflation is indeed trending downwards, the urgency for further aggressive rate hikes diminishes, reducing the dollar’s appeal.
          ● Revised Rate Hike Expectations: Markets are constantly repricing the probability of future rate hikes. As economic indicators suggest a potential slowdown, or if other central banks become more hawkish, the relative advantage of holding dollars might lessen. Traders are now contemplating how many more hikes, if any, the Fed has left in its arsenal.
          ● Economic Data Performance: Mixed economic data from the U.S. has also played a role. While some sectors remain resilient, others show signs of softening, raising concerns about the potential for a recession. A weaker economic outlook can temper expectations for continued dollar strength, as it implies less robust investment opportunities.
          ● Yield Differentials: The attractiveness of a currency is heavily influenced by the interest rate it offers compared to others. As other major central banks, like the European Central Bank (ECB) or the Bank of England (BoE), continue to raise their rates, the yield differential that previously favored the dollar begins to narrow, reducing its relative appeal.

          This dynamic creates a complex environment for traders. While the dollar retains its status as a safe-haven asset during times of global uncertainty, its recent ‘slip’ suggests that the market is beginning to price in a more nuanced Interest Rate Outlook, potentially signaling a less aggressive Fed going forward. This shift is keenly watched by investors across all asset classes, including those in the volatile cryptocurrency market, as a weaker dollar can sometimes correlate with stronger commodity prices and, occasionally, a boost for risk assets like Bitcoin.

          Analyzing Euro Performance: Navigating a Labyrinth of Challenges

          While the dollar has experienced a slight softening, the Euro Performance has been under considerably more pressure, setting it up for a potential monthly loss against the dollar and other major currencies. The Eurozone, a diverse economic bloc, faces a unique set of challenges that continue to weigh on its currency. What are these obstacles, and how do they impact the Euro’s trajectory?

          ● Persistent Energy Crisis: Despite efforts to diversify, Europe remains significantly impacted by energy price volatility, particularly concerning natural gas. High energy costs feed into inflation and dampen industrial output, creating a drag on economic growth and undermining investor confidence in the Eurozone’s stability.
          ● Geopolitical Tensions: The ongoing conflict in Ukraine continues to cast a long shadow over European economies. The proximity of the conflict creates uncertainty, impacts trade routes, and necessitates significant spending on defense and aid, diverting resources from other areas of economic development.
          ● ECB’s Cautious Stance: While the European Central Bank (ECB) has been raising interest rates, its pace and rhetoric have often been perceived as more cautious compared to the Fed’s aggressive tightening. This divergence in the Interest Rate Outlook between the two major central banks means that the yield offered by Euro-denominated assets might still be less attractive than those in the U.S., leading to capital outflows from the Eurozone.
          ● Inflation Differentials: Although inflation is a global phenomenon, the specific drivers and persistence of inflation vary. In the Eurozone, inflation is often driven by supply-side shocks, which are harder for monetary policy to address effectively. This can lead to a situation where real interest rates (nominal rates minus inflation) remain negative, further eroding the Euro’s purchasing power.

          The combination of these factors creates a complex economic environment for the Eurozone, making the Euro Performance a barometer of the region’s resilience. The challenges are multifaceted, ranging from structural energy dependencies to the ongoing geopolitical landscape, all of which necessitate careful navigation by the ECB and member states. For investors, understanding these dynamics is crucial for assessing the Euro’s future potential and its role within broader Global Forex Trends.

          Navigating Global Forex Trends and Their Ripple Effects

          The movements of the US Dollar and Euro are not isolated events; they are integral components of broader Global Forex Trends that send ripple effects across the entire financial ecosystem. The interconnectedness of currencies means that a significant shift in one pair can trigger adjustments in others, influencing everything from trade balances to commodity prices and even the highly volatile cryptocurrency markets.

          When the US Dollar Strength wanes, for example, it can make dollar-denominated commodities like oil and gold cheaper for holders of other currencies, potentially boosting their demand and price. This dynamic is crucial for commodity-exporting nations and can impact global inflation. Conversely, a stronger dollar makes imports more expensive for the U.S., potentially dampening inflation but also impacting corporate earnings for multinational companies.

          Similarly, the struggles in Euro Performance can have widespread implications. A weaker Euro makes Eurozone exports more competitive but makes imports more expensive, contributing to domestic inflation. It can also impact cross-border investments and the profitability of companies operating within the Eurozone, affecting their global standing.

          The concept of ‘carry trade’ is also a significant element in Global Forex Trends. This involves borrowing in a low-interest-rate currency and investing in a high-interest-rate currency. Divergent Interest Rate Outlooks between central banks can fuel or unwind these trades, leading to substantial capital flows and currency volatility. For instance, if the Fed maintains a higher rate than the ECB, it encourages capital to flow into dollar-denominated assets, bolstering the dollar and potentially pressuring the Euro.

          Furthermore, currency volatility often spills over into other asset classes. In times of extreme uncertainty, the dollar traditionally acts as a ‘safe-haven’ currency, attracting capital from riskier assets. However, if the dollar itself is showing signs of vulnerability, investors might seek alternative safe havens, or conversely, be more inclined to take on risk in other markets, including the nascent but growing cryptocurrency space. The interplay between traditional forex markets and digital assets is becoming increasingly apparent, as macro-economic shifts can dictate the broader risk appetite that influences Bitcoin and altcoin prices.

          The Crucial Interest Rate Outlook: Divergent Paths and Future Implications

          The divergence in the Interest Rate Outlook between major central banks is arguably the most significant driver of current Global Forex Trends. While central banks worldwide have been engaged in a synchronized fight against inflation, their individual economic circumstances and policy mandates are leading them down increasingly divergent paths. This divergence has profound implications for currency valuations and the broader financial landscape.

          The Federal Reserve, having embarked on an aggressive rate-hiking cycle, is now grappling with the question of whether its tightening has gone far enough to bring inflation under control without tipping the economy into a severe recession. The market is keenly watching for signals of a ‘pause’ or even future ‘cuts’ from the Fed, which would significantly alter the US Dollar Strength trajectory. A pivot towards easing would likely weaken the dollar as its yield advantage diminishes.

          In contrast, the European Central Bank (ECB) has been more cautious, starting its rate hikes later and often at a slower pace than the Fed. The ECB faces a complex balancing act: fighting inflation while navigating the unique challenges of the Eurozone, including varied economic performance among member states and the ongoing energy crisis. The market’s perception of the ECB’s commitment to tightening relative to the Fed directly impacts the Euro Performance. If the ECB is perceived as lagging behind, the Euro is likely to remain under pressure.

          Here’s a simplified comparison of their potential paths:

          Central BankCurrent StanceKey ChallengePotential Future PathCurrency Impact
          Federal Reserve (Fed)Aggressive tightening, now assessing impact.Balancing inflation control vs. recession risk.Potential pause or slower hikes; market eyeing cuts.Dollar potentially weakens if cuts priced in.
          European Central Bank (ECB)Raising rates, but more cautiously.Energy crisis, geopolitical risks, diverse Eurozone economies.Continued hikes, but pace uncertain; ‘data-dependent.’Euro faces headwinds if perceived as lagging Fed.

          The implications of these divergent paths are far-reaching. They influence capital flows, as investors seek higher returns in currencies with more attractive interest rates. They affect corporate profitability, as businesses navigate varying borrowing costs and currency exchange rates. And for individual consumers, they impact everything from mortgage rates to the cost of imported goods. Understanding this intricate dance of central bank policies and their resulting Interest Rate Outlook is fundamental to comprehending the current state and future direction of global finance.

          Challenges and Opportunities in a Volatile Forex Landscape

          The current volatility in the forex market, driven by shifts in US Dollar Strength and Euro Performance amidst a changing Interest Rate Outlook, presents both significant challenges and unique opportunities for businesses, investors, and even individuals.

          Challenges:

          ● Increased Uncertainty for Businesses: Companies engaged in international trade face greater currency risk. Fluctuating exchange rates can erode profit margins for exporters and increase costs for importers, making financial planning more complex.
          ● Inflationary Pressures: A weakening domestic currency makes imports more expensive, contributing to inflation. This can squeeze household budgets and put pressure on central banks to continue tightening, even if economic growth is slowing.
          ● Investment Risk: For investors with international portfolios, currency movements can significantly impact returns. A strong dollar can diminish the value of overseas investments when converted back to dollars, and vice-versa.

          Opportunities:

          ● Strategic Hedging: Businesses can implement hedging strategies (e.g., using forward contracts or options) to lock in exchange rates and mitigate currency risk, providing greater predictability in their international transactions.
          ● Diversification for Investors: Periods of currency volatility highlight the importance of a diversified investment portfolio. Holding assets denominated in different currencies can help cushion against adverse movements in a single currency. For crypto investors, understanding these macro shifts can inform decisions on stablecoin holdings or timing of entries/exits into riskier digital assets.
          ● Arbitrage Opportunities: For sophisticated traders, significant currency fluctuations can create arbitrage opportunities, albeit with inherent risks and requiring rapid execution.

          Navigating these Global Forex Trends requires vigilance and a deep understanding of the underlying economic forces. It’s not just about predicting the next Fed move, but also about appreciating the broader macroeconomic narrative and its potential ripple effects across all markets.

          Actionable Insights for Investors and Traders

          In a landscape defined by a volatile Forex Market Alert and shifting central bank policies, how can investors and traders best position themselves? Here are some actionable insights:

          1.Monitor Central Bank Communications Closely: Pay close attention to statements from the Federal Reserve, European Central Bank, and other major central banks. Beyond just interest rate announcements, the accompanying press conferences and minutes often contain subtle clues about future policy direction and the evolving Interest Rate Outlook.
          2.Stay Updated on Key Economic Indicators: Data releases such as inflation rates (CPI, PPI), employment figures (Non-Farm Payrolls, unemployment rate), GDP growth, and consumer confidence surveys provide critical insights into the health of economies and can influence central bank decisions.
          3.Understand Inter-Market Correlations: Recognize that currency movements don’t happen in isolation. A weaker US Dollar Strength or struggling Euro Performance can impact commodity prices, bond yields, equity markets, and even cryptocurrency valuations. Develop a holistic view of the financial ecosystem.
          4.Consider Diversification: Don’t put all your eggs in one basket. Diversifying across different asset classes (equities, bonds, commodities, real estate, and digital assets) and geographical regions can help mitigate risks associated with currency fluctuations and specific regional economic downturns.
          5.Manage Risk Prudently: Given the heightened volatility, employing robust risk management strategies is paramount. This includes setting stop-loss orders, managing position sizes, and avoiding over-leveraging, especially in highly sensitive markets like forex and crypto.
          6.Educate Yourself Continuously: The global financial landscape is constantly evolving. Continuously learning about macroeconomics, geopolitical events, and technological advancements (like those in the crypto space) will empower you to make more informed decisions.

          Conclusion: The Unfolding Narrative of Global Currencies

          The slight slip of the US Dollar and the sustained monthly loss for the Euro ahead of the crucial Fed decision underscore a period of significant transition and uncertainty in the global financial markets. The interplay between the Fed Decision Impact, the evolving narrative around US Dollar Strength, and the ongoing challenges affecting Euro Performance is creating a complex tapestry of Global Forex Trends. Underlying all these movements is the critical Interest Rate Outlook, as central banks worldwide navigate the delicate balance between taming inflation and avoiding economic downturns.

          For investors, traders, and even the general public, understanding these dynamics is no longer a niche interest but a necessity. The ripples from currency markets can affect everything from the cost of goods to the value of investment portfolios, including digital assets. As central banks continue to adapt their policies in response to evolving economic data, the volatility in forex markets is likely to persist. Staying informed, exercising prudence, and adopting a holistic view of global finance will be key to navigating this unfolding narrative successfully.

          Source: CryptoSlate

          To stay updated on all economic events of today, please check out our Economic calendar
          Risk Warnings and Disclaimers
          You understand and acknowledge that there is a high degree of risk involved in trading. Following any strategies or investment methods may lead to potential losses. The content on the site is provided by our contributors and analysts for information purposes only. You are solely responsible for determining whether any trading assets, securities, strategy, or any other product is suitable for investing based on your own investment objectives and financial situation.
          Add to Favorites
          Share

          Oil News: WTI Crude Hits Key $69.89 Resistance—Will Bulls Break Through?

          Adam

          Commodity

          WTI crude stalls below $69.89 resistance after June breakdown

          Oil News: WTI Crude Hits Key $69.89 Resistance—Will Bulls Break Through?_1Daily Light Crude Oil Futures

          Light crude oil futures retreated on Wednesday, pulling back after failing to clear key resistance at $69.89—the 50% retracement of the June selloff from $77.09 to $62.69. This level has now capped gains for two consecutive sessions and serves as a critical trigger for directional momentum. A sustained move above $69.89 could open the door for a test of the June high at $77.09, while a pullback to $65.38 would still be technically bullish.
          At 09:47 GMT, Light Crude Oil futures are trading $68.87, down $0.34 or -0.49%.
          The market remains above the long-term pivot at $65.38, supported further by the 200-day moving average at $63.99 and the 50-day at $62.10. The crossover of the 200-day above the 50-day signals a bullish bias in the broader trend. Price action continues to consolidate within this structure, awaiting a breakout catalyst.

          Ongoing pressure on Russian crude flows raises geopolitical risk premium

          Traders are closely tracking U.S. President Donald Trump’s tightened ultimatum on Russia, demanding progress toward ending the war in Ukraine within 10 to 12 days. The administration is threatening 100% secondary tariffs on countries continuing to trade Russian oil, a move aimed squarely at China and India—Moscow’s largest customers.
          Analysts at JP Morgan expect India to comply with U.S. demands, potentially displacing 2.3 million bpd of Russian barrels. China, on the other hand, is unlikely to bend, raising the risk of tariff escalation. Treasury Secretary Scott Bessent warned that China could face significant duties if it maintains its Russian crude intake.
          PVM’s John Evans noted that any resulting gap in global supply would take time to fill, even if Saudi Arabia and OPEC step in. This lag adds further support to near-term prices. Vanda Insights estimates a $4–$5 per barrel risk premium is already baked in.

          Mexican exports drop sharply as Pemex prioritizes domestic refining

          Adding to supply-side pressure, Mexico’s Pemex slashed exports by 39% year-over-year in June, down to 458,103 bpd—the lowest monthly volume since records began in 1990. The drop aligns with Mexico’s ongoing push for energy “sovereignty,” prioritizing domestic refining. Output remains constrained at 1.6 million bpd, well below the company’s stated goal of 1.8 million.
          Pemex also reduced refined product imports by 38% last month as its new Olmeca refinery absorbed more feedstock. While the company aims to boost production via private partnerships, execution remains limited.

          Oil prices forecast: Bullish bias holds above $65.38 support

          Crude remains technically constructive while holding above $65.38 and both major moving averages. Resistance at $69.89 has proven sticky, but a breakout above it could fuel an upside run toward $77.09.
          With geopolitical risks intact, supply constraints building, and inventory draws anticipated, the market maintains a cautiously bullish tone.

          Source: fxempire

          Risk Warnings and Disclaimers
          You understand and acknowledge that there is a high degree of risk involved in trading. Following any strategies or investment methods may lead to potential losses. The content on the site is provided by our contributors and analysts for information purposes only. You are solely responsible for determining whether any trading assets, securities, strategy, or any other product is suitable for investing based on your own investment objectives and financial situation.
          Add to Favorites
          Share

          CNBC’s UK Exchange newsletter: Strong Footsie, strong UK? Not necessarily

          Adam

          Economic

          The dispatch

          Ian Holloway, one of the most eccentric managers in British football, is famous for his idioms and sayings.
          One of his most celebrated came when, in May 2004, his Queens Park Rangers team had secured promotion to England’s second tier: “They say every dog has his day — and today is Woof Day. Today I just want to bark.”
          Lately, the FTSE-100 , long a dog among equity indices, has been enjoying its very own Woof Day. Britain’s premier stock index is up 11% so far this year and has this month achieved a couple of notable benchmarks.
          The index, launched on Jan. 3, 1984, with a value of 1,000, hit the 9,000 milestone for the first time on July 15 and followed that up on Thursday last week by hitting the latest in a string of all-time closing highs of 9,138.37.
          It has taken just two years to go from 8,000 to 9,000 compared with the seven painstaking years it took to rise from 7,000 to 8,000.
          The Footsie’s year-to-date performance is one of the best in global stock markets. It has outperformed other well-known benchmarks such as the S&P 500, the Nikkei 225 and the CAC-40, with the DAX-40 in Germany one of the few peers to have eclipsed it. This outperformance of the S&P 500, should it be sustained, is pretty rare.
          The Footsie has only outdone the U.S. benchmark twice over the course of a year — in 2016 and 2022 — since the eruption of the global financial crisis 18 years ago. That reflects not only the dynamism and growth potential of the S&P’s constituents, chiefly the tech sector, but also the Footsie’s over-weighting in what are perceived by many investors as stodgier, defensive sectors, such as financials and consumer staples, and highly cyclical sectors such as energy and mining.
          Accordingly, even after the recent performance, it is still sitting on a price/earnings multiple only just above its long-term average of 15 whereas the S&P — which, we should not forget, also hit a record last week — still trades on a multiple of almost 30.
          Those ratings reflect the very different factors that have driven returns. While capital appreciation has driven just over two-thirds of the S&P’s total return over the years, roughly half of the Footsie’s total return has come from dividends.
          The attachment of U.K. investors to dividends, something regularly disparaged as ‘coupon clipping’ down the years, is pronounced.
          The Footsie’s solid showing last week was for similar reasons to the rallies elsewhere: relief at the U.S. achieving a deal with Japan over tariffs and optimism that something similar can be achieved with the European Union, although the latter has proved disappointing, at least so far as European equity markets have been concerned.
          But there have been other, broader factors also at play during 2025.
          The Footsie’s heavy gearing toward defensive stocks has played well this year as investors seek a shelter from Trump-induced volatility. There is also a lot of anecdotal evidence that it has benefited from some investors taking their money outside the U.S. — something that was particularly evident in the first four months of the year and summed up in the expression, which first appeared in the Wall Street Journal on May 19, the ‘ABUSA (Anywhere But USA) trade’.
          And there have been important boosts for individual sectors, most notably defense, following commitments from a number of Western governments to raise defense spending.
          Rolls-Royce, the aircraft engine manufacturer which also has a substantial defense business, has seen its shares rise by 75% so far this year. BAE Systems , the U.K.’s biggest defense contractor, is up 59% since the beginning of the year. The pair are now respectively the sixth and 11th biggest companies in the index.
          Specific elements on the day the Footsie hit its most recent record last week included strong earnings updates from a host of constituents, most notably Reckitt, the household products group; Howden Joinery, the kitchen and joinery supplier and Lloyds Banking Group.
          Even BT, a serial disappointment, rose sharply after quarterly results proved no worse than expected. That day also saw a decline in the pound — a factor that often benefits the index because Footsie constituents derive four-fifths of their earnings overseas, mainly in U.S. dollars and euros.
          This was a point not greatly appreciated by some investors until the U.K. voted to leave the EU on June 23, 2016, and the pound fell by 10% against the greenback in a matter of hours.
          Initially, the Footsie fell sharply, in line with other U.K. assets. However, as realization dawned that a weaker pound translates into higher earnings from overseas revenues, the index rallied and, a week later, it was some 2.6% higher than it had been before the referendum.
          And this, in turn, leads to probably the most significant fact lost on many ordinary British investors. The Footsie is commonly perceived to be a barometer of U.K. economic — and, certainly, corporate — health.

          Globalization

          The truth is that it is not in the slightest bit reflective of the U.K. economy. Yes, there are some companies — BT and Lloyds being good examples — that derive the majority of their earnings in the U.K.
          However, the Footsie is also packed with companies that do little or no business in the U.K., such as Antofagasta, a Chilean copper miner; Fresnillo, a Mexican silver miner; Mondi, a global leader in paper and packaging with 100 production sites around the world but none in Britain; and Ashtead Group, a plant and tool hire company that derives more than 90% of its earnings from the U.S., where it trades under the name Sunbelt Rentals — the name it will take when it moves its primary stock listing early in 2026.
          Even a number of businesses traditionally seen as quintessentially British to the extent that they have (or have had) the word in their company moniker, such as BP, BAE Systems and British American Tobacco, derive the majority of their earnings outside the U.K.
          Of the 20 biggest companies in the Footsie, only Lloyds Banking Group and NatWest Group, another lender, make the majority of their earnings in the U.K.
          It did not always used to be this way.
          At its launch, 41 years ago, the Footsie was full of companies that made the majority, if not all, of their sales and profits in the U.K., including a clutch of domestically oriented brewing, pub and hotel operators in Scottish & Newcastle, Bass, Whitbread, Grand Metropolitan and Allied Lyons; two flat pack furniture and joinery companies in Magnet & Southerns and MFI; and a whole host of then U.K.-focused retailers, including Burton Group, House of Fraser, Sears (no relation to the U.S. retailer of the same name), British Home Stores, Marks & Spencer and Great Universal Stores.
          With globalization yet to take off — this was, of course, before the fall of the Berlin Wall — even those financial services companies in the Footsie were largely domestically focused, including the insurers Commercial Union and General Accident (now both part of Aviva Group), Prudential and Sun Life and lenders such as Royal Bank of Scotland, Midland Bank (now part of HSBC) and Barclays, which was yet to embark on its push into the wholesale and investment banking activities with which it is most closely associated these days.
          At its birth, the Footsie contained only a handful of companies that could be regarded as genuinely international in scope, including a couple which dated back to the old British Empire: Consolidated Gold Fields, founded in South Africa in 1887 by the imperialist Cecil Rhodes and Harrisons & Crosfield, now the specialty chemicals company Elementis but then best known for owning Malaysian rubber plantations.
          Then came globalization and, with it down the years, a string of IPOs of foreign companies, particularly from South Africa, wishing to tap into London’s more liquid capital markets.
          In being so internationally focused, the Footsie is no different from the DAX-40, whose members derive around four-fifths of their earnings from outside Germany or the CAC-40, whose constituents make around three-quarters of their earnings from outside France.
          But it certainly should not be taken as a barometer of corporate Britain’s health — however good it makes some of us feel on days when it hits new highs.

          Source: cnbc

          To stay updated on all economic events of today, please check out our Economic calendar
          Risk Warnings and Disclaimers
          You understand and acknowledge that there is a high degree of risk involved in trading. Following any strategies or investment methods may lead to potential losses. The content on the site is provided by our contributors and analysts for information purposes only. You are solely responsible for determining whether any trading assets, securities, strategy, or any other product is suitable for investing based on your own investment objectives and financial situation.
          Add to Favorites
          Share

          Euro Bulls Have the ECB in their Corner

          Warren Takunda

          Economic

          'Long' positioning in the Euro is being washed out of the system following the sealing of a new EU-U.S. trade accord, but a host of analysts say the currency's spell of weakness should be a temporary state of affairs.
          This is because the market will switch focus from trade wars to interest rate dynamics, ensuring the European Central Bank (ECB) will become a source of support for the currency over the remainder of this year.
          "With the EU and U.S. having reached a trade deal, there is less reason for the ECB to cut policy rates further, especially with the economy proving more resilient this year and monetary transmission working effectively," says Mark Wall, Chief Economist at Deutsche Bank. "Further easing is now a risk scenario rather than baseline, and arguably a greater risk in December/March than in September."
          The Euro has outperformed the Dollar and other peer currencies amidst the heightened trade tensions of 2025; U.S. President Donald Trump's reset of U.S. trade relationships rightly captured investor attention, allowing FX markets to veer away from traditional drivers.
          One of those traditional drivers is interest rate differentials, which have not traditionally favoured the Euro as the ECB has been quick to cut interest rates in the current cycle.
          But, this is changing: the ECB's recent decision to hold interest rates suggests the Eurozone's central bank is about to end the cutting cycle ahead of the Bank of England and Federal Reserve.
          "At its July meeting, ECB President Christine Lagarde effectively indicated a pause ahead, while hinting that the council may even be done cutting rates altogether," says Matthew Ryan, Head of Market Strategy at Ebury.
          Euro Bulls Have the ECB in their Corner_1

          Above: Scale of further interest rate cuts still to come, suggesting 50/50 odds the ECB is done.

          This should steady Eurozone interest rates relative to those in the UK and U.S., to the benefit of the Euro.
          Nomura's strategists have been buyers of the Euro against the Pound since early June, on ongoing monetary policy divergence and fiscal issues, "but the scale of the change in tone was surprising," says Nomura FX Strategist Dominic Bunning of the ECB's July guidance.
          "With market pricing still implying close to one further cut this cycle, there should be more rates driven upside for the EUR. As a follow up to this we raise our target to 0.8975 – aligned with the highs seen in early 2023," he adds.
          EUR/GBP at 0.8975 gives a GBP/EUR target of 1.1140.
          Money market pricing shows the Bank of England is expected to cut interest rates on three more occasions, twice more in 2025 and once more in 2026. This represents a 75 basis point curve of cuts, which is similar to the pricing for the Federal Reserve.
          "We maintain our bullish EUR/USD thesis – a hawkish ECB only further bolsters a robust case for EUR appreciation based on both US-RoW rate convergence as well as technical factors," says Morgan Stanley.Euro Bulls Have the ECB in their Corner_2

          Above: Money market pricing shows the Bank of England will cut three more times to take the base rate to 3.5%. Image courtesy of Goldman Sachs.

          Both are deeper than the mere 25 priced for the ECB. In fact, the market currently prices 15 basis points for the ECB over the remainder of the year, meaning a good portion of the market thinks the cycle is complete.
          "The upshot is the trade deal defuses a major external downside risk to the Eurozone economy and reinforces the case for the ECB to stay on hold. The implication is there is room for the swaps curve to shift higher in favour of EUR," says Elias Haddad, Senior Markets Strategist at Brown Brothers Harriman.
          He says the ECB’s pause, coupled with political pressure on the Fed to ease, offers EUR/USD support. "We see EUR/USD carving out a bottom around 1.1500." Beyond the near-term, Brown Brothers Harriman says the underlying EUR/USD uptrend is intact.
          Risks to the bullish EUR view include deeper falls in Eurozone inflationary pressures than current ECB projections allow for.
          Another is that the 15% tariffs agreed with the U.S. prove to be a bigger burden on European businesses than expected, culminating in a slowdown that prompts the ECB to deliver further cuts.
          "Trade optimism is running high after a trade deal was struck between the US and EU over the weekend... But with markets already pricing a positive outcome, bouts of volatility remain possible," says Mark Haefele, Chief Investment Officer at UBS Global Wealth Management.

          Source: Poundsterlinglive

          To stay updated on all economic events of today, please check out our Economic calendar
          Risk Warnings and Disclaimers
          You understand and acknowledge that there is a high degree of risk involved in trading. Following any strategies or investment methods may lead to potential losses. The content on the site is provided by our contributors and analysts for information purposes only. You are solely responsible for determining whether any trading assets, securities, strategy, or any other product is suitable for investing based on your own investment objectives and financial situation.
          Add to Favorites
          Share
          FastBull
          Copyright © 2025 FastBull Ltd

          728 RM B 7/F GEE LOK IND BLDG NO 34 HUNG TO RD KWUN TONG KLN HONG KONG

          TelegramInstagramTwitterfacebooklinkedin
          App Store Google Play Google Play
          Products
          Charts

          Chats

          Q&A with Experts
          Screeners
          Economic Calendar
          Data
          Tools
          Membership
          Features
          Function
          Markets
          Copy Trading
          Latest Signals
          Contests
          News
          Analysis
          24/7
          Columns
          Education
          Company
          Careers
          About Us
          Contact Us
          Advertising
          Help Center
          Feedback
          User Agreement
          Privacy Policy
          Business

          White Label

          Data API

          Web Plug-ins

          Poster Maker

          Affiliate Program

          Risk Disclosure

          The risk of loss in trading financial instruments such as stocks, FX, commodities, futures, bonds, ETFs and crypto can be substantial. You may sustain a total loss of the funds that you deposit with your broker. Therefore, you should carefully consider whether such trading is suitable for you in light of your circumstances and financial resources.

          No decision to invest should be made without thoroughly conducting due diligence by yourself or consulting with your financial advisors. Our web content might not suit you since we don't know your financial conditions and investment needs. Our financial information might have latency or contain inaccuracy, so you should be fully responsible for any of your trading and investment decisions. The company will not be responsible for your capital loss.

          Without getting permission from the website, you are not allowed to copy the website's graphics, texts, or trademarks. Intellectual property rights in the content or data incorporated into this website belong to its providers and exchange merchants.

          Not Logged In

          Log in to access more features

          FastBull Membership

          Not yet

          Purchase

          Become a signal provider
          Help Center
          Customer Service
          Dark Mode
          Price Up/Down Colors

          Log In

          Sign Up

          Position
          Layout
          Fullscreen
          Default to Chart
          The chart page opens by default when you visit fastbull.com