• Trade
  • Markets
  • Copy
  • Contests
  • News
  • 24/7
  • Calendar
  • Q&A
  • Chats
Trending
Screeners
SYMBOL
LAST
BID
ASK
HIGH
LOW
NET CHG.
%CHG.
SPREAD
SPX
S&P 500 Index
6857.13
6857.13
6857.13
6865.94
6827.13
+7.41
+ 0.11%
--
DJI
Dow Jones Industrial Average
47850.93
47850.93
47850.93
48049.72
47692.96
-31.96
-0.07%
--
IXIC
NASDAQ Composite Index
23505.13
23505.13
23505.13
23528.53
23372.33
+51.04
+ 0.22%
--
USDX
US Dollar Index
98.890
98.970
98.890
98.980
98.890
-0.090
-0.09%
--
EURUSD
Euro / US Dollar
1.16537
1.16545
1.16537
1.16555
1.16408
+0.00092
+ 0.08%
--
GBPUSD
Pound Sterling / US Dollar
1.33394
1.33405
1.33394
1.33396
1.33165
+0.00123
+ 0.09%
--
XAUUSD
Gold / US Dollar
4217.60
4218.05
4217.60
4218.25
4194.54
+10.43
+ 0.25%
--
WTI
Light Sweet Crude Oil
59.282
59.319
59.282
59.469
59.187
-0.101
-0.17%
--

Community Accounts

Signal Accounts
--
Profit Accounts
--
Loss Accounts
--
View More

Become a signal provider

Sell trading signals to earn additional income

View More

Guide to Copy Trading

Get started with ease and confidence

View More

Signal Accounts for Members

All Signal Accounts

Best Return
  • Best Return
  • Best P/L
  • Best MDD
Past 1W
  • Past 1W
  • Past 1M
  • Past 1Y

All Contests

  • All
  • Trump Updates
  • Recommend
  • Stocks
  • Cryptocurrencies
  • Central Banks
  • Featured News
Top News Only
Share

India's NIFTY IT Index Last Up 1.3%

Share

India's Nifty 50 Index Rises 0.35%

Share

Israel Sets 2026 Defence Budget At $34 Billion

Share

Russia Says Azov Sea's Port Of Temryuk Damaged In Ukrainian Attack

Share

Israel's Defense Budget For 2026 Will Be 112 Billion Israeli Shekels - Defense Minister Office

Share

One India Rate Panel Member Ram Singh Was Of View That Stance Should Be Changed To 'Accommodative' From 'Neutral' - Monetary Policy Committee Statement

Share

Reserve Bank Of India Chief: Will Continue To Meet Productive Needs Of Economy In Proactive Manner

Share

Reserve Bank Of India Chief: System Level Financial Parameters Of Nbfcs Sound

Share

Reserve Bank Of India Chief: Dollar Rupee Swap To Be For 3 Years, To Be Conducted This Month

Share

India's Nifty Realty Index Extend Gains, Last Up 1.4%

Share

India's Nifty Psu Bank Index Rises 1%

Share

Reserve Bank Of India Chief: Commited To Providing Sufficient Durable Liquidity

Share

Reserve Bank Of India Chief: Transmission Has Been Broad Based Across Sectors, Satisfactory

Share

Reserve Bank Of India Chief: As Of Nov 28, India's Forex Reserves Stood At $686 Billion

Share

Reserve Bank Of India Chief: Healthy Services Exports With Strong Remittances To Keep Cad Modest In This Year

Share

Reserve Bank Of India Chief: CPI Inflation Seen At 0.6% In Q3 Fy26

Share

Reserve Bank Of India Chief: Fy26 CPI Inflation Seen At 2% Versus 2.6% Previously

Share

India's Nifty Realty Index Up 1% After Reserve Bank Of India's Rate Cut

Share

India's Nifty Psu Bank Index Turns Positive, Up 0.43% After Reserve Bank Of India's Rate Cut

Share

Reserve Bank Of India Chief: Merchandise Exports Face Some Headwinds

TIME
ACT
FCST
PREV
Turkey Trade Balance

A:--

F: --

P: --

Germany Construction PMI (SA) (Nov)

A:--

F: --

P: --

Euro Zone IHS Markit Construction PMI (Nov)

A:--

F: --

P: --

Italy IHS Markit Construction PMI (Nov)

A:--

F: --

P: --

U.K. Markit/CIPS Construction PMI (Nov)

A:--

F: --

P: --

France 10-Year OAT Auction Avg. Yield

A:--

F: --

P: --

Euro Zone Retail Sales MoM (Oct)

A:--

F: --

P: --

Euro Zone Retail Sales YoY (Oct)

A:--

F: --

P: --

Brazil GDP YoY (Q3)

A:--

F: --

P: --

U.S. Challenger Job Cuts (Nov)

A:--

F: --

P: --

U.S. Challenger Job Cuts MoM (Nov)

A:--

F: --

P: --

U.S. Challenger Job Cuts YoY (Nov)

A:--

F: --

P: --

U.S. Initial Jobless Claims 4-Week Avg. (SA)

A:--

F: --

P: --

U.S. Weekly Initial Jobless Claims (SA)

A:--

F: --

P: --

U.S. Weekly Continued Jobless Claims (SA)

A:--

F: --

P: --

Canada Ivey PMI (SA) (Nov)

A:--

F: --

P: --

Canada Ivey PMI (Not SA) (Nov)

A:--

F: --

P: --

U.S. Non-Defense Capital Durable Goods Orders Revised MoM (Excl. Aircraft) (SA) (Sept)

A:--

F: --

P: --
U.S. Factory Orders MoM (Excl. Transport) (Sept)

A:--

F: --

P: --

U.S. Factory Orders MoM (Sept)

A:--

F: --

P: --

U.S. Factory Orders MoM (Excl. Defense) (Sept)

A:--

F: --

P: --

U.S. EIA Weekly Natural Gas Stocks Change

A:--

F: --

P: --

Saudi Arabia Crude Oil Production

A:--

F: --

P: --

U.S. Weekly Treasuries Held by Foreign Central Banks

A:--

F: --

P: --

Japan Foreign Exchange Reserves (Nov)

A:--

F: --

P: --

India Repo Rate

A:--

F: --

P: --

India Benchmark Interest Rate

A:--

F: --

P: --

India Reverse Repo Rate

A:--

F: --

P: --

India Cash Reserve Ratio

A:--

F: --

P: --

Japan Leading Indicators Prelim (Oct)

A:--

F: --

P: --

U.K. Halifax House Price Index YoY (SA) (Nov)

--

F: --

P: --

U.K. Halifax House Price Index MoM (SA) (Nov)

--

F: --

P: --

France Current Account (Not SA) (Oct)

--

F: --

P: --

France Trade Balance (SA) (Oct)

--

F: --

P: --

France Industrial Output MoM (SA) (Oct)

--

F: --

P: --

Italy Retail Sales MoM (SA) (Oct)

--

F: --

P: --

Euro Zone Employment YoY (SA) (Q3)

--

F: --

P: --

Euro Zone GDP Final YoY (Q3)

--

F: --

P: --

Euro Zone GDP Final QoQ (Q3)

--

F: --

P: --

Euro Zone Employment Final QoQ (SA) (Q3)

--

F: --

P: --

Euro Zone Employment Final (SA) (Q3)

--

F: --

P: --
Brazil PPI MoM (Oct)

--

F: --

P: --

Mexico Consumer Confidence Index (Nov)

--

F: --

P: --

Canada Unemployment Rate (SA) (Nov)

--

F: --

P: --

Canada Labor Force Participation Rate (SA) (Nov)

--

F: --

P: --

Canada Employment (SA) (Nov)

--

F: --

P: --

Canada Part-Time Employment (SA) (Nov)

--

F: --

P: --

Canada Full-time Employment (SA) (Nov)

--

F: --

P: --

U.S. Dallas Fed PCE Price Index YoY (Sept)

--

F: --

P: --

U.S. PCE Price Index YoY (SA) (Sept)

--

F: --

P: --

U.S. PCE Price Index MoM (Sept)

--

F: --

P: --

U.S. Personal Outlays MoM (SA) (Sept)

--

F: --

P: --

U.S. Core PCE Price Index MoM (Sept)

--

F: --

P: --

U.S. UMich 5-Year-Ahead Inflation Expectations Prelim YoY (Dec)

--

F: --

P: --

U.S. Core PCE Price Index YoY (Sept)

--

F: --

P: --

U.S. 5-10 Year-Ahead Inflation Expectations (Dec)

--

F: --

P: --

U.S. UMich Current Economic Conditions Index Prelim (Dec)

--

F: --

P: --

U.S. UMich Consumer Sentiment Index Prelim (Dec)

--

F: --

P: --

U.S. UMich 1-Year-Ahead Inflation Expectations Prelim (Dec)

--

F: --

P: --

U.S. UMich Consumer Expectations Index Prelim (Dec)

--

F: --

P: --

Q&A with Experts
    • All
    • Chatrooms
    • Groups
    • Friends
    Connecting
    .
    .
    .
    Type here...
    Add Symbol or Code

      No matching data

      All
      Trump Updates
      Recommend
      Stocks
      Cryptocurrencies
      Central Banks
      Featured News
      • All
      • Russia-Ukraine Conflict
      • Middle East Flashpoint
      • All
      • Russia-Ukraine Conflict
      • Middle East Flashpoint
      Search
      Products

      Charts Free Forever

      Chats Q&A with Experts
      Screeners Economic Calendar Data Tools
      Membership Features
      Data Warehouse Market Trends Institutional Data Policy Rates Macro

      Market Trends

      Market Sentiment Order Book Forex Correlations

      Top Indicators

      Charts Free Forever
      Markets

      News

      News Analysis 24/7 Columns Education
      From Institutions From Analysts
      Topics Columnists

      Latest Views

      Latest Views

      Trending Topics

      Top Columnists

      Latest Update

      Signals

      Copy Rankings Latest Signals Become a signal provider AI Rating
      Contests
      Brokers

      Overview Brokers Assessment Rankings Regulators News Claims
      Broker listing Forex Brokers Comparison Tool Live Spread Comparison Scam
      Q&A Complaint Scam Alert Videos Tips to Detect Scam
      More

      Business
      Events
      Careers About Us Advertising Help Center

      White Label

      Data API

      Web Plug-ins

      Affiliate Program

      Awards Institution Evaluation IB Seminar Salon Event Exhibition
      Vietnam Thailand Singapore Dubai
      Fans Party Investment Sharing Session
      FastBull Summit BrokersView Expo
      Recent Searches
        Top Searches
          Markets
          News
          Analysis
          User
          24/7
          Economic Calendar
          Education
          Data
          • Names
          • Latest
          • Prev

          View All

          No data

          Scan to Download

          Faster Charts, Chat Faster!

          Download App
          English
          • English
          • Español
          • العربية
          • Bahasa Indonesia
          • Bahasa Melayu
          • Tiếng Việt
          • ภาษาไทย
          • Français
          • Italiano
          • Türkçe
          • Русский язык
          • 简中
          • 繁中
          Open Account
          Search
          Products
          Charts Free Forever
          Markets
          News
          Signals

          Copy Rankings Latest Signals Become a signal provider AI Rating
          Contests
          Brokers

          Overview Brokers Assessment Rankings Regulators News Claims
          Broker listing Forex Brokers Comparison Tool Live Spread Comparison Scam
          Q&A Complaint Scam Alert Videos Tips to Detect Scam
          More

          Business
          Events
          Careers About Us Advertising Help Center

          White Label

          Data API

          Web Plug-ins

          Affiliate Program

          Awards Institution Evaluation IB Seminar Salon Event Exhibition
          Vietnam Thailand Singapore Dubai
          Fans Party Investment Sharing Session
          FastBull Summit BrokersView Expo

          Fed End QT: Federal Reserve Ends Tightening Program

          Justin

          Central Bank

          Summary:

          In a major shift in U.S monetary policy, the federal reserve has officially ended its three year quantitative tightening (QT) program, marking one of the most significant pivots since the post pandemic economic recovery. The move signals a transition from balance sheet reduction to liquidity stabilization as the central bank seeks to maintain healthy banking system and guide inflation back towards target levels.

          In a major shift in U.S monetary policy, the federal reserve has officially ended its three year quantitative tightening (QT) program, marking one of the most significant pivots since the post pandemic economic recovery. The move signals a transition from balance sheet reduction to liquidity stabilization as the central bank seeks to maintain healthy banking system and guide inflation back towards target levels.

          Source: X

          Fed halts balance sheet reduction after shrinking $2.2 Trillion

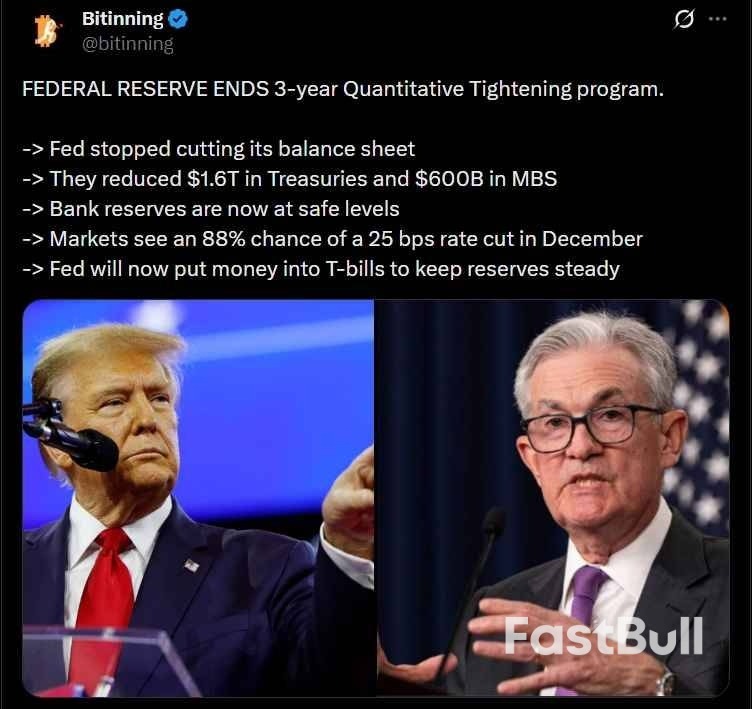
          The federal reserve has stopped cutting its balance sheet, ending a QT cycle that ran from 2022 to 2024. During this period, the fed allowed assets to roll off without reinvestment reducing:

          • $1.6 trillion in U.S treasuries

          • $600 billion in mortgage backed securities (MBS)

          This marks one of the largest balance sheet contractions in its history and reflects the central banks attempt to reverse the excessive liquidity created during covid era stimulus.

          Bank Reserves return to safe and stable levels

          With QT ending, the Fed signaled the bank reserves have reached a comfortable and safe level reducing the risk of stress in short term funding assets. This is critical because excessively low reserves can trigger tightening in the repo market– a flashpoint to avoid after the volatile 2019 trading volume squeeze.

          Market Expect a December rate cut as odds hit 88%

          Following the policy shift, traders now see an 88% probability of a 25 bps rate cut in December. The market confidence has strengthened due to:

          • Easing inflation pressures

          • Steady labor market cooling

          • The Fed pivoting away from aggressive tightening

          A rate cut would mark the first step towards a more accommodative environment that could support risk assets, lending activity and broader market funding conditions.

          The Federal Reserve's decision to end its three-year QT cycle and shift toward liquidity support is being viewed as a bullish catalyst across the crypto assets. Traders expect improved dollar funding, higher risk appetite, and a potential December rate cut—all factors that typically boost digital assets.

          With bank reserves stabilizing and preparing to add liquidity through T-bill purchases, Bitcoin and altcoins often benefit from easier financial conditions, stronger capital flows, and renewed market momentum.

          If its pivot develops into a broader easing cycle, analysts anticipate increased inflows into crypto, stronger demand for risk assets, and a more favorable macro backdrop heading into the next phase.

          Fed to boost liquidity through T-Bill purchases

          Instead of shrinking its balance sheet further, the Federal Reserve will shift to purchasing treasury bills (T-bills) to keep reserves from failing. This approach allows the Fed to:

          • Stabilize the level of reserves in the banking system

          • Maintain flexibility in its balance sheet composition

          • Prevent tightening from resurging unintentionally

          This move is widely seen as a strategic transition to a steady state balance sheet policy

          The Fed's decision to end its three year Quantitative tightening program is a major turning point in U.S monetary strategy. With bank reserves now stable,

          Expectations for a December rate cut elevated, and the central bank shifting to T-bill purchases to maintain liquidity, markets are preparing for a more supportive policy environment.

          The upcoming Decision will reveal whether this pivot evolves into a full easing cycle, shaping the economic landscape in the months ahead.

          Source: CryptoSlate

          Risk Warnings and Disclaimers
          You understand and acknowledge that there is a high degree of risk involved in trading. Following any strategies or investment methods may lead to potential losses. The content on the site is provided by our contributors and analysts for information purposes only. You are solely responsible for determining whether any trading assets, securities, strategy, or any other product is suitable for investing based on your own investment objectives and financial situation.
          Add to Favorites
          Share

          Boeing stock jumps 8% as CFO says company expects higher 737, 787 deliveries next year

          Adam

          Stocks

          Boeing is continuing to express optimism about its business as the company wraps up the year and looks at 2026.
          Chief Financial Officer Jay Malave said Tuesday at a UBS conference that the company expects deliveries of both its 737 and 787 jets to be up next year.
          “When you now fast forward to 2026, we’re going to be increasing our deliveries,” Malave said.
          Boeing’s stock rose more than 8% in midday trading Tuesday after Malave’s comments.
          He added that he expects the certification for the 737-10 aircraft, which is years behind schedule, to come later in 2026.
          The bolstered deliveries will be “a big driver” of cash flow as well, Malave said, with positive free cash flow expected to be in the billions in the “low single digits.” Boeing hasn’t turned an annual profit since 2018.
          Malave also said the company expects that cash margins will get a “pretty significant boost” through 2030 due to the higher productivity.
          Boeing has been experiencing an upward trend after a period of increased scrutiny following the blowout of a door plug on a flight in January 2024. In July, CEO Kelly Ortberg said the company was beginning to see changes in its business, including slashing its quarterly losses.
          Boeing saw a strong delivery pace in October, putting it on track for its highest annual delivery total since 2018. The company said its jetliner deliveries drove it back into cash-positive territory for the first time in nearly two years in October.
          Those deliveries follow a lifting of restrictions by the Federal Aviation Administration, allowing the company to sign off on some of its 737 Max and 787 Dreamliner planes before they reach customers.

          Source: cnbc

          Risk Warnings and Disclaimers
          You understand and acknowledge that there is a high degree of risk involved in trading. Following any strategies or investment methods may lead to potential losses. The content on the site is provided by our contributors and analysts for information purposes only. You are solely responsible for determining whether any trading assets, securities, strategy, or any other product is suitable for investing based on your own investment objectives and financial situation.
          Add to Favorites
          Share

          Silver Pulls Back After Hitting Record as Rally Momentum Shows Signs of Exhaustion

          Gerik

          Economic

          Commodity

          Silver Retreats After Overextended Rally

          Silver prices dropped 1.8% to $56.97 an ounce in London on Tuesday, slipping from their recent record after a powerful six-day surge. At one point during the session, silver was down as much as 2.4%, trading roughly $1.70 below its all-time high. The pullback appears to be a technical correction, rather than a shift in fundamentals, as indicators signaled that the rally had become overheated.
          The 14-day Relative Strength Index (RSI) briefly crossed above 70 an important threshold suggesting overbought conditions. This reading typically signals the potential for a short-term reversal as traders reassess stretched momentum trades.

          Overbought Signal Prompts a 'Natural Pullback'

          Ole Hansen, Head of Commodity Strategy at Saxo Bank, described the dip as a “natural pullback” following sharp gains. He noted that the structural bull case remains intact, particularly if prices remain above the support range of $54.5–$55 per ounce. This suggests that the correction may reflect healthy consolidation within an ongoing uptrend, rather than a deeper reversal.
          Silver had climbed more than 8% across just two sessions before the decline, primarily driven by expectations of tight global supply and increased speculative demand. These expectations were compounded by inventory stress in major trading hubs. While London received record inflows of silver in October to ease pressure, the Shanghai Futures Exchange now reports stockpiles at decade-low levels signaling a shift in supply tightness to Asia.

          Investor Demand Driving Gains Despite Weak Physical Markets

          TD Securities strategist Daniel Ghali noted that while industrial and jewelry demand expectations have declined, investment demand has taken over as the primary price driver. He added that silver's recent rally has now “moved beyond rational momentum,” citing especially weak physical trading in London’s over-the-counter market as evidence of a divergence between price action and physical fundamentals.
          This shift from physical to financial demand introduces a risk of volatility, as speculative positioning can reverse quickly in response to macroeconomic news or technical triggers.

          Gold-Silver Ratio Signals Possible Turning Point

          The gold-silver ratio a measure of how many ounces of silver are needed to purchase one ounce of gold has dropped to its lowest point in over a year. This shift indicates silver's recent outperformance and may suggest a potential inflection point, especially for traders who watch inter-metal spreads for trend reversals.
          Gold also fell on Tuesday, declining 1% to $4,191.25 per ounce, as some traders locked in gains ahead of next week's anticipated U.S. Federal Reserve policy meeting. Platinum and palladium similarly lost ground, though the Bloomberg Dollar Spot Index remained flat, implying that currency dynamics were not the primary driver of precious metal movements on the day.

          Rate Cut Expectations Remain a Supportive Backdrop

          Despite the correction, the macro backdrop remains supportive for precious metals. Markets are pricing in a near-certain 25-basis-point interest rate cut from the Federal Reserve at its December meeting. Since precious metals yield no income, they tend to benefit in low-rate environments where opportunity costs diminish and monetary easing boosts their appeal as alternative stores of value.
          Silver's retreat from record highs reflects a temporary cooling of momentum rather than a fundamental shift in the metal’s outlook. Technical overbought signals and reduced physical demand are prompting short-term traders to take profits, but the structural narrative anchored in supply tightness and dovish central bank expectations remains supportive. As long as silver prices hold above key support levels, the broader bullish trend is likely to resume once speculative froth clears.

          Source: Bloomberg

          To stay updated on all economic events of today, please check out our Economic calendar
          Risk Warnings and Disclaimers
          You understand and acknowledge that there is a high degree of risk involved in trading. Following any strategies or investment methods may lead to potential losses. The content on the site is provided by our contributors and analysts for information purposes only. You are solely responsible for determining whether any trading assets, securities, strategy, or any other product is suitable for investing based on your own investment objectives and financial situation.
          Add to Favorites
          Share

          Eurozone Inflation Inches Up, Reinforcing Case for ECB to Keep Rates Steady

          Gerik

          Economic

          Marginal Rise in Inflation Supports Cautious ECB Stance

          Data released by Eurostat shows that eurozone consumer prices increased by 2.2% in November compared to the same period last year, slightly above October’s 2.1% and the 2.1% forecast by economists surveyed by Bloomberg. The slight uptick remains within close range of the ECB’s 2% target, providing validation for its current monetary policy trajectory.
          Core inflation, which excludes food and energy, held steady at 2.4%, signaling persistent underlying price pressures. The most notable component, services inflation, also edged higher and remains a primary source of concern, as it reflects domestic cost drivers such as wage growth.

          National Variations Highlight Asymmetric Recovery

          The inflation picture across the euro area remains uneven. Germany saw a pickup in inflation, while France’s rate was flat and Spain and Italy posted declines. These national disparities are partly driven by base effects and local economic dynamics, complicating the ECB’s job of maintaining price stability across the entire bloc.
          This divergence does not appear to shift the broader trend, which has shown stabilization of inflation near target since early 2025. Still, individual member states’ inflation trajectories introduce a layer of complexity to policymaking and may delay any unified signal toward easing.

          ECB Reiterates Confidence in Current Rate Path

          ECB President Christine Lagarde reinforced the central bank’s satisfaction with its policy position, stating that the inflation cycle appears well-managed and that current rates are “set correctly.” The deposit facility rate stands at 2%, following eight consecutive quarter-point cuts from a peak of 4%.
          This position has broad support from market participants, who expect no further rate cuts through 2026. The upcoming ECB meeting in December will include fresh economic projections extending to 2028, but officials caution that one-time factors such as a postponed EU carbon pricing initiative may temporarily suppress inflation data, without altering the underlying trajectory.

          Wage Pressures Pose a Sticky Threat to Services Inflation

          One driver behind the persistently elevated services inflation is wage catch-up, where salary increases lagging behind past inflation continue to filter through the system. However, the ECB’s collective bargaining tracker indicates a moderation in wage growth going forward, suggesting inflationary momentum in services may ease over time.
          Bloomberg Economics analyst David Powell noted that service inflation’s resistance to decline has been a critical concern, as it reflects domestic pressures rather than global shocks. Still, he emphasized that broader disinflationary trends are likely to remain intact as wage growth reverts to equilibrium levels.

          Stable but Conditional Policy

          Despite the mild inflation uptick, the ECB appears firmly positioned to hold rates steady unless there is a marked change in economic or geopolitical conditions. Vice President Luis de Guindos acknowledged that while no rate adjustments are currently priced in, flexibility remains in case external shocks disrupt the benign inflation backdrop.
          This conditional stance underscores the ECB’s commitment to a data-dependent approach. The causal relationship between wage normalization and stable inflation supports the current rate pause, but policymakers remain alert to the risks posed by global conflicts, supply disruptions, or shifts in consumer sentiment.
          The November inflation print provides the ECB with further justification to maintain its current policy. While core and services inflation continue to hover slightly above target, wage trends and national divergences suggest that overall price pressures are manageable. As the eurozone economy shows tentative signs of momentum, the ECB is likely to remain in a holding pattern, balancing vigilance with confidence that its monetary toolkit has already steered inflation toward a sustainable path.

          Source: Bloomberg

          To stay updated on all economic events of today, please check out our Economic calendar
          Risk Warnings and Disclaimers
          You understand and acknowledge that there is a high degree of risk involved in trading. Following any strategies or investment methods may lead to potential losses. The content on the site is provided by our contributors and analysts for information purposes only. You are solely responsible for determining whether any trading assets, securities, strategy, or any other product is suitable for investing based on your own investment objectives and financial situation.
          Add to Favorites
          Share

          Big Tech’s High-Spending AI Pivot Challenges Its Low-Cost Growth Legacy

          Gerik

          Economic

          Stocks

          Big Tech’s Capital-Light Playbook Faces a Structural Shift

          For over two decades, dominant players like Alphabet, Amazon, Meta, and Microsoft thrived on a lean model: generate massive profits while spending relatively little. That model is now under pressure. The push to lead in artificial intelligence has drastically increased capital intensity, threatening the cost-efficiency that made these firms investor favorites.
          According to Bloomberg data, the four companies are expected to spend more than $380 billion in the current fiscal year an increase of over 1,300% from a decade ago with much of that directed toward chips, servers, and data center infrastructure. Microsoft’s capex alone is now 25% of revenue, more than triple its level from 10 years ago and higher than most energy or telecom companies.
          This sharp increase marks a causal transformation in the business model. AI’s promise of long-term productivity and revenue growth comes at the cost of massive near-term investment, challenging the previous low-risk, high-return tech narrative.

          Investor Optimism Persists But Cracks Are Emerging

          So far, the market has largely embraced the spending spree. Microsoft is up 15% year-to-date, and trades at more than 28 times forward earnings above both its 10-year average and the S&P 500’s multiple of 22. However, the tolerance for speculative AI investment is not unlimited.
          Meta’s recent experience offers a cautionary tale. After CEO Mark Zuckerberg failed to provide a clear monetization path for the company’s AI investments during Q3 earnings, Meta shares plunged 11% its worst day in three years and have since fallen further. This shows how investor confidence is closely tied to perceived payoff timelines.

          Depreciation, Cash Flow Pressures, and Rising Debt Weigh on Outlook

          One underappreciated risk of the AI race is rising depreciation tied to specialized infrastructure. Hedge fund manager Michael Burry has suggested these AI assets may depreciate faster than assumed, which would hurt reported profits and create earnings shocks in the future. Such an accounting shift would reduce the long-term earnings multiple justification currently underpinning tech valuations.
          Moreover, AI spending is beginning to erode free cash flow. Alphabet’s free cash flow is projected to decline to $63 billion this year, down from $73 billion in 2024. Meta and Microsoft are expected to show negative free cash flow after accounting for dividends and buybacks, limiting their ability to return capital to shareholders.
          To finance these expenditures, companies are increasingly tapping debt markets and private financing. Meta, for instance, issued $30 billion in bonds and raised another $30 billion in private funds moves that expose it to refinancing risk and raise concerns over long-term leverage ratios.

          AI Investment Brings Strategic Convergence and Competitive Collision

          Historically, the major tech companies operated in relatively distinct segments. But AI’s centrality has collapsed these boundaries, forcing Microsoft, Meta, Google, and Amazon into direct competition. As Callodine Capital CEO Jim Morrow observes, these firms are now in “a high capital intensity AI business model” with uncertain payoffs.
          This convergence creates not only pricing pressure and race-to-scale dynamics but also the risk of overspending in unproven areas. If AI productivity gains fail to materialize at the pace or scale assumed, tech stocks priced for precision could see valuations compress dramatically.

          Market Risks Rise as Big Tech Bets Big on AI

          The pivot to AI marks a foundational shift for Big Tech from capital-efficient platforms to infrastructure-heavy operators. While investors have so far accepted higher spending in exchange for future innovation, emerging cracks in earnings, free cash flow, and confidence especially as seen with Meta suggest this tolerance is conditional.
          The causal link between AI capital intensity and deteriorating financial metrics will be closely watched in the coming quarters. Should companies fail to demonstrate tangible returns, the market may reassess the premiums currently awarded to tech leaders. In a sector that now comprises a third of the S&P 500’s weight, the consequences of a miscalculation would ripple far beyond Silicon Valley.

          Source: Bloomberg

          To stay updated on all economic events of today, please check out our Economic calendar
          Risk Warnings and Disclaimers
          You understand and acknowledge that there is a high degree of risk involved in trading. Following any strategies or investment methods may lead to potential losses. The content on the site is provided by our contributors and analysts for information purposes only. You are solely responsible for determining whether any trading assets, securities, strategy, or any other product is suitable for investing based on your own investment objectives and financial situation.
          Add to Favorites
          Share

          Bitcoin Price Rebounds To $91,000 Amid Institutional Buying

          Olivia Brooks

          Cryptocurrency

          ●Bitcoin surges to $91,000 due to institutional interest.
          ●Driven by Fed rate cut expectations.
          ●Investor confidence grows despite previous decline.

          Bitcoin's price has surged back to $91,000 as of late November 2025, buoyed by institutional investor activity and favorable macroeconomic signals, notably due to potential Federal Reserve rate cuts.

          This resurgence highlights market sensitivity to economic policy shifts, influencing both Bitcoin's valuation and wider cryptocurrency sentiment, with Ethereum also seeing gains above $3,000.

          Bitcoin's price reached $91,000 in late November 2025, marking a strong recovery from previous lows near $80,000.

          This rebound matters as it signals renewed institutional interest and aligns with expectations for a potential Federal Reserve rate cut.

          Institutional Demand Boosts Bitcoin to $91,000

          Bitcoin has experienced a notable recovery attributed to macroeconomic optimism and institutional investor movements. Wall Street's growing interest in digital assets has driven increased trading volumes. Experts highlight support levels as crucial for ongoing price rallies.

          The rebound follows an approximately 20% decline over the past month, impacted by market fluctuations and selling pressure from US-based investors. Analysts like Daan Crypto Trades emphasize the importance of the $89,000-$91,000 range.

          Market Sees Surge as Fed Rate Cut Anticipated

          The immediate effect on the cryptocurrency market has been significant, with a surge in trading volumes and increased buying pressure. Institutional trading volumes hitting $78 billion indicate significant inflows pushing the price above $91,000. Institutional investors leading the charge reflect heightened confidence.

          Economically, expectations of a Federal Reserve rate cut have bolstered risk asset sentiment, further influencing Bitcoin's price trajectory. Ethereum similarly reacted, surpassing the $3,000 mark.

          History of Bitcoin Rallies Following Monetary Easing

          Similar rebounds have been observed during periods of anticipated monetary easing. Historical trends show support levels around $89,000-$91,000 often foreshadowing further rallies.

          Experts speculate on potential outcomes, citing past rallies where sustained price levels led to significant gains. Michael Feroli, Economist at J.P. Morgan, noted,

          "While the next FOMC meeting remains a close call, we now believe the latest round of Fedspeak tilts the odds toward the Committee deciding to cut rates in two weeks from today,"

          linking to increased BTC bullish sentiment.

          Continued institutional interest and macroeconomic factors remain pivotal for future price stability.

          Source: CryptoSlate

          Risk Warnings and Disclaimers
          You understand and acknowledge that there is a high degree of risk involved in trading. Following any strategies or investment methods may lead to potential losses. The content on the site is provided by our contributors and analysts for information purposes only. You are solely responsible for determining whether any trading assets, securities, strategy, or any other product is suitable for investing based on your own investment objectives and financial situation.
          Add to Favorites
          Share

          Shorting US Stocks Is Risky as Economic Strength and AI Momentum Fuel Bullish Pressure

          Gerik

          Economic

          Stocks

          AI Optimism and Economic Resilience Undermine Short Positions

          As 2025 draws to a close, 22V Research warns that betting against U.S. equities could prove costly. According to strategists led by Dennis Debusschere, robust consumer spending and continued capital expenditure on artificial intelligence projects are reinforcing market fundamentals. This combination could sustain corporate earnings and propel stocks higher, despite intermittent volatility and fears of overvaluation in the AI sector.
          Shorting equities, they argue, requires a high conviction that the economic backdrop will materially weaken or that AI investment will sharply reverse—two scenarios that currently lack strong evidence.

          Short Sellers Whipsawed by Market Reversals

          Recent market action illustrates how treacherous it has become for short sellers. U.S. equity short positions incurred $80 billion in mark-to-market losses in the final week of November alone, according to S3 Partners. These losses effectively erased the nearly $95 billion in gains accumulated earlier that month. The rapid reversal reflects a causal relationship between market momentum shifts and the forced unwinding of bearish bets.
          Hedge funds responded by covering index and ETF shorts at the fastest pace in five months, Goldman Sachs data shows. This reaction further contributed to market rallies, fueling a feedback loop where every market dip draws in buyers and punishes bearish positioning.

          Corporate Earnings and Consumer Spending Show Resilience

          Despite lingering concerns over inflation and a softening labor market, corporate fundamentals remain supportive of equity valuations. Strategas Asset Management forecasts 12.5% profit growth over the next year for U.S. companies. Meanwhile, consumer demand has held firm. Mastercard SpendingPulse data showed Black Friday sales rose 4.1% year-over-year, reflecting resilient consumption that continues to support earnings growth.
          These data points challenge the bearish narrative that elevated rates and slowing employment will drag on the economy. Instead, they reinforce the view that economic conditions remain broadly favorable, making bearish strategies riskier.

          Federal Reserve Rate Cut Expectations Add to Bullish Momentum

          Another critical factor supporting the market is the anticipated policy shift from the Federal Reserve. A rate cut is now expected at the upcoming December 9–10 meeting, a development that could stimulate further economic activity and ease financial conditions. This expectation has helped flip 22V’s proprietary quantitative model into what they call an “everything rally,” signaling broad-based bullish momentum across asset classes.
          December is historically one of the most favorable months for equities. The S&P 500 has posted an average gain of 1.4% during the month and finished higher 73% of the time, according to LPL Financial. The rally typically intensifies in the second half of the month, building around the 11th trading day. This seasonal pattern compounds the risk for short sellers who may be forced to cover in anticipation of or in response to accelerating gains.
          The experience of Beyond Meat, which soared 37% in a single day despite no fundamental news, exemplifies the risk of sharp short squeezes. From a low of $0.52 in mid-October, the stock surged nearly sevenfold before collapsing again. As Roundhill Investments CEO Dave Mazza notes, the cost of holding bearish positions is rising fast in an environment where sentiment can pivot overnight.

          Shorting in a Bullish Macro Environment Is Increasingly Hazardous

          While volatility and policy uncertainty remain, the underlying strength of the U.S. economy and ongoing enthusiasm for AI-driven innovation have made it difficult for bearish investors to maintain positions. Strong corporate earnings, healthy consumer spending, and favorable seasonal trends all contribute to an environment where dips are being consistently bought, forcing short sellers to unwind and driving markets higher.
          Unless clear signs of macroeconomic deterioration or a collapse in AI capital expenditure emerge, the structural forces currently favor bulls. For now, shorting U.S. equities remains a high-risk endeavor in a market environment driven by both fundamentals and momentum.

          Source: Bloomberg

          To stay updated on all economic events of today, please check out our Economic calendar
          Risk Warnings and Disclaimers
          You understand and acknowledge that there is a high degree of risk involved in trading. Following any strategies or investment methods may lead to potential losses. The content on the site is provided by our contributors and analysts for information purposes only. You are solely responsible for determining whether any trading assets, securities, strategy, or any other product is suitable for investing based on your own investment objectives and financial situation.
          Add to Favorites
          Share
          FastBull
          Copyright © 2025 FastBull Ltd

          728 RM B 7/F GEE LOK IND BLDG NO 34 HUNG TO RD KWUN TONG KLN HONG KONG

          TelegramInstagramTwitterfacebooklinkedin
          App Store Google Play Google Play
          Products
          Charts

          Chats

          Q&A with Experts
          Screeners
          Economic Calendar
          Data
          Tools
          Membership
          Features
          Function
          Markets
          Copy Trading
          Latest Signals
          Contests
          News
          Analysis
          24/7
          Columns
          Education
          Company
          Careers
          About Us
          Contact Us
          Advertising
          Help Center
          Feedback
          User Agreement
          Privacy Policy
          Business

          White Label

          Data API

          Web Plug-ins

          Poster Maker

          Affiliate Program

          Risk Disclosure

          The risk of loss in trading financial instruments such as stocks, FX, commodities, futures, bonds, ETFs and crypto can be substantial. You may sustain a total loss of the funds that you deposit with your broker. Therefore, you should carefully consider whether such trading is suitable for you in light of your circumstances and financial resources.

          No decision to invest should be made without thoroughly conducting due diligence by yourself or consulting with your financial advisors. Our web content might not suit you since we don't know your financial conditions and investment needs. Our financial information might have latency or contain inaccuracy, so you should be fully responsible for any of your trading and investment decisions. The company will not be responsible for your capital loss.

          Without getting permission from the website, you are not allowed to copy the website's graphics, texts, or trademarks. Intellectual property rights in the content or data incorporated into this website belong to its providers and exchange merchants.

          Not Logged In

          Log in to access more features

          FastBull Membership

          Not yet

          Purchase

          Become a signal provider
          Help Center
          Customer Service
          Dark Mode
          Price Up/Down Colors

          Log In

          Sign Up

          Position
          Layout
          Fullscreen
          Default to Chart
          The chart page opens by default when you visit fastbull.com