Markets
News
Analysis
User
24/7
Economic Calendar
Education
Data
- Names
- Latest
- Prev


Signal Accounts for Members
All Signal Accounts
All Contests


Turkey Trade BalanceA:--
F: --
P: --
Germany Construction PMI (SA) (Nov)A:--
F: --
P: --
Euro Zone IHS Markit Construction PMI (Nov)A:--
F: --
P: --
Italy IHS Markit Construction PMI (Nov)A:--
F: --
P: --
U.K. Markit/CIPS Construction PMI (Nov)A:--
F: --
P: --
France 10-Year OAT Auction Avg. YieldA:--
F: --
P: --
Euro Zone Retail Sales MoM (Oct)A:--
F: --
P: --
Euro Zone Retail Sales YoY (Oct)A:--
F: --
P: --
Brazil GDP YoY (Q3)A:--
F: --
P: --
U.S. Challenger Job Cuts (Nov)A:--
F: --
P: --
U.S. Challenger Job Cuts MoM (Nov)A:--
F: --
P: --
U.S. Challenger Job Cuts YoY (Nov)A:--
F: --
P: --
U.S. Initial Jobless Claims 4-Week Avg. (SA)A:--
F: --
P: --
U.S. Weekly Initial Jobless Claims (SA)A:--
F: --
P: --
U.S. Weekly Continued Jobless Claims (SA)A:--
F: --
P: --
Canada Ivey PMI (SA) (Nov)A:--
F: --
P: --
Canada Ivey PMI (Not SA) (Nov)A:--
F: --
P: --
U.S. Non-Defense Capital Durable Goods Orders Revised MoM (Excl. Aircraft) (SA) (Sept)A:--
F: --
U.S. Factory Orders MoM (Excl. Transport) (Sept)A:--
F: --
P: --
U.S. Factory Orders MoM (Sept)A:--
F: --
P: --
U.S. Factory Orders MoM (Excl. Defense) (Sept)A:--
F: --
P: --
U.S. EIA Weekly Natural Gas Stocks ChangeA:--
F: --
P: --
Saudi Arabia Crude Oil ProductionA:--
F: --
P: --
U.S. Weekly Treasuries Held by Foreign Central BanksA:--
F: --
P: --
Japan Foreign Exchange Reserves (Nov)A:--
F: --
P: --
India Repo RateA:--
F: --
P: --
India Benchmark Interest RateA:--
F: --
P: --
India Reverse Repo RateA:--
F: --
P: --
India Cash Reserve RatioA:--
F: --
P: --
Japan Leading Indicators Prelim (Oct)A:--
F: --
P: --
U.K. Halifax House Price Index YoY (SA) (Nov)--
F: --
P: --
U.K. Halifax House Price Index MoM (SA) (Nov)--
F: --
P: --
France Current Account (Not SA) (Oct)--
F: --
P: --
France Trade Balance (SA) (Oct)--
F: --
P: --
France Industrial Output MoM (SA) (Oct)--
F: --
P: --
Italy Retail Sales MoM (SA) (Oct)--
F: --
P: --
Euro Zone Employment YoY (SA) (Q3)--
F: --
P: --
Euro Zone GDP Final YoY (Q3)--
F: --
P: --
Euro Zone GDP Final QoQ (Q3)--
F: --
P: --
Euro Zone Employment Final QoQ (SA) (Q3)--
F: --
P: --
Euro Zone Employment Final (SA) (Q3)--
F: --
Brazil PPI MoM (Oct)--
F: --
P: --
Mexico Consumer Confidence Index (Nov)--
F: --
P: --
Canada Unemployment Rate (SA) (Nov)--
F: --
P: --
Canada Labor Force Participation Rate (SA) (Nov)--
F: --
P: --
Canada Employment (SA) (Nov)--
F: --
P: --
Canada Part-Time Employment (SA) (Nov)--
F: --
P: --
Canada Full-time Employment (SA) (Nov)--
F: --
P: --
U.S. Dallas Fed PCE Price Index YoY (Sept)--
F: --
P: --
U.S. PCE Price Index YoY (SA) (Sept)--
F: --
P: --
U.S. PCE Price Index MoM (Sept)--
F: --
P: --
U.S. Personal Outlays MoM (SA) (Sept)--
F: --
P: --
U.S. Core PCE Price Index MoM (Sept)--
F: --
P: --
U.S. UMich 5-Year-Ahead Inflation Expectations Prelim YoY (Dec)--
F: --
P: --
U.S. Core PCE Price Index YoY (Sept)--
F: --
P: --
U.S. 5-10 Year-Ahead Inflation Expectations (Dec)--
F: --
P: --
U.S. UMich Current Economic Conditions Index Prelim (Dec)--
F: --
P: --
U.S. UMich Consumer Sentiment Index Prelim (Dec)--
F: --
P: --
U.S. UMich 1-Year-Ahead Inflation Expectations Prelim (Dec)--
F: --
P: --
U.S. UMich Consumer Expectations Index Prelim (Dec)--
F: --
P: --


No matching data
Latest Views
Latest Views
Trending Topics
Top Columnists
Latest Update
White Label
Data API
Web Plug-ins
Affiliate Program
View All

No data
US stock markets suffered another brutal session overnight, with NASDAQ leading the decline, shedding nearly -2%. All three major indexes closed below their respective 55 W EMAs, reinforcing the bearish case that the markets are now in a medium-term correction phase.
US stock markets suffered another brutal session overnight, with NASDAQ leading the decline, shedding nearly -2%. All three major indexes closed below their respective 55 W EMAs, reinforcing the bearish case that the markets are now in a medium-term correction phase. This technical breakdown suggests that downside momentum is gaining traction, with investors recalibrating their expectations amid escalating economic uncertainty, particularly regarding the relentless stream of tariff threats.
A major driver of the selloff remains the intensifying trade war, which shows no signs of slowing down. Tariff threats are mounting almost daily, as analysts argue that markets have yet to fully price in the potential economic fallout. The momentum of these escalations is expected to persist well into the second quarter, particularly with reciprocal tariffs set to take effect in April.
The European Union has already signaled its intent to retaliate against US tariffs, and similar counter measures would be seen from other countries too. Beyond the EU response, additional tariffs are in the pipeline, targeting China with higher duties, and likely extending to non-border-related tariffs against Canada and Mexico. Japan could also find itself in Washington’s crosshairs, particularly over criticism about its weak currency. The sheer breadth of these tariff initiatives suggests that the market’s current adjustment may just be the beginning of a broader risk-off shift. Investors have just started offloading positions to hedge against further risks.
Meanwhile, despite the turbulence in equities, currency markets have remained relatively steady. So far this week, the Sterling is currently the strongest performer, followed by Euro and Dollar. On the weaker end of the spectrum, Swiss Franc is the worst performer, trailed by Loonie and Aussie. Kiwi and Yen are positioned in the middle. However, almost all major currency pairs and crosses are still trading within last week’s range, suggesting that the forex market is in a consolidation phase.
Looking ahead, today’s key data releases—UK GDP and the University of Michigan consumer sentiment and inflation expectations—will be closely watched. U.S. consumer sentiment has already plunged by -10 points over the past two months, reflecting the growing unease surrounding tariff policies. A further steep decline in sentiment could significantly heighten recession fears and deepen the market’s risk-off mood.
In Asia, at the time of writing, Nikkei is up 0.87%. Hong Kong HSI is up 2.33%. China Shanghai SSE is up 1.71%. Singapre Strait Times is down -0.21%. Japan 10-year JGB yield is down -0.018 at 1.528. Overnight, DOW fell -1.30%. S&P 500 fell -1.39%. NADSAQ fell -1.96%. 10-year yield fell -0.044 to 4.274.
NZ BNZ manufacturing hits 53.9 as recovery gains unexpected momentum
New Zealand’s BusinessNZ Performance of Manufacturing Index rose from 51.7 to 53.9 in February, marking its highest level since August 2022.
This solid improvement was driven by stronger production (52.4) and new orders (51.5), both also reaching their best levels since August 2022. Meanwhile, employment surged to 54.0, climbing 3.2 points from January and hitting its highest level since September 2021.
Despite the stronger data, business sentiment remains cautious. The proportion of negative comments from respondents rose to 59.5% in February, up from 57.7% in January. Many manufacturers cited weak orders and sluggish sales as ongoing challenges, signaling that while expansion has resumed.
BNZ’s Senior Economist Doug Steel welcomed the sustained improvement, noting that “pickup may be a bit faster than we are currently forecasting”.
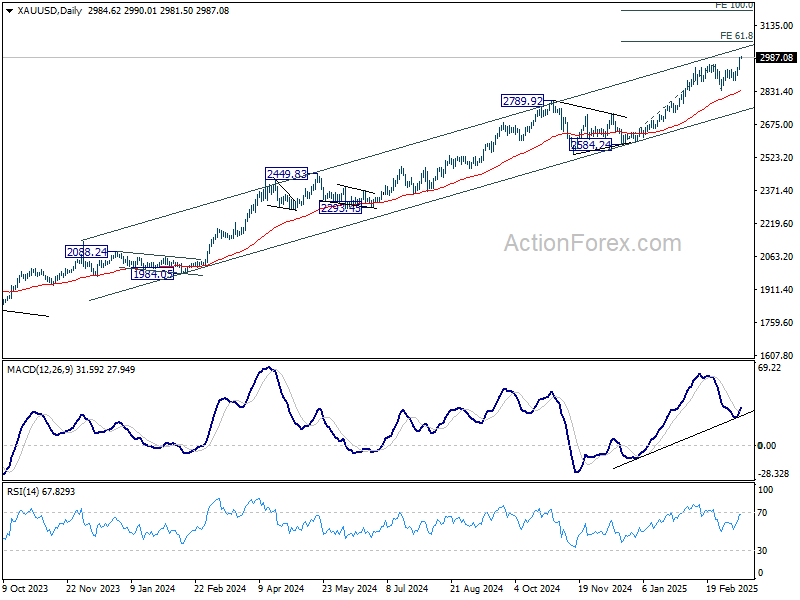
Gold hits record high, approaches 3000 amid ceasefire deadlock
Gold’s up trend resumed overnight and surged to new record highs as the precious metal remains well-supported by escalating global uncertainties. The psychological 3000 level is now in sight as investors flock to the safe-haven asset. The rally is being fueled by multiple factors, including intensifying trade tensions, stalemate in Ukraine-Russia ceasefire negotiations, and the extended broad selloff in US stock markets.
In particular, the latest developments surrounding the ceasefire talks between Russia and Ukraine have kept uncertainty high. Russian President Vladimir Putin stated that he agreed to the US-led ceasefire proposal in principle but stopped short of fully endorsing it.
Putin indicated that further discussions with US President Donald Trump would be necessary to ensure that the ceasefire results in a “long-term peace” and addresses the “root causes” of the conflict. He also expressed skepticism, questioning whether the proposed 30-day ceasefire would be used to “supply weapons” or “train newly mobilized units,” and raised concerns over how violations would be monitored.
Trump, in response, acknowledged that early reports from Russia were “going OK,” but added that “doesn’t mean anything until we hear what the final outcome is.”
With the ceasefire deal still hanging in the balance, geopolitical risks stays high.
Technically, the next near term target for Gold is 61.8% projection of 2584.24 to 2956.09 from 2832.41 at 3062.21.
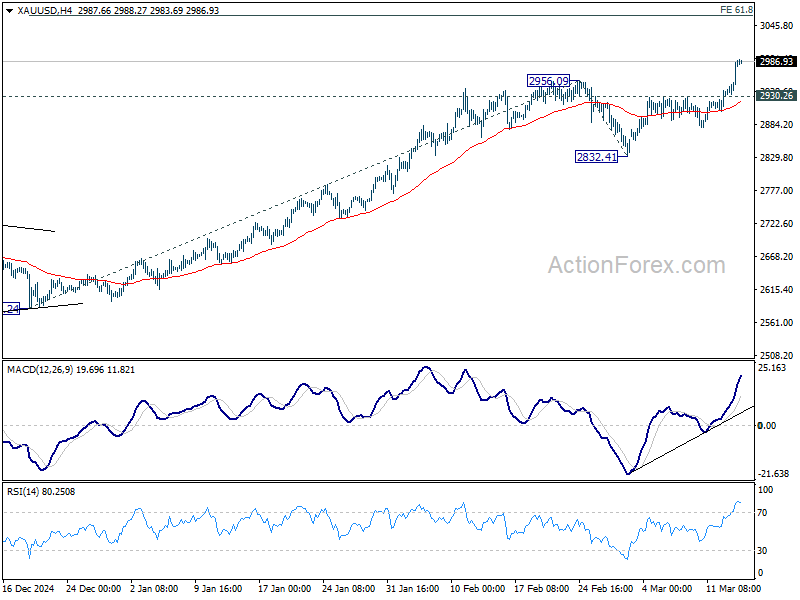
However, a key test lies ahead in the medium-term rising channel resistance, which has capped price advances since early 2024. Rejection at this level would still maintain gold’s bullish trend but keep its momentum in check.
On the other hand, decisive breakout above the channel resistance would signal acceleration in Gold’s uptrend. In such a scenario, gold could quickly reach 100% projection level at 3204.26.
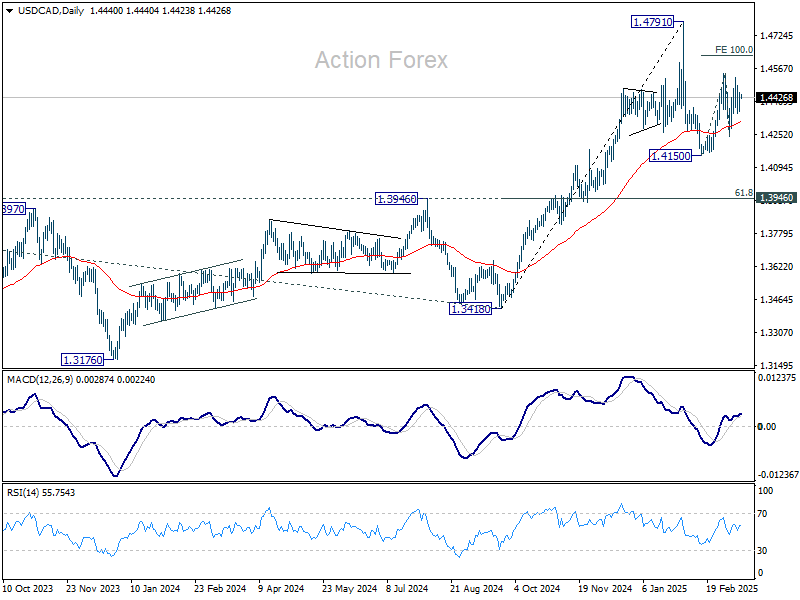
USD/CAD Daily Outlook
Daily Pivots: (S1) 1.4384; (P) 1.4418; (R1) 1.4477;
Intraday bias in USD/CAD stays neutral as sideway trading continues. Price actions from 1.4791 high are seen as a corrective pattern, with rebound from 1.4150 as the second leg. On the upside, break of 1.4541 will target 100% projection of 1.4150 to 1.4541 from 1.4238 at 1.4629 and above. But for now, strong resistance is expected from 1.4791 to limit upside to bring the third leg. On the downside, break of 1.4238 will confirm that the third leg has started through 1.4150 support.
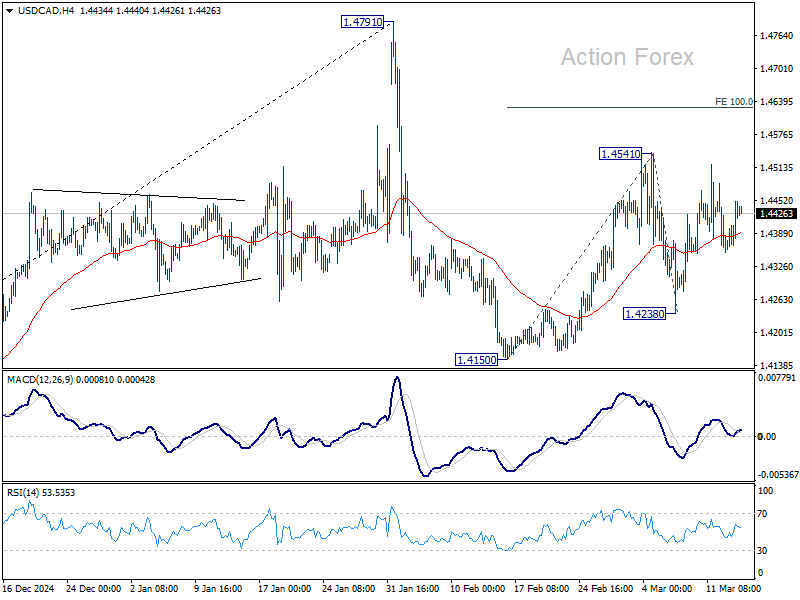
In the bigger picture, long term up trend is tentatively seen as resuming with prior breach of 1.4667/89 key resistance zone (2020/2015 highs). Next target is 100% projection of 1.2401 to 1.3976 from 1.3418 at 1.4993. This will remain the favored case as long as 1.3976 resistance turned support holds (2022 high), even in case of deep pullback.
Economic Indicators Update
| GMT | CCY | EVENTS | ACT | F/C | PP | REV |
|---|---|---|---|---|---|---|
| 21:30 | NZD | Business NZ PMI Feb | 53.9 | 51.4 | 51.7 | |
| 07:00 | EUR | Germany CPI M/M Feb F | 0.40% | 0.40% | ||
| 07:00 | EUR | Germany CPI Y/Y Feb F | 2.30% | 2.30% | ||
| 07:00 | GBP | GDP M/M Jan | 0.10% | 0.40% | ||
| 07:00 | GBP | Industrial Production M/M Jan | -0.10% | 0.50% | ||
| 07:00 | GBP | Industrial Production Y/Y Jan | -0.70% | -1.90% | ||
| 07:00 | GBP | Manufacturing Production M/M Jan | 0.00% | 0.70% | ||
| 07:00 | GBP | Manufacturing Production Y/Y Jan | -0.40% | -1.40% | ||
| 07:00 | GBP | Goods Trade Balance (GBP) Jan | -17.1B | -17.4B | ||
| 12:30 | CAD | Manufacturing Sales M/M Jan | 2.00% | 0.30% | ||
| 12:30 | CAD | Wholesale Sales M/M Jan | 1.80% | -0.20% | ||
| 14:00 | USD | UoM Consumer Sentiment Mar P | 63.8 | 64.7 | ||
| 14:00 | USD | UoM Inflation Expectations Mar P | 3.50% |
China's financial regulator urged institutions to boost support for consumption, promising in a statement on Friday to properly relax consumer credit quotas and loan terms as it offers long-term backing to make available large sums.
The National Financial Regulatory Administration (NFRA) added that it encouraged financial institutions to provide loan renewal support to eligible borrowers of personal consumption loans.
Financial institutions should "help boost consumption, better meet financial needs in the consumer sector" to implement the work requirments from the central leadership, it said.
Institutions should also increase credit supply to consumer service industries such as wholesale and retail, accommodation and catering, cultural and tourism, education, health and elderly care, the NFRA said.
Spurring reluctant Chinese consumers to spend has been elevated to the top of Beijing's to-do list for 2025, as lawmakers look to rectify imbalances in the world's second-largest economy.
Beijing last week promised greater efforts to boost consumption in the face of an escalating trade war with the US, but analysts expect deflationary pressures to drag on.
Financial institutions should also expand the types of products and services to help residents' increase goods and services consumption, it said.
As U.S. President Donald Trump's wide-ranging trade war rouses fears of recession, global investors have found an unlikely new sanctuary: Chinese equities.
Hong Kong's benchmark Hang Seng Index - where many major Chinese companies are listed - is up 17% since Trump entered the White House in January.
That compares to an about 9% drop in the S&P 500, which has also shed $4 trillion in market value from record highs last month.
Trump's erratic pronouncement on tariffs and moves to slash federal government spending have challenged assumptions about the appeal of U.S. stocks, which have vastly outperformed most of their global counterparts since 2021.
Investors have moved from believing in "TINA" - There is No Alternative to U.S. assets - to "TIARA" - There Is A Real Alternative - said Andy Wong, a senior Hong Kong-based executive at Pictet Asset Management.
Much of the Chinese rally has been led by technology shares that have risen 29% so far in 2025, hitting their highest level in more than three years last week. Like many of the new China equities bulls, Wong said he sees opportunities in tech, defense and consumer-facing plays.
U.S. Commerce Secretary Howard Lutnick says a recession would be "worth it" to get President Donald Trump's economic policies in place, while Treasury Secretary Scott Bessent has spoken of a coming period of "detox" and Trump himself says the economy is in "transition."
However it plays out, history shows recessions - should it come to that - are costly affairs: The pain is never spread equally, and the outcome - from the length and depth of the downturn to the speed and breadth of recovery - is unpredictable.
SHRINKING GDP
In general terms a recession is when the total output of an economy, called gross domestic product, declines in a meaningful way. One common rule of thumb is that when GDP contracts for two consecutive quarters, the country is in recession.
But that doesn't really capture it. The National Bureau of Economic Research's Business Cycle Dating Committee, which determines when recessions begin and end, looks beyond GDP at things like unemployment, personal income excluding government benefits, consumer spending and industrial production.
Those might deteriorate just a bit for a long time. Or they might crash so hard that it is obviously recessionary, such as during the COVID-19 pandemic when activity fell fast but rebounded quickly to yield only a two-month recession, the shortest on record in the U.S.
By contrast, a sluggish economy in 2016 never tilted into a declared recession.
NBER never declares recessions in real time. That's left for others to ponder by looking at things like changes in the unemployment rate, where rises of a half percentage point or more within a year have in the past meant recession is underway.
Nothing in hard data like unemployment, GDP or consumer spending currently suggests that is happening. The conversation is in the air because of recent surveys showing declining business and consumer sentiment, and because of memories of Trump's first term, when tariffs far smaller than those proposed now, and preceded by tax cuts, caused global economic growth to stall.
WHAT CAUSES RECESSIONS?
As of January, the risk of a U.S. recession was considered small. A low unemployment rate and rising wages meant consumers were continuing to spend, inflation was drifting down towards the Federal Reserve's 2% target, and the U.S. central bank had cut interest rates by a full percentage point since September. Fed officials considered it a stable foundation for continued growth, and many economists thought the central bank had nailed a "soft landing" from the high inflation of 2021 and 2022.
That's a rare feat: Sometimes it is central bank policy that triggers a downturn, most famously in the early 1980s when then-Fed chief Paul Volcker sent the economy into a painful recession with crushing interest rate hikes to tame high inflation.
This time, the volatility in sentiment, the declines in stock market wealth, and the worries of a coming drop in activity stemmed from Trump's move to rewire global trade with broad and steep tariffs on major U.S. trading partners.
Such shocks are the other sources of downturns. The pandemic was another one, as was the combined shock in the early 2000s from the crash in tech stocks and the September 11, 2001, attacks on the U.S.
WHO PAYS THE BILL?
Recessions come with costs. Business profits fall, as do stock prices, which can then amplify the impact as investors reduce their own consumption. Incomes fall and government deficits rise as more people qualify for benefits meant to offset economic weakness, known as automatic stabilizers.
One reason the pandemic shutdown gave way to a period of strong economic growth was the amount of government support under both the first Trump administration and former President Joe Biden. Both administrations left huge deficits in their wake, which some feel may limit the government's response this time if the economy does sink.
But typically the most notable recession feature is rising unemployment, a fact that puts the heaviest burden of any downturn on those thrown out of work.
Rising U.S. unemployment tends to fall disproportionately on Blacks and Hispanics, but each downturn is different.
The 2007-2009 recession, for example, was both deep and long, emanating from a financial crisis that is among the most difficult types of downturns to resolve. Some have called it the "man-cession" because of large job losses in construction, manufacturing and finance - industries dominated by men. The pandemic downturn, by contrast, initially fell hard on women and Hispanics, with massive layoffs in the services sector.
UPSIDE TO THE DOWNTURN
If there is a bright side, it's that recessions lower inflation.
There has been talk lately of stagflation, with growing concerns that economic growth will slow or even shrink while inflation rises on the back of the U.S. tariffs aimed at Canada, Mexico, China and other trading partners.
But if a downturn is steep enough, inflation eventually slows as demand weakens, and prices can even drop, something Trump pledged would happen on his watch. In fact, it is unusual outside of recession for overall price levels to decline.
The Fed also would likely cut rates to soften the blow of a recession, causing markets to adjust to new expectations about growth and demand.
Drops in borrowing costs can benefit prospective home buyers in particular, with cheaper mortgage rates - which the Trump administration might also welcome - boosting housing markets and helping with the eventual recovery.
Key Highlights
USD/JPY Technical Analysis
The US Dollar remained in a bearish zone below 148.80 against the Japanese Yen. USD/JPY extended losses below 147.50 before the bulls appeared.
Looking at the 4-hour chart, the pair tested the 146.60 zone and settled below the 100 simple moving average (red, 4-hour) and the 200 simple moving average (green, 4-hour). The pair started a minor recovery wave above the 147.50 level.
There was a spike above 148.50 but the bears were active near the 50% Fib retracement level of the downward move from the 151.30 swing high to the 146.63 low.
On the upside, the pair is facing resistance near the 148.80 level. There is also a major bearish trend line forming with resistance at 148.80 on the same chart. The next major resistance is near the 149.50 level and the 61.8% Fib retracement level of the downward move from the 151.30 swing high to the 146.63 low.
The main resistance is now forming near the 150.20 zone. A close above the 150.20 level could set the tone for another increase. In the stated case, the pair could even clear the 152.00 resistance.
On the downside, immediate support sits near the 147.50 level. The next key support sits near the 147.20 level. Any more losses could send the pair toward the 146.60 level. The main support could be 145.00.
Looking at EUR/USD, the pair remained stable and might soon now aim for a move toward the 1.1000 resistance.
Gold hit a record high on Friday, as uncertainty over US tariffs and fears of trade tensions propelled prices, along with increased expectations of monetary policy easing by the Federal Reserve.
Spot gold eased 0.1% to US$2,983.78 (RM13,265.14) an ounce as of 0132 GMT, after hitting a record high of US$2,990.09 earlier in the session, within touching distance of the key US$3,000 milestone.
Bullion is also poised to log a second straight weekly rise, with a 2.5% gain so far.
US gold futures rose 0.2% to US$2,996.70.
"The risk-off market stance reflects investors' expectations that trade tensions are likely to get worse before it cools, and are turning to safe-haven gold once again as a hedge against portfolio volatility," said IG market strategist Yeap Jun Rong.
Latest in US President Donald Trump's multi-front trade war, the European Union responded to blanket US tariffs on steel and aluminium by imposing a 50% tax on American whiskey exports, prompting the president to threaten on Truth Social to charge a 200% tariff on imports of European wines and spirits.
"The psychological US$3,000 level is now coming into view for gold prices, and as we approach the second quarter, where reciprocal tariffs could trigger another wave of market turbulence, gold remains a compelling safe-haven asset in an environment where alternatives are scarce," Rong added.
Trump's tariffs are widely expected to stoke inflation and economic uncertainty, and have prompted gold to reach multiple record highs in 2025.
Gold is seen as a hedge against political risks and inflation.
Markets now await the Fed's monetary policy meeting next Wednesday. The central bank is expected to keep its benchmark overnight interest rate in the 4.25%-4.50% range.
Non-yielding bullion thrives in a low interest rate environment.
Meanwhile, Russian President Vladimir Putin said on Thursday Russia supported a US proposal for a ceasefire in Ukraine in principle, but sought a number of clarifications and conditions that appeared to rule out a quick end to the fighting.
Spot silver eased 0.2% to US$33.72 an ounce, platinum firmed 0.1% to US$995.30, and palladium gained 0.7% to US$964.32.
White Label
Data API
Web Plug-ins
Poster Maker
Affiliate Program
The risk of loss in trading financial instruments such as stocks, FX, commodities, futures, bonds, ETFs and crypto can be substantial. You may sustain a total loss of the funds that you deposit with your broker. Therefore, you should carefully consider whether such trading is suitable for you in light of your circumstances and financial resources.
No decision to invest should be made without thoroughly conducting due diligence by yourself or consulting with your financial advisors. Our web content might not suit you since we don't know your financial conditions and investment needs. Our financial information might have latency or contain inaccuracy, so you should be fully responsible for any of your trading and investment decisions. The company will not be responsible for your capital loss.
Without getting permission from the website, you are not allowed to copy the website's graphics, texts, or trademarks. Intellectual property rights in the content or data incorporated into this website belong to its providers and exchange merchants.
Not Logged In
Log in to access more features

FastBull Membership
Not yet
Purchase
Log In
Sign Up