

Markets
News
Analysis
User
24/7
Economic Calendar
Education
Data
- Names
- Latest
- Prev


Signal Accounts for Members
All Signal Accounts
All Contests
 Turkey Trade Balance
A:--
F: --
P: --
 Germany Construction PMI (SA) (Nov)
A:--
F: --
P: --
 Euro Zone IHS Markit Construction PMI (Nov)
A:--
F: --
P: --
 Italy IHS Markit Construction PMI (Nov)
A:--
F: --
P: --
 U.K. Markit/CIPS Construction PMI (Nov)
A:--
F: --
P: --
 France 10-Year OAT Auction Avg. Yield
A:--
F: --
P: --
Euro Zone Retail Sales MoM (Oct)A:--
F: --
P: --
Euro Zone Retail Sales YoY (Oct)A:--
F: --
P: --
 Brazil GDP YoY (Q3)
A:--
F: --
P: --
 U.S. Challenger Job Cuts (Nov)
A:--
F: --
P: --
U.S. Challenger Job Cuts MoM (Nov)A:--
F: --
P: --
U.S. Challenger Job Cuts YoY (Nov)A:--
F: --
P: --
U.S. Initial Jobless Claims 4-Week Avg. (SA)A:--
F: --
P: --
U.S. Weekly Initial Jobless Claims (SA)A:--
F: --
P: --
U.S. Weekly Continued Jobless Claims (SA)A:--
F: --
P: --
 Canada Ivey PMI (SA) (Nov)
A:--
F: --
P: --
Canada Ivey PMI (Not SA) (Nov)A:--
F: --
P: --
U.S. Non-Defense Capital Durable Goods Orders Revised MoM (Excl. Aircraft) (SA) (Sept)A:--
F: --
U.S. Factory Orders MoM (Excl. Transport) (Sept)A:--
F: --
P: --
U.S. Factory Orders MoM (Sept)A:--
F: --
P: --
U.S. Factory Orders MoM (Excl. Defense) (Sept)A:--
F: --
P: --
U.S. EIA Weekly Natural Gas Stocks ChangeA:--
F: --
P: --
Saudi Arabia Crude Oil ProductionA:--
F: --
P: --
U.S. Weekly Treasuries Held by Foreign Central BanksA:--
F: --
P: --
 Japan Foreign Exchange Reserves (Nov)
A:--
F: --
P: --
 India Repo Rate
A:--
F: --
P: --
India Benchmark Interest RateA:--
F: --
P: --
India Reverse Repo RateA:--
F: --
P: --
India Cash Reserve RatioA:--
F: --
P: --
Japan Leading Indicators Prelim (Oct)A:--
F: --
P: --
U.K. Halifax House Price Index YoY (SA) (Nov)--
F: --
P: --
U.K. Halifax House Price Index MoM (SA) (Nov)--
F: --
P: --
France Current Account (Not SA) (Oct)--
F: --
P: --
France Trade Balance (SA) (Oct)--
F: --
P: --
France Industrial Output MoM (SA) (Oct)--
F: --
P: --
Italy Retail Sales MoM (SA) (Oct)--
F: --
P: --
Euro Zone Employment YoY (SA) (Q3)--
F: --
P: --
Euro Zone GDP Final YoY (Q3)--
F: --
P: --
Euro Zone GDP Final QoQ (Q3)--
F: --
P: --
Euro Zone Employment Final QoQ (SA) (Q3)--
F: --
P: --
Euro Zone Employment Final (SA) (Q3)--
F: --
Brazil PPI MoM (Oct)--
F: --
P: --
 Mexico Consumer Confidence Index (Nov)
--
F: --
P: --
Canada Unemployment Rate (SA) (Nov)--
F: --
P: --
Canada Labor Force Participation Rate (SA) (Nov)--
F: --
P: --
Canada Employment (SA) (Nov)--
F: --
P: --
Canada Part-Time Employment (SA) (Nov)--
F: --
P: --
Canada Full-time Employment (SA) (Nov)--
F: --
P: --
U.S. Dallas Fed PCE Price Index YoY (Sept)--
F: --
P: --
U.S. PCE Price Index YoY (SA) (Sept)--
F: --
P: --
U.S. PCE Price Index MoM (Sept)--
F: --
P: --
U.S. Personal Outlays MoM (SA) (Sept)--
F: --
P: --
U.S. Core PCE Price Index MoM (Sept)--
F: --
P: --
U.S. UMich 5-Year-Ahead Inflation Expectations Prelim YoY (Dec)--
F: --
P: --
U.S. Core PCE Price Index YoY (Sept)--
F: --
P: --
U.S. 5-10 Year-Ahead Inflation Expectations (Dec)--
F: --
P: --
U.S. UMich Current Economic Conditions Index Prelim (Dec)--
F: --
P: --
U.S. UMich Consumer Sentiment Index Prelim (Dec)--
F: --
P: --
U.S. UMich 1-Year-Ahead Inflation Expectations Prelim (Dec)--
F: --
P: --
U.S. UMich Consumer Expectations Index Prelim (Dec)--
F: --
P: --

No matching data
Latest Views
Latest Views
Trending Topics
Top Columnists
Latest Update
White Label
Data API
Web Plug-ins
Affiliate Program
View All
No data
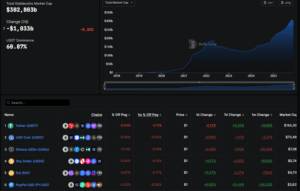
Their market value has climbed to new record highs, crossing 300 billion dollars and capturing around 8% of the entire crypto market. This rapid rise has brought excitement as well as concern.
Their market value has climbed to new record highs, crossing 300 billion dollars and capturing around 8% of the entire crypto market. This rapid rise has brought excitement as well as concern.
Investors see stablecoins as useful tools for trading, payments and moving money quickly, but regulators worry that their fast growth and growing links to traditional finance could increase financial risks. As the market expands, the question becomes whether stablecoins can scale safely or whether their own weak spots could lead to trouble.
Stablecoins are tokens designed to keep a steady price, usually tied to a major currency like the US dollar. This simple idea has made them essential to the crypto world. Today, about 80% of trading on major crypto platforms involves stablecoins because traders use them to move in and out of positions without returning to a bank for money every time. Two names dominate this space.
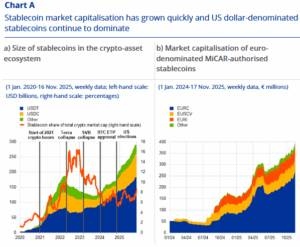
Tether holds 184 billion dollars in value, and USD Coin holds 75 billion dollars. Together, they represent almost all stablecoin supply. A big trend pushing growth is new regulatory clarity. The European Union launched its MiCAR rulebook last year, giving issuers clear obligations, while the United States recently passed the GENIUS Act. Hong Kong has put rules in place as well. This wave of regulation has helped investors feel more comfortable, lifting demand around the world.
While people often mention cross-border payments and inflation protection as stablecoin use cases, real data tells a different story. Only a small share of activity comes from everyday users. One study shows that less than 1% of stablecoin volume comes from retail-sized transfers. For now, stablecoins remain tools built mainly for traders rather than the general public.
Rapid growth comes with challenges. A stablecoin must always be redeemable at the price it promises. If users lose trust, they may all rush to withdraw at once, leading to a run and breaking the coin's price. This has happened before in crypto and can shake markets quickly. The biggest risk comes from the fact that leading stablecoins hold huge piles of assets in traditional financial markets.
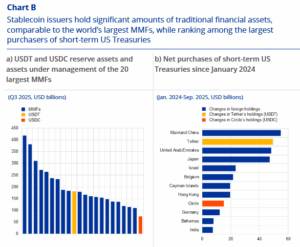
Tether and USDC together rank among the largest buyers of US Treasury bills. If either one faced a run, they might need to sell these assets quickly, which could hurt wider markets. Some analysts even project that stablecoins could reach two trillion dollars in size by 2028, which would increase the stakes.
 as of 22 Nov 2025. Past performance is not a reliable indicator of future performance.
 as of 22 Nov 2025. Past performance is not a reliable indicator of future performance.
 as of 22 November 2025. Past performance is not a reliable indicator of future performance.
It should be another busy, holiday-shortened, week after a volatile one last week as markets whipsawed around big moves in Fed pricing and AI bubble risk fears. Before we get to Thanksgiving, DB's Jim Reid writes that in the US, delayed post-shutdown data will be compressed into the first three days because of the holiday. Tomorrow brings September's retail sales and PPI, followed on Wednesday by jobless claims and durable goods orders. The claims data will be particularly important as they cover the November survey week, and the Federal Reserve is expected to lean heavily on these figures and other alternative indicators ahead of its December meeting, given there'll be no more payroll data prior to the FOMC.
Globally, attention will turn to inflation reports from Europe and Japan, as well as the long-awaited UK Budget, which could prove pivotal for the country's fragile fiscal outlook. Perhaps the most significant geopolitical development will be Ukraine's response to the US ultimatum to accept the 28-point peace plan agreed with Russia, with an ultimatum set for before Thanksgiving on Thursday, although the US seem to have indicated over the weekend that there is some room for negotiation.
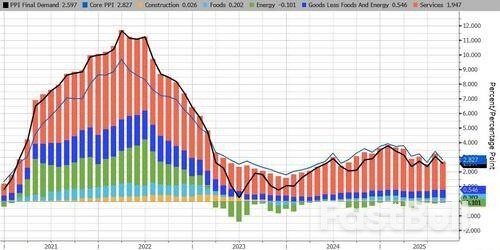
Let's start with the US, and for tomorrow's September PPI data, benign prints are expected by DB economists for headline (+0.2% vs -0.1% last) and core (+0.2% vs -0.1%), echoing recent CPI trends. Categories feeding into core PCE will be in focus, with forecasts pointing to a 0.26% monthly gain, keeping the annual rate near 2.9%. This will be the last inflation update before the Fed's December decision, as October CPI and November CPI have been pushed back to mid-December.
Retail sales are forecast by DB economists to show modest gains after strong summer spending: headline +0.1% (vs +0.6% last), ex-auto +0.2% (vs +0.7%), while retail control may dip slightly (-0.1% vs +0.7%). Even so, Q3 retail control growth is tracking at 6.8% annualized —the strongest since early 2023—supporting expectations for robust goods spending once GDP data is published. Factory sector updates arrive Wednesday with durable goods orders for September and the Chicago PMI for November (45.0 vs 43.8). Headline orders are expected to fall (-2.4% vs +2.9%), but ex-transportation (+0.2% vs +0.4%) and core orders (+0.2% vs +0.6%) should post moderate gains, implying a solid 5.3% annualised increase for Q3. Don't forget Black Friday where we will start to see early evidence of how strong consumer spending is into the important Christmas period.
No Fed speakers are scheduled at this stage. The blackout period begins on Saturday ahead of the December meeting but with Thanksgiving on Thursday, it will start a lot earlier than it normally would.
European data highlights include preliminary November CPI prints for Germany (2.6% YoY expected), France (0.92%) and Italy (1.23%) on Friday, alongside Q3 GDP releases for Norway, Sweden and Switzerland. Germany's Ifo survey kicks off the week today, followed by consumer confidence on Thursday and retail sales Friday. France will also report confidence and spending data that day. In the UK, the Autumn Budget on Wednesday will be the main event. Expectations point to roughly £35bn in fiscal consolidation, marking a second historic tax-raising budget under Chancellor Reeves. See our economist Sanjay Raja's preview here in what is one of the most hotly anticipated UK budgets in recent memory. Sanjay may need a lie down in a dark room after Wednesday as it's fair to say he's been in high demand of late.
From central banks, the ECB will publish its October meeting account on Thursday and its consumer expectations survey Friday. In New Zealand, the RBNZ meets Wednesday, with a 25bps rate cut anticipated. Elsewhere, Australia reports October CPI (Wednesday), Canada releases Q3 GDP, and China publishes October industrial profits. Japan's focus will be on November Tokyo CPI and October activity data (Friday).
Key points:
Australia is home for YouTube star Jordan Barclay, the place where he was born, went to school and built a company worth $50 million by age 23 that produces gaming content for 23 million subscribers.
Now, with a world-first social media ban on Australian children younger than 16 set to take effect on December 10, he is thinking of leaving his Melbourne studio and moving abroad.
"We're going to move overseas because that's where the money is going to be," said Barclay, whose seven YouTube channels include EYstreem, Chip and Milo, and Firelight.
"We can't afford to keep doing business if advertisers leave Australia."
Nine participants interviewed by Reuters in Australia's social media industry, estimated to generate annual revenue of A$9 billion ($5.82 billion), did not put a dollar figure on the ban's impact but agreed it could lead to a drop in advertisers and views.
YouTubers, who get paid 55% of ad revenue and up to 18 Australian cents per 1,000 views, could be hit hardest, said social media researcher Susan Grantham at Griffith University.
"If it is one clean sweep and all these accounts disappear, then instantaneously, it's going to be detrimental to the influencer economy."
The law requires companies to block the accounts of more than a million people under the cut-off age, punishing "systemic breaches" with penalties of up to A$49.5 million.
While teenagers can still watch YouTube without an account, the site's algorithm will fail to drive traffic to popular posts, reducing views.
Equally, creators on YouTube, TikTok and Meta'sInstagram stand to lose earnings through promotions if the number of their followers fall, Grantham said.
Advertisers are also on edge about campaigns targeting younger audiences, said Stephanie Scicchitano, general manager at Sydney-based talent agency Born Bred Talent.
Barclay's company Spawnpoint Media sells advertising to companies such as Lego and Microsoft, but clients' interest in sponsorship deals has declined as the ban approaches, he said.
"They're worried about what the ban could mean later," he said. "If it expands, if it grows ... it makes sense for us to invest overseas and not here."
The United States could be among his options, he said, pointing to more favourable laws and government support in such markets.
Some creators are already leaving to avoid the curbs, such as influencers the Empire Family, who told followers in October they were relocating to Britain.
The careers of those creating content featuring children younger than 16, such as family vloggers and child influencers, were particularly at risk, said Crystal Abidin, the director of the Influencer Ethnography Research Lab.
"They agree that in order to continue, it's an easy decision to immigrate," she said.
Children's musicians Tina and Mark Harris, whose Lah-Lah YouTube channel has 1.4 million subscribers, said, "Any negative impact on income is going to hurt."
But their main concern was lasting reputational damage from the government's description of YouTube's harm to children.
"Parents will get the jitters and stay away from YouTube in droves," Mark Harris said.
"Maybe that's hyperbole, we just don't know."
Initially exempted from the ban, Alphabet-ownedYouTube was added later at the urging of Australia's internet regulator, which said 37% of minors reported seeing harmful content on YouTube, the worst showing for a platform.
The ban "does a disservice" to creators of high-quality content for children, said Shannon Jones, who runs Australia's largest YouTube channel, Bounce Patrol, with more than 33 million subscribers.
Byron Bay creator Junpei Zaki, 28, whose output is mostly drawn from interactions with 22 million followers across TikTok and YouTube, expects the ban to cause a "guaranteed drop" in likes and comments from Australia.
"It ... does feel like I'm ignoring my Australian audience that helped get me here, because they can't interact."
Zaki estimates he will lose 100,000 followers to the ban, a blip in his global reach, but warned that smaller creators with domestic audiences would be hit harder.
At the House of Lim food stall in Sydney's west, 15-year-old owner Dimi Heryxlim has built a following by posting vlogs of his routine running the kitchen after school.
Losing access to his TikTok and Instagram accounts "will be a bad thing", he said, as some customers recognise him from his videos, but he plans to return as soon as he turns 16.
"If I can't get my account back, I'll just get a new account and start everything from scratch," said Heryxlim.
728 RM B 7/F GEE LOK IND BLDG NO 34 HUNG TO RD KWUN TONG KLN HONG KONG


White Label
Data API
Web Plug-ins
Poster Maker
Affiliate Program
The risk of loss in trading financial instruments such as stocks, FX, commodities, futures, bonds, ETFs and crypto can be substantial. You may sustain a total loss of the funds that you deposit with your broker. Therefore, you should carefully consider whether such trading is suitable for you in light of your circumstances and financial resources.
No decision to invest should be made without thoroughly conducting due diligence by yourself or consulting with your financial advisors. Our web content might not suit you since we don't know your financial conditions and investment needs. Our financial information might have latency or contain inaccuracy, so you should be fully responsible for any of your trading and investment decisions. The company will not be responsible for your capital loss.
Without getting permission from the website, you are not allowed to copy the website's graphics, texts, or trademarks. Intellectual property rights in the content or data incorporated into this website belong to its providers and exchange merchants.
Not Logged In
Log in to access more features

FastBull Membership
Not yet
Purchase


Log In
Sign Up


