Markets
News
Analysis
User
24/7
Economic Calendar
Education
Data
- Names
- Latest
- Prev


Signal Accounts for Members
All Signal Accounts
All Contests


Canada Labor Force Participation Rate (SA) (Nov)A:--
F: --
P: --
U.S. Personal Income MoM (Sept)A:--
F: --
P: --
U.S. PCE Price Index YoY (SA) (Sept)A:--
F: --
P: --
U.S. PCE Price Index MoM (Sept)A:--
F: --
P: --
U.S. Personal Outlays MoM (SA) (Sept)A:--
F: --
P: --
U.S. Core PCE Price Index MoM (Sept)A:--
F: --
P: --
U.S. Core PCE Price Index YoY (Sept)A:--
F: --
P: --
U.S. UMich 5-Year-Ahead Inflation Expectations Prelim YoY (Dec)A:--
F: --
P: --
U.S. Real Personal Consumption Expenditures MoM (Sept)A:--
F: --
P: --
U.S. 5-10 Year-Ahead Inflation Expectations (Dec)A:--
F: --
P: --
U.S. UMich Current Economic Conditions Index Prelim (Dec)A:--
F: --
P: --
U.S. UMich Consumer Sentiment Index Prelim (Dec)A:--
F: --
P: --
U.S. UMich 1-Year-Ahead Inflation Expectations Prelim (Dec)A:--
F: --
P: --
U.S. UMich Consumer Expectations Index Prelim (Dec)A:--
F: --
P: --
U.S. Weekly Total Rig CountA:--
F: --
P: --
U.S. Weekly Total Oil Rig CountA:--
F: --
P: --
U.S. Unit Labor Cost Prelim (SA) (Q3)--
F: --
P: --
U.S. Consumer Credit (SA) (Oct)A:--
F: --
P: --
China, Mainland Foreign Exchange Reserves (Nov)A:--
F: --
P: --
China, Mainland Exports YoY (USD) (Nov)--
F: --
P: --
China, Mainland Imports YoY (CNH) (Nov)--
F: --
P: --
China, Mainland Imports YoY (USD) (Nov)--
F: --
P: --
China, Mainland Imports (CNH) (Nov)--
F: --
P: --
China, Mainland Trade Balance (CNH) (Nov)--
F: --
P: --
China, Mainland Exports (Nov)--
F: --
P: --
Japan Wages MoM (Oct)A:--
F: --
P: --
Japan Trade Balance (Oct)A:--
F: --
P: --
Japan Nominal GDP Revised QoQ (Q3)A:--
F: --
P: --
Japan Trade Balance (Customs Data) (SA) (Oct)A:--
F: --
P: --
Japan GDP Annualized QoQ Revised (Q3)A:--
F: --
China, Mainland Exports YoY (CNH) (Nov)--
F: --
P: --
China, Mainland Trade Balance (USD) (Nov)--
F: --
P: --
Germany Industrial Output MoM (SA) (Oct)--
F: --
P: --
Euro Zone Sentix Investor Confidence Index (Dec)--
F: --
P: --
Canada Leading Index MoM (Nov)--
F: --
P: --
Canada National Economic Confidence Index--
F: --
P: --
U.S. Dallas Fed PCE Price Index YoY (Sept)--
F: --
P: --
China, Mainland Trade Balance (USD) (Nov)--
F: --
P: --
U.S. 3-Year Note Auction Yield--
F: --
P: --
U.K. BRC Overall Retail Sales YoY (Nov)--
F: --
P: --
U.K. BRC Like-For-Like Retail Sales YoY (Nov)--
F: --
P: --
Australia Overnight (Borrowing) Key Rate--
F: --
P: --
RBA Rate Statement
RBA Press Conference
Germany Exports MoM (SA) (Oct)--
F: --
P: --
U.S. NFIB Small Business Optimism Index (SA) (Nov)--
F: --
P: --
Mexico Core CPI YoY (Nov)--
F: --
P: --
Mexico 12-Month Inflation (CPI) (Nov)--
F: --
P: --
Mexico PPI YoY (Nov)--
F: --
P: --
Mexico CPI YoY (Nov)--
F: --
P: --
U.S. Weekly Redbook Index YoY--
F: --
P: --
U.S. JOLTS Job Openings (SA) (Oct)--
F: --
P: --
China, Mainland M2 Money Supply YoY (Nov)--
F: --
P: --
China, Mainland M0 Money Supply YoY (Nov)--
F: --
P: --
China, Mainland M1 Money Supply YoY (Nov)--
F: --
P: --
U.S. EIA Short-Term Crude Production Forecast For The Next Year (Dec)--
F: --
P: --
U.S. EIA Short-Term Crude Production Forecast For The Year (Dec)--
F: --
P: --
U.S. EIA Natural Gas Production Forecast For The Next Year (Dec)--
F: --
P: --
EIA Monthly Short-Term Energy Outlook
U.S. 10-Year Note Auction Avg. Yield--
F: --
P: --
U.S. API Weekly Cushing Crude Oil Stocks--
F: --
P: --


No matching data
Latest Views
Latest Views
Trending Topics
Top Columnists
Latest Update
White Label
Data API
Web Plug-ins
Affiliate Program
View All

No data
Grid trading stands as a distinctive strategy within the trading realm, offering a structured approach to navigating market volatility. By strategically placing buy and sell orders at predefined inter
Grid trading stands as a distinctive strategy within the trading realm, offering a structured approach to navigating market volatility. By strategically placing buy and sell orders at predefined intervals, this method eschews the need to determine the market direction, instead harnessing the inherent fluctuations of the market.
Grid trading is a strategic approach to forex and other financial markets, where traders place buy and sell orders at predetermined intervals above and below a base price, creating a grid of orders. This method does not require traders to determine market directions but instead relies on market volatility to generate returns. The essence of grid trading lies in its relative simplicity and in leveraging the natural ebb and flow of price movements.
At its core, grid trading involves setting up a sequence of orders that are triggered when prices hit certain levels. The strategy is designed to take advantage of normal price volatility within a specific range or trend by entering and exiting trades at predetermined levels. For instance, a trader sets up a trend-following grid on EUR/USD, placing buy orders above the current price at regular intervals and sell orders below. As the trend progresses, orders are activated, and the trader aims to capture returns from these movements.
A critical advantage of grid trading is its flexibility. It can be adapted to suit various market conditions, whether the market is trending or moving sideways. In trending markets, the grid can be adjusted to follow the trend, potentially increasing returns as the price moves in a specific direction. In range-bound markets, the grid capitalises on price reversals at each level.
However, grid trading also requires careful risk management. The nature of the strategy means that without proper oversight, adverse market movements can lead to significant losses. Setting stop-loss orders for individual trades and monitoring overall exposure are essential practices to mitigate these risks.
Consider a trader who decides to employ a grid trading strategy on the EUR/USD pair, observing that it has been fluctuating within a tight range of 1.1000 to 1.1100. The trader selects 1.1050 as the base price, identifying it as the midpoint of the current trading range.To set up the grid, the trader places buy orders at intervals below the base price, for example, at 1.1040, 1.1030, and 1.1020. Simultaneously, sell orders are placed at intervals above the base price, at 1.1060, 1.1070, and 1.1080. The strategy here is to capitalise on the currency pair's natural price movements within this established range.
As the price fluctuates, hitting each buy order triggers a purchase at a lower price, aiming to sell as the price rebounds. Conversely, each sell order executes a sale at a higher price, buying back the short position as the price drops again.A stop loss is typically set beyond the range’s upper and lower bound, while profits may be taken incrementally as the price fluctuates around the midpoint. Properly managed, this approach allows the trader to systematically generate returns in a range-bound market without needing to determine the direction of the next price movement.
Broadly speaking, grid trading strategies come in two flavours: range-based and trend-following. Below, we explore both.

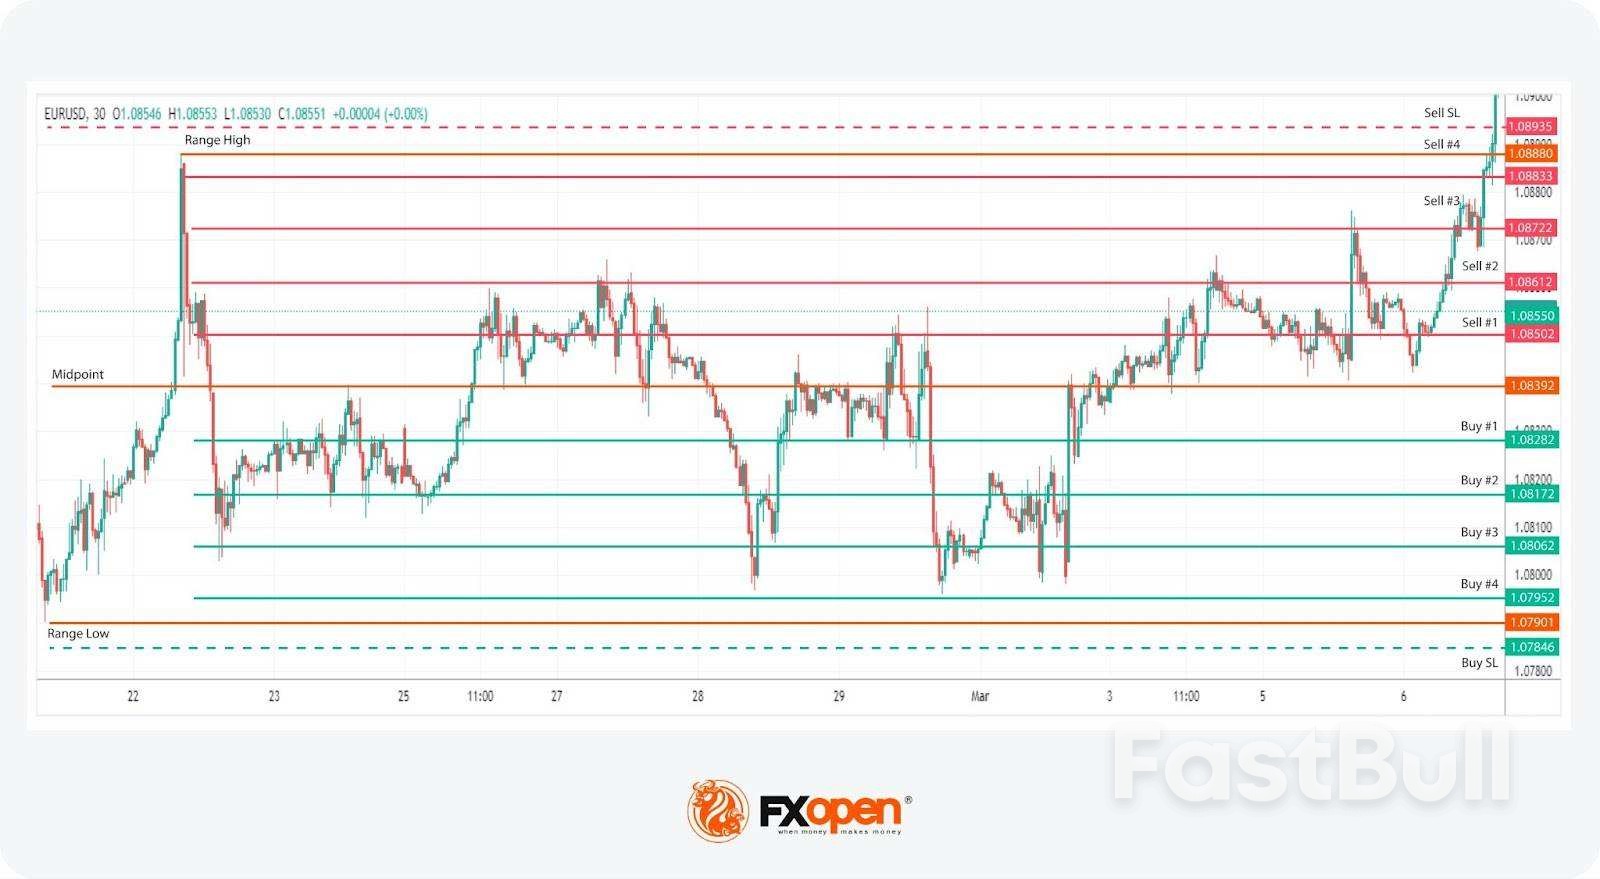
In a range-bound forex or cryptocurrency* market, where prices oscillate between a defined high and low, a basic range-based grid strategy might be quite effective. This approach leverages the market's natural tendency to fluctuate within bounds, allowing traders to capitalise on small, consistent movements rather than large trends.
Identifying a trading range is the first step, where the trader marks the highest and lowest prices over a certain period. From this range, the midpoint is determined, serving as a reference for setting up buy and sell limit orders.Typically, traders might choose to place four or five orders on either side of the midpoint, though some may select more. The spacing between orders is calculated by dividing the distance from the midpoint to the range's high or low by the number of orders, adjusting the spacing slightly.
Entry
Stop Loss
Take Profit

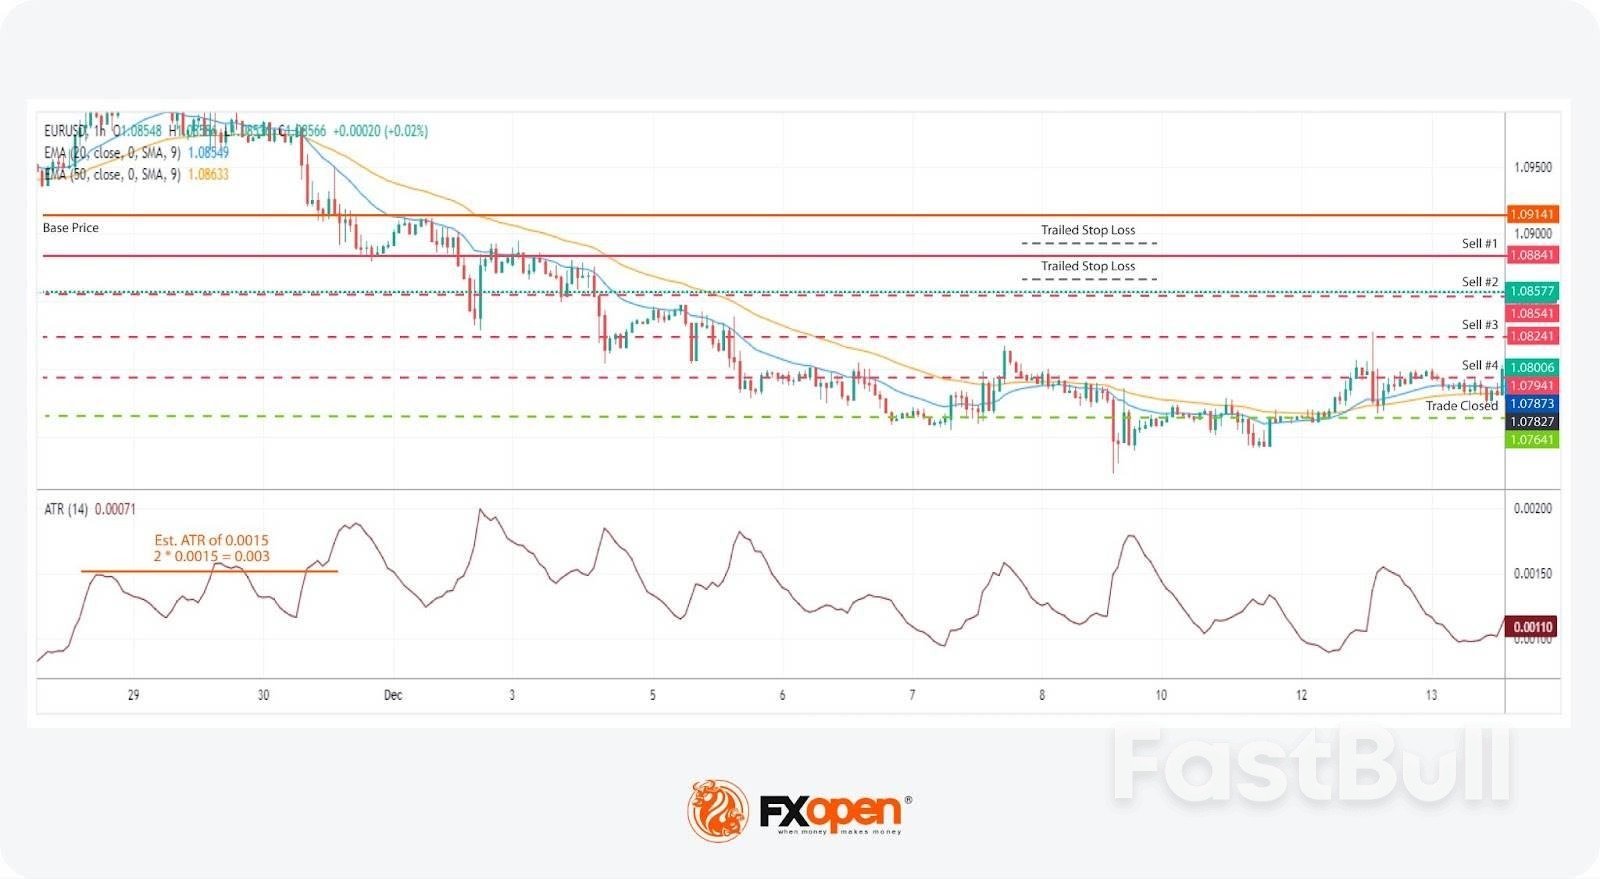
In a trend-following grid strategy, the primary goal is to align with the market's direction, leveraging sustained movements to accumulate a position that grows as the trend progresses. This approach requires the trader to first identify the prevailing trend, which can be achieved through market structure analysis or the use of indicators such as moving averages, momentum indicators, or the Average Directional Index (ADX).
Upon determining the trend, the current price acts as a base from which buy stop (in an uptrend) or sell stop (in a downtrend) orders are placed at fixed intervals. The intervals may vary depending on the trader’s preference; a popular method involves using the Average True Range (ATR) to set these distances.For example, if using the ATR, a trader might place orders at intervals of 2x the ATR value from the base price, utilising the ATR’s reflection of market volatility to gauge appropriate spacing between orders.
Entry
Stop Loss
Take Profit
Risk management is a critical aspect of grid trading, where the systematic approach to placing multiple orders can potentially amplify both returns and losses. Given that grid systems compound entries, the disciplined use of stop losses becomes essential to cap potential losses. This is particularly true in volatile markets. When grid trading in cryptocurrencies*, for example, rapid price movements can quickly leave a trader overexposed without careful risk management.
Another crucial consideration is the spacing between orders. Properly calibrated spacing can help manage exposure by preventing the accumulation of too many positions too quickly in a market that is moving against the trader's assumptions. Similarly, the sizing of each trade must be carefully considered to not only manage exposure but also ensure that margin requirements are met without overleveraging the account.Diversification across different instruments or markets is also an important part of a grid strategy. By not putting all eggs in one basket, traders can potentially reduce the impact of a significant move in any single market.
Many grid trading strategies are automated, allowing for the execution of this strategy at a scale and speed that would be challenging manually. However, using grid trading bots introduces its own complexities, including the need for constant monitoring to ensure that the algorithm behaves as expected in changing market conditions. It also requires a robust understanding of the automated system's parameters to avoid unintended exposure.
FAQs
What Is Grid Trading in Forex?
Grid trading in forex is a strategy where a trader places buy and sell orders at predetermined intervals around a base price. It capitalises on the natural market volatility by automatically executing trades without the need to analyse market directions. This approach is designed to generate returns from the fluctuations of financial assets.
How Does Grid Trading Work?
Grid trading works by setting up a network of buy and sell orders spaced at regular intervals above and below a starting price point. As prices fluctuate, these orders are triggered, potentially allowing traders to take advantage of small price movements. The strategy can be adjusted for different market conditions, aiming to continuously enter and exit trades based on the established grid pattern.
What Is Spot Grid Trading?
Spot grid trading is a specific application of grid trading strategies in the spot market, where financial instruments are bought and sold for immediate delivery. In forex, it refers to buying and selling currency pairs at their current market price, using a grid strategy to take advantage of spot market volatility.
What Is a Grid Trading Strategy?
A grid trading strategy is a systematic method of placing a series of orders at incrementally increasing and decreasing prices. This strategy is designed to execute trades automatically as the market moves, aiming to secure returns from these movements without needing to determine the market's direction.
How Risky Is Grid Trading?
Grid trading can be risky due to its potential to compound losses, especially in highly volatile markets. The strategy requires careful management of stop losses, order spacing, and trade sizing to mitigate exposure. While automation of grid trading can help manage these risks, it also introduces the need for constant monitoring and understanding of the system to prevent significant losses.
Piper Sandler warned in a note Monday that a potential U.S. government shutdown could delay key economic releases, but stressed there are “plenty of other data to gauge labor, inflation, etc.”
In its weekly research note, the firm said “there’s concern that if there’s a government shutdown, important economic data will be delayed, e.g., payrolls (scheduled to be released Oct 3rd), and the CPI (Oct 15th). Well, they will eventually be reported … but with a lag of perhaps 10 days after the reopening.”
In the meantime, Piper Sandler pointed investors to a wide range of private and alternative data.
“Sep 30: Conference Board’s jobs hard-jobs easy, which correlates very well with the unemployment rate,” the analysts wrote.
They added that the Oct. 1 ISM and S&P Global PMIs would provide critical labour and inflation signals, noting their price components have been “consistent with inflation cooling a bit.”
The firm highlighted other key indicators: mortgage applications on Oct. 1, ADP employment data, weekly jobless claims on Oct. 2 and Oct. 9, and industrial production on Oct. 10.
Piper Sandler emphasised that “unemployment claims WILL be reported, as they were during the 2013 shutdown,” and warned they would likely rise if federal workers are furloughed.
Later in October, the NFIB small business report (Oct. 14), Empire State and Philadelphia Fed surveys (Oct. 15–16), and NAHB housing index (Oct. 16) will offer further insights.
Piper Sandler also said it would “watch our Daily consumer confidence survey to gauge how consumers see any shutdown.”
as of 29 September 2025. Past performance is not a reliable indicator of future performance.
as of 28 September 2025. Past performance is not a reliable indicator of future performance.
Pending sales of US existing homes rose in August to the highest level in five months, as falling mortgage rates gave a much-needed lift to the sluggish housing market.
An index of contract signings increased 4% last month to 74.7, according to National Association of Realtors data out Monday. The gain exceeded all estimates of economists surveyed by Bloomberg. During the hot housing market of the pandemic era, the index was well above 100.
The bigger-than-expected advance follows a similar surprise in purchases of new homes last month, suggesting the housing market may be in the early stages of breaking free of a years-long slumber. Mortgage rates have fallen to the lowest in a year at 6.34%, encouraging many Americans to get off the sidelines and others to finally list their homes for sale.
“Lower mortgage rates are enabling more homebuyers to go under contract,” NAR Chief Economist Lawrence Yun said in a statement.
That was especially true in the Midwest, where sales jumped nearly 9% in August, Yun said, which was the most since early 2023. Contract signings also rose in the South and West.
While the drop in mortgage rates is welcome, millions of Americans still have rates well below current levels and aren’t inclined to move, which has suppressed inventory and kept prices elevated.
Meantime, one of the lowest rates of hiring since the early 2010s is keeping a lid on job relocations and housing activity, according to a recent blog post by Odeta Kushi, an economist at title insurance giant First American Financial Corp.
Pending-homes sales tend to be a leading indicator for previously owned homes, as houses typically go under contract a month or two before they’re sold.
Contract closings on existing homes fell slightly in August, and they’ve remained frozen in a lackluster range for the better part of the last two-and-a-half years, NAR data show.
For traders, keeping a trading journal is an important activity that helps them improve their trading skills. A trading journal is a systematic record-keeping tool that is used to document trades, strategies, and outcomes. It is a way to track performance by recording the entry and exit points, the reasons for entering the trade, and the results.
Here are three trading journal examples. You can choose a format that works best for you, whether it’s handwritten notes in a notebook, a trading journal online spreadsheet, or a specialised app. The key is to be consistent in recording your activity.
Keeping a journal has several benefits. The most important thing is that by using this tool for self-analysis and learning, you can increase your chances of success in markets and make data-driven improvements. Let’s break down why it can be useful.
Whether it’s a forex trading journal or one for stocks, crypto* or indices, the benefits will be the same. The usefulness of keeping a record will be self-evident.
It’s to be expected that over time, a journal will become an invaluable resource for improving skills, minimising risk and achieving more consistent effectiveness in the financial markets. The hardest part is getting started, although keeping a journal is actually easy. Here are the five steps you can follow.
1. Choose a Format
Decide whether you want to keep a physical trading journal book, use a digital spreadsheet, or employ specialised software. Choose a format that you’re comfortable with, and that aligns with your needs. If you’re using a spreadsheet or digital document, you can create a trading journal template that includes the key information you plan to record for each trade.
2. Record Your Trades
Record the details of each trade you make. You can include the date and time, as this information is essential for tracking the timing of trades and assessing how different market conditions may affect your decision-making.
Recording your strategy or approach is a great idea. Regardless of whether it is based on technical, fundamental, or combined analysis, be sure to state your methodology. You may also want to detail the risk management techniques you used, such as stop-loss and take-profit orders. On the TickTrader trading platform, you can find various tools for risk management. After using them, you can evaluate how effectively they protected your capital.
3. Record Reasons and Your Emotional State
Consider writing down the reasons that prompted you to enter the trade. What factors or indicators influenced your decision? For example, if you prefer currencies, did you enter the trade because of a certain technical pattern or a country’s GDP report?
Documenting your emotional state before and during the trade is also important. Were you confident, anxious or fearful? An honest self-assessment of your emotions is critical to identifying emotional triggers that can influence you.
4. Review Your Trades
Think about reviewing your trades and indicating the final result — profit or loss. Be sure to write down the actual numbers so that you can accurately assess your results. When documenting your trades, it’s crucial to remain objective. Do not justify bad decisions or self-glorify successful ones. The purpose of keeping a journal is to learn and improve.
You can schedule a regular review of your trades. This can be done weekly or monthly, depending on how often you trade. During these reviews, you are likely to find patterns and identify areas for improvement.
5. Be Consistent
Consistency is key. You can develop a routine for recording trades. Make sure you thoroughly document all of them, regardless of their size or perceived importance. If it’s too difficult to do this yourself, you can use an automated trading journal. This is a great solution for those who have a hard time making habits.
Keeping records of your trades is a way to have a structured and systematic approach to monitoring and evaluating trading activity. This leads to better-informed decisions and improved performance.By recording details of trades, strategies, emotions, results, and risk management techniques, you can gain valuable insights into your behaviour and patterns.
White Label
Data API
Web Plug-ins
Poster Maker
Affiliate Program
The risk of loss in trading financial instruments such as stocks, FX, commodities, futures, bonds, ETFs and crypto can be substantial. You may sustain a total loss of the funds that you deposit with your broker. Therefore, you should carefully consider whether such trading is suitable for you in light of your circumstances and financial resources.
No decision to invest should be made without thoroughly conducting due diligence by yourself or consulting with your financial advisors. Our web content might not suit you since we don't know your financial conditions and investment needs. Our financial information might have latency or contain inaccuracy, so you should be fully responsible for any of your trading and investment decisions. The company will not be responsible for your capital loss.
Without getting permission from the website, you are not allowed to copy the website's graphics, texts, or trademarks. Intellectual property rights in the content or data incorporated into this website belong to its providers and exchange merchants.
Not Logged In
Log in to access more features

FastBull Membership
Not yet
Purchase
Log In
Sign Up