• Trade
  • Markets
  • Copy
  • Contests
  • News
  • 24/7
  • Calendar
  • Q&A
  • Chats
Trending
Screeners
SYMBOL
LAST
BID
ASK
HIGH
LOW
NET CHG.
%CHG.
SPREAD
SPX
S&P 500 Index
6857.13
6857.13
6857.13
6865.94
6827.13
+7.41
+ 0.11%
--
DJI
Dow Jones Industrial Average
47850.93
47850.93
47850.93
48049.72
47692.96
-31.96
-0.07%
--
IXIC
NASDAQ Composite Index
23505.13
23505.13
23505.13
23528.53
23372.33
+51.04
+ 0.22%
--
USDX
US Dollar Index
98.750
98.830
98.750
98.980
98.750
-0.230
-0.23%
--
EURUSD
Euro / US Dollar
1.16688
1.16695
1.16688
1.16692
1.16408
+0.00243
+ 0.21%
--
GBPUSD
Pound Sterling / US Dollar
1.33598
1.33606
1.33598
1.33601
1.33165
+0.00327
+ 0.25%
--
XAUUSD
Gold / US Dollar
4227.75
4228.16
4227.75
4230.62
4194.54
+20.58
+ 0.49%
--
WTI
Light Sweet Crude Oil
59.388
59.425
59.388
59.469
59.187
+0.005
+ 0.01%
--

Community Accounts

Signal Accounts
--
Profit Accounts
--
Loss Accounts
--
View More

Become a signal provider

Sell trading signals to earn additional income

View More

Guide to Copy Trading

Get started with ease and confidence

View More

Signal Accounts for Members

All Signal Accounts

Best Return
  • Best Return
  • Best P/L
  • Best MDD
Past 1W
  • Past 1W
  • Past 1M
  • Past 1Y

All Contests

  • All
  • Trump Updates
  • Recommend
  • Stocks
  • Cryptocurrencies
  • Central Banks
  • Featured News
Top News Only
Share

Equinor: Preliminary Estimates Indicate Reservoirs May Contain Between 5 -18 Million Standard Cubic Meters Of Recoverable Oil Equivalents

Share

Japan Chief Cabinet Secretary Kihara: Government To Take Appropriate Steps On Excessive And Disorderly Moves In Foreign Exchange Market, If Necessary

Share

[Report: Amazon Pays €180 Million To Italy To End Tax And Labor Investigations] Amazon Has Paid A Settlement And Dismantled Its Monitoring System For Delivery Drivers In Italy, Ending An Investigation Into Alleged Tax Fraud And Illegal Labor Practices. In July 2024, The Group's Logistics Services Division Was Accused Of Circumventing Labor And Tax Laws By Relying On Cooperatives Or Limited Liability Companies To Supply Workers, Evading VAT, And Reducing Social Security Payments. Sources Say The Group Has Now Paid Approximately €180 Million To Italian Tax Authorities As Part Of A €1 Billion Settlement Involving 33 Companies

Share

Airbus - Booked 797 Gross Aircraft Orders In January-November

Share

[Market Update] Spot Gold Broke Through $4,230 Per Ounce, Up 0.51% On The Day

Share

Reserve Bank Of India Chief Malhotra: There Will Be Ample Liquidity As Long As We Are In An Easing Cycle

Share

Reserve Bank Of India Chief Malhotra: Quantum Of System Liquidity Will Be Managed To Ensure Monetary Transmission Is Happening

Share

China's Foreign Ministry: World Bank, IMF, WTO Top Officials To Join

Share

China's Foreign Ministry: China To Hold 1+1 Dialogue With International Economic Orgs On Dec 9

Share

Reserve Bank Of India Chief Malhotra: 5% Of Inr Depreciation Leads To 35 Bps Of Inflation

Share

Eurostoxx 50 Futures Up 0.14%, DAX Futures Up 0.12%, CAC 40 Futures Up 0.26%, FTSE Futures Up 0.03%

Share

Getlink - Over 1 Million Trucks Crossed Channel Since January 2025

Share

Malaysia International Reserves At $124.1 Billion On November 28 Versus$124.1 Billion On November 14 - Central Bank

Share

Reserve Bank Of India Chief Malhotra: Conscious Effort On Diversifying Gold Reserves

Share

Russian President Putin Thanks Indian Prime Minister Modi For Attention To Ukraine Peace Efforts

Share

Russian President Putin: India-Russia Relations Should Grow And Touch New Heights

Share

Russian President Putin: India Is Not Neutral, India Is On The Side Of Peace

Share

Russian President Putin: We Support Every Effort Towards Peace

Share

Russian President Putin: The World Should Return To Peace

Share

India Prime Minister Modi: We Should All Pursue Peace Together

TIME
ACT
FCST
PREV
Euro Zone IHS Markit Construction PMI (Nov)

A:--

F: --

P: --

Italy IHS Markit Construction PMI (Nov)

A:--

F: --

P: --

U.K. Markit/CIPS Construction PMI (Nov)

A:--

F: --

P: --

France 10-Year OAT Auction Avg. Yield

A:--

F: --

P: --

Euro Zone Retail Sales MoM (Oct)

A:--

F: --

P: --

Euro Zone Retail Sales YoY (Oct)

A:--

F: --

P: --

Brazil GDP YoY (Q3)

A:--

F: --

P: --

U.S. Challenger Job Cuts (Nov)

A:--

F: --

P: --

U.S. Challenger Job Cuts MoM (Nov)

A:--

F: --

P: --

U.S. Challenger Job Cuts YoY (Nov)

A:--

F: --

P: --

U.S. Initial Jobless Claims 4-Week Avg. (SA)

A:--

F: --

P: --

U.S. Weekly Initial Jobless Claims (SA)

A:--

F: --

P: --

U.S. Weekly Continued Jobless Claims (SA)

A:--

F: --

P: --

Canada Ivey PMI (SA) (Nov)

A:--

F: --

P: --

Canada Ivey PMI (Not SA) (Nov)

A:--

F: --

P: --

U.S. Non-Defense Capital Durable Goods Orders Revised MoM (Excl. Aircraft) (SA) (Sept)

A:--

F: --

P: --
U.S. Factory Orders MoM (Excl. Transport) (Sept)

A:--

F: --

P: --

U.S. Factory Orders MoM (Sept)

A:--

F: --

P: --

U.S. Factory Orders MoM (Excl. Defense) (Sept)

A:--

F: --

P: --

U.S. EIA Weekly Natural Gas Stocks Change

A:--

F: --

P: --

Saudi Arabia Crude Oil Production

A:--

F: --

P: --

U.S. Weekly Treasuries Held by Foreign Central Banks

A:--

F: --

P: --

Japan Foreign Exchange Reserves (Nov)

A:--

F: --

P: --

India Repo Rate

A:--

F: --

P: --

India Benchmark Interest Rate

A:--

F: --

P: --

India Reverse Repo Rate

A:--

F: --

P: --

India Cash Reserve Ratio

A:--

F: --

P: --

Japan Leading Indicators Prelim (Oct)

A:--

F: --

P: --

U.K. Halifax House Price Index YoY (SA) (Nov)

A:--

F: --

P: --

U.K. Halifax House Price Index MoM (SA) (Nov)

A:--

F: --

P: --

France Current Account (Not SA) (Oct)

--

F: --

P: --

France Trade Balance (SA) (Oct)

--

F: --

P: --

France Industrial Output MoM (SA) (Oct)

--

F: --

P: --

Italy Retail Sales MoM (SA) (Oct)

--

F: --

P: --

Euro Zone Employment YoY (SA) (Q3)

--

F: --

P: --

Euro Zone GDP Final YoY (Q3)

--

F: --

P: --

Euro Zone GDP Final QoQ (Q3)

--

F: --

P: --

Euro Zone Employment Final QoQ (SA) (Q3)

--

F: --

P: --

Euro Zone Employment Final (SA) (Q3)

--

F: --

P: --
Brazil PPI MoM (Oct)

--

F: --

P: --

Mexico Consumer Confidence Index (Nov)

--

F: --

P: --

Canada Unemployment Rate (SA) (Nov)

--

F: --

P: --

Canada Labor Force Participation Rate (SA) (Nov)

--

F: --

P: --

Canada Employment (SA) (Nov)

--

F: --

P: --

Canada Part-Time Employment (SA) (Nov)

--

F: --

P: --

Canada Full-time Employment (SA) (Nov)

--

F: --

P: --

U.S. Personal Income MoM (Sept)

--

F: --

P: --

U.S. Dallas Fed PCE Price Index YoY (Sept)

--

F: --

P: --

U.S. PCE Price Index YoY (SA) (Sept)

--

F: --

P: --

U.S. PCE Price Index MoM (Sept)

--

F: --

P: --

U.S. Personal Outlays MoM (SA) (Sept)

--

F: --

P: --

U.S. Core PCE Price Index MoM (Sept)

--

F: --

P: --

U.S. UMich 5-Year-Ahead Inflation Expectations Prelim YoY (Dec)

--

F: --

P: --

U.S. Core PCE Price Index YoY (Sept)

--

F: --

P: --

U.S. Real Personal Consumption Expenditures MoM (Sept)

--

F: --

P: --

U.S. 5-10 Year-Ahead Inflation Expectations (Dec)

--

F: --

P: --

U.S. UMich Current Economic Conditions Index Prelim (Dec)

--

F: --

P: --

U.S. UMich Consumer Sentiment Index Prelim (Dec)

--

F: --

P: --

U.S. UMich 1-Year-Ahead Inflation Expectations Prelim (Dec)

--

F: --

P: --

U.S. UMich Consumer Expectations Index Prelim (Dec)

--

F: --

P: --

Q&A with Experts
    • All
    • Chatrooms
    • Groups
    • Friends
    Connecting
    .
    .
    .
    Type here...
    Add Symbol or Code

      No matching data

      All
      Trump Updates
      Recommend
      Stocks
      Cryptocurrencies
      Central Banks
      Featured News
      • All
      • Russia-Ukraine Conflict
      • Middle East Flashpoint
      • All
      • Russia-Ukraine Conflict
      • Middle East Flashpoint

      Search
      Products

      Charts Free Forever

      Chats Q&A with Experts
      Screeners Economic Calendar Data Tools
      Membership Features
      Data Warehouse Market Trends Institutional Data Policy Rates Macro

      Market Trends

      Market Sentiment Order Book Forex Correlations

      Top Indicators

      Charts Free Forever
      Markets

      News

      News Analysis 24/7 Columns Education
      From Institutions From Analysts
      Topics Columnists

      Latest Views

      Latest Views

      Trending Topics

      Top Columnists

      Latest Update

      Signals

      Copy Rankings Latest Signals Become a signal provider AI Rating
      Contests
      Brokers

      Overview Brokers Assessment Rankings Regulators News Claims
      Broker listing Forex Brokers Comparison Tool Live Spread Comparison Scam
      Q&A Complaint Scam Alert Videos Tips to Detect Scam
      More

      Business
      Events
      Careers About Us Advertising Help Center

      White Label

      Data API

      Web Plug-ins

      Affiliate Program

      Awards Institution Evaluation IB Seminar Salon Event Exhibition
      Vietnam Thailand Singapore Dubai
      Fans Party Investment Sharing Session
      FastBull Summit BrokersView Expo
      Recent Searches
        Top Searches
          Markets
          News
          Analysis
          User
          24/7
          Economic Calendar
          Education
          Data
          • Names
          • Latest
          • Prev

          View All

          No data

          Scan to Download

          Faster Charts, Chat Faster!

          Download App
          English
          • English
          • Español
          • العربية
          • Bahasa Indonesia
          • Bahasa Melayu
          • Tiếng Việt
          • ภาษาไทย
          • Français
          • Italiano
          • Türkçe
          • Русский язык
          • 简中
          • 繁中
          Open Account
          Search
          Products
          Charts Free Forever
          Markets
          News
          Signals

          Copy Rankings Latest Signals Become a signal provider AI Rating
          Contests
          Brokers

          Overview Brokers Assessment Rankings Regulators News Claims
          Broker listing Forex Brokers Comparison Tool Live Spread Comparison Scam
          Q&A Complaint Scam Alert Videos Tips to Detect Scam
          More

          Business
          Events
          Careers About Us Advertising Help Center

          White Label

          Data API

          Web Plug-ins

          Affiliate Program

          Awards Institution Evaluation IB Seminar Salon Event Exhibition
          Vietnam Thailand Singapore Dubai
          Fans Party Investment Sharing Session
          FastBull Summit BrokersView Expo

          EUR/CAD Hits 16-Year High

          FXOpen

          Economic

          Commodity

          Forex

          Summary:

          Charts show that the euro strengthened against the Canadian dollar on Thursday, with the pair climbing above 1.6460 for the first time since spring 2009, when the world was still reeling from the global financial crisis.

          Charts show that the euro strengthened against the Canadian dollar on Thursday, with the pair climbing above 1.6460 for the first time since spring 2009, when the world was still reeling from the global financial crisis.

          The current weakness of the Canadian dollar is being influenced by several factors:

          → Trade relations with the United States – according to media reports, some Canadian industries such as steel and automotive manufacturing are facing competitive disadvantages under the current agreement.

          → Oil prices have fallen to a five-month low, partly due to expectations surrounding a potential meeting between the US and Russian presidents. As we noted on 13 October, the XTI/USD exchange rate could drift towards $55 per barrel.

          Meanwhile, the euro has benefited from the softening of the US dollar. Notably, the DXY index has turned lower from a key resistance level — the upper boundary of the channel identified in our 9 October analysis.

          However, an examination of the EUR/CAD chart suggests that the current upward momentum may be losing steam.

          Technical Analysis of the EUR/CAD Chart

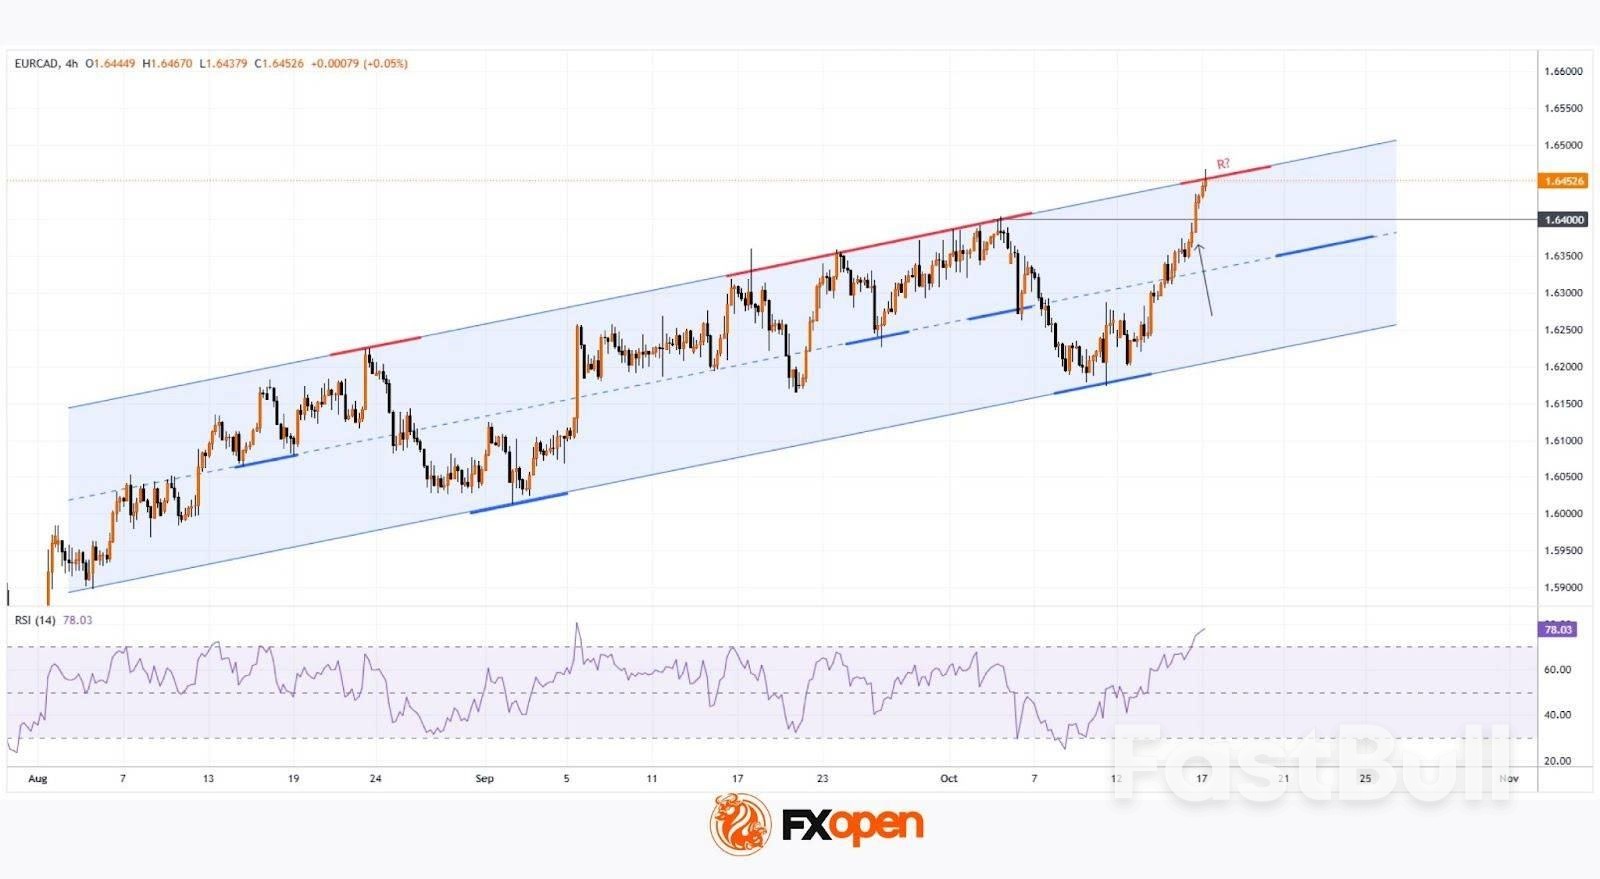
          Price movements — with key turning points shown in bold — outline a rising channel that has remained relevant since August.

          The bearish case rests on the following factors:→ The pair has reached the upper boundary of the channel, which has repeatedly acted as strong resistance and may do so again.→ The sharp mid-October rally pushed the RSI indicator into extreme overbought territory.

          On the other hand, price action continues to reflect strong demand, as seen in the clean breakout above the previous peak near 1.6400, which occurred on a wide bullish candle with minimal pullback.

          In these conditions, it is reasonable to assume that:→ After a 1.6% rise in seven days, some long holders may start taking profits, leading to consolidation near the upper boundary of the channel;→ If a correction from the upper channel line develops, it is likely to be shallow, as bullish activity could re-emerge around the median line, reinforced by the former resistance at 1.6400.

          Source: FXOpen

          To stay updated on all economic events of today, please check out our Economic calendar
          Risk Warnings and Disclaimers
          You understand and acknowledge that there is a high degree of risk involved in trading. Following any strategies or investment methods may lead to potential losses. The content on the site is provided by our contributors and analysts for information purposes only. You are solely responsible for determining whether any trading assets, securities, strategy, or any other product is suitable for investing based on your own investment objectives and financial situation.
          Add to Favorites
          Share

          AI Investment Boom Strengthens Pound and Swedish Krona in Currency Markets

          Gerik

          Economic

          AI Investment Begins to Reshape Currency Markets

          According to a new report by Reuters, the global artificial intelligence (AI) boom is expanding beyond stock markets and into foreign exchange (FX), with Britain and Sweden emerging as unexpected beneficiaries. Both countries received over $4 billion each in private AI investment last year, placing them just behind the U.S. and China in the Stanford University AI Index, and this inflow is now subtly boosting their currencies.
          While FX markets are traditionally driven by macroeconomic indicators such as interest rates or trade balances, analysts from JPMorgan and Rabobank note that AI-driven capital inflows are providing support for the Swedish krona (SEK) and the British pound sterling (GBP).

          Sweden’s Krona Leads Europe in 2025 Currency Performance

          The Swedish krona is the top-performing European currency against a weakening dollar this year, rising nearly 15%. Sterling has also gained around 7%, despite being under pressure from domestic fiscal concerns and volatility in UK politics.
          Jane Foley, Head of FX Strategy at Rabobank, attributes some of this resilience to AI capital flows. “Large AI investments have been announced for both countries. That inward investment could certainly have created some demand for sterling and the Swedish crown,” she explained.
          Sweden’s smaller FX footprint (less than 2% of global trading volume) makes it more sensitive to concentrated capital inflows. In contrast, sterling being the fourth most-traded currency globally absorbs AI-related flows more diffusely.

          Britain and Sweden Attract Big-Tech Commitments

          Both countries have made strategic moves to become AI investment hubs. Britain and the U.S. signed a technology pact last month, with Microsoft pledging £31 billion ($42 billion) in UK tech investments. Meanwhile, AI giant Nvidia is expanding its presence in Sweden, working with Ericsson and AstraZeneca on AI-integrated data solutions.
          Other tech giants Microsoft, Meta, Alphabet, and Brookfield are building data centres in Sweden, drawn by its stable power supply and digital infrastructure.
          These investments, while long-term in nature, have near-term FX effects. In Sweden, speculative FX positions are already reacting: SEB Bank reported that Swedish institutional investors’ net long positions in the krona are near record highs.

          Productivity Growth Outlook Could Shift Sterling Sentiment

          Beyond capital flows, AI is reframing the outlook for productivity growth, which has long been the Achilles' heel of the UK economy. Kenneth Broux of Societe Generale argues that if AI leads to better productivity and offsets aging demographics through automation and upskilling, it could improve public finances and investor sentiment.
          Sterling's future is also tied to political risk. With a November budget approaching and expectations for higher taxes, there is a risk of near-term volatility. Still, analysts at Deutsche Bank forecast GBP/USD to rise to $1.45 over the next two years (from around $1.34 today), citing long-term tailwinds from AI and tech investment.

          AI Creates Currency Differentiation Within Europe

          While it's too early to quantify AI’s full economic impact, it is already differentiating currency performance across Europe. The Swedish krona and British pound are now seen as AI-adjacent currencies, gaining strength not just from macro trends but also from their positioning in the future of technology.
          As central banks weigh rate cuts and global capital looks for future-proof returns, currencies tied to innovation ecosystems may outperform. In the case of Sweden and the UK, AI may be turning into an unexpected pillar of currency resilience.

          Source: Reuters

          To stay updated on all economic events of today, please check out our Economic calendar
          Risk Warnings and Disclaimers
          You understand and acknowledge that there is a high degree of risk involved in trading. Following any strategies or investment methods may lead to potential losses. The content on the site is provided by our contributors and analysts for information purposes only. You are solely responsible for determining whether any trading assets, securities, strategy, or any other product is suitable for investing based on your own investment objectives and financial situation.
          Add to Favorites
          Share

          U.S. Labor Market Cools as Hiring Stagnates — Will the Fed Stay the Course?

          Gerik

          Economic

          Jobless Claims Fall, But Labor Market Still Lacks Momentum
          Despite a decline in first-time unemployment claims to an estimated 217,000 for the week ending October 11, the U.S. labor market shows increasing signs of losing steam. The drop from 235,000 the week before is seen as a positive signal, but experts from Goldman Sachs and JPMorgan Chase caution that hiring activity remains weak, keeping a large number of people on unemployment rolls.
          These estimates come in the absence of fresh official data due to the ongoing federal government shutdown, now in its third week. Economists are relying on unadjusted claims submitted by states and adjusting them using previously published seasonal factors. Notably, no updated data was available from Arizona, Massachusetts, Nevada, and Tennessee.
          Goldman Sachs approximates that if those states followed their historical norms, national claims would fall within the range of 211,000 to 225,000. According to JPMorgan’s Abiel Reinhart, the current figures suggest layoffs are still limited, and that the labor market hasn't deteriorated rapidly.

          Fed Faces Mixed Signals Ahead of Policy Meeting

          The Federal Reserve is closely monitoring labor data to guide its policy decision at its upcoming October 28–29 meeting. According to Fed Chair Jerome Powell, recent evidence indicates that both layoffs and new hiring are low, while perceptions of job availability among households and recruiting difficulty among firms are trending downward.
          The latest Beige Book report, released Wednesday, reinforces this outlook, describing labor demand as “generally weak” across most regions. Economists now describe the labor market as being in a “no hire, no fire” phase reflecting low churn on both ends of the employment spectrum.

          Small Business Hiring Slows Amid Structural Challenges

          Data from the Bank of America Institute points to a slowdown in the small business sector, long considered the engine of job creation. Their alternative hiring index based on small business payment data fell in September. Moreover, new business registrations that include planned wages have dropped below pre-pandemic levels, suggesting a declining appetite for workforce expansion.
          Economists cite multiple structural headwinds: Trump-era trade and immigration policies have contributed to a tightening labor pool, while the rise of artificial intelligence (AI) is reshaping workforce demand, replacing some jobs and transforming others.

          Unemployment Remains Elevated, Hiring Recovery Stalled

          The number of Americans receiving continued unemployment benefits (beyond the first week of claims) often used as a proxy for rehiring remained virtually unchanged at 1.927 million, according to JPMorgan’s estimate. Goldman Sachs provided a similar figure at 1.917 million.
          Meanwhile, the U.S. unemployment rate rose to 4.3% in August, the highest level in nearly four years. The persistent elevation of continuing claims suggests that reabsorption into the labor force is not keeping pace with job losses.

          Fed Caught Between Soft Labor Market and Policy Inertia

          While falling initial jobless claims offer a headline boost, the underlying labor market dynamics remain fragile. Weak hiring activity, stagnant reemployment, and structural pressures from technology and trade policies are all complicating the economic outlook.
          With the government shutdown hampering access to real-time data, the Federal Reserve faces an unusually opaque environment. Whether the Fed holds steady, cuts rates, or signals policy flexibility will depend heavily on what little data is available especially the forthcoming CPI report due October 24. For now, stability in claims data may not be enough to mask a labor market that’s slowly grinding to a halt.
          To stay updated on all economic events of today, please check out our Economic calendar
          Risk Warnings and Disclaimers
          You understand and acknowledge that there is a high degree of risk involved in trading. Following any strategies or investment methods may lead to potential losses. The content on the site is provided by our contributors and analysts for information purposes only. You are solely responsible for determining whether any trading assets, securities, strategy, or any other product is suitable for investing based on your own investment objectives and financial situation.
          Add to Favorites
          Share

          Asian Markets Retreat as U.S. Bank Lending Concerns Spark Global Risk-Off Mood

          Gerik

          Economic

          Stocks

          Wall Street Slide Sends Shockwaves Across Asia

          Equity markets across Asia retreated on Friday after U.S. banking concerns resurfaced, triggering risk aversion among global investors. Japan’s Nikkei 225 slid 1.3% to 47,646.31, tracking the overnight drop in U.S. indices, which were rattled by fresh revelations of credit issues at mid-sized American banks.
          Zions Bancorp., based in Salt Lake City, plunged 13.1% after disclosing a $50 million loan charge-off due to alleged borrower fraud and misrepresentations. Similarly, Western Alliance Bancorp. tumbled 10.8% after announcing a lawsuit against a borrower for suspected fraud further fueling anxiety about systemic credit vulnerabilities.
          The S&P 500 dropped 0.6%, while the Dow Jones Industrial Average and Nasdaq Composite lost 0.7% and 0.5%, respectively. According to Stephen Innes from SPI Asset Management, "regional banks have become the canaries in the credit coal mine," and the market is now digesting what he called the "return of the credit bogeyman" after months of AI and interest-rate optimism.

          Asian Indices Fall in Tandem with Global Sentiment

          Japan not only faced external headwinds from Wall Street but also internal political uncertainty. The election of conservative lawmaker Sanae Takaichi as head of the Liberal Democratic Party came after the collapse of her coalition with Komeito, leaving doubts about her ability to form a stable government.
          In China, markets were pressured by escalating trade tensions with the U.S., sending Hong Kong’s Hang Seng Index down 1.6% to 25,473.09, while the Shanghai Composite fell 1% to 3,877.20. Investor caution also rose ahead of next week’s critical Communist Party leadership meeting and economic data release.
          South Korea’s Kospi bucked the regional trend with a modest 0.2% gain to 3,754.28, lifted by optimism surrounding U.S.-South Korea trade talks and a dip in the seasonally adjusted unemployment rate to 2.5% in September.
          Elsewhere in the region, Australia’s S&P/ASX 200 declined 0.8% to 8,993.80, reversing gains from the previous day’s record high, driven by broad-based weakness in energy and tech sectors. Taiwan’s Taiex shed 0.9%, while India’s Sensex edged up less than 0.2%.

          Safe-Haven Rally: Gold Breaks $4,383 as Oil Slips

          As equity risk deepened, investors fled to traditional safe havens. Gold surged 1.18% to over $4,383/oz, extending its record-breaking rally amid expectations of Fed policy easing and worsening geopolitical sentiment, especially between Washington and Beijing. Meanwhile, crude oil prices softened slightly, with WTI down $0.10 to $56.89 and Brent lower by $0.09 to $60.97.
          Currency markets reflected cautious sentiment. The U.S. dollar slipped to 150.10 yen, down from 150.44, while the euro inched higher to $1.1707.

          Risk Aversion Resurfaces Amid Credit and Political Uncertainty

          Friday’s downturn in Asian markets underscores the fragility of the global financial system’s current optimism. With the specter of bank loan defaults in the U.S. and renewed geopolitical friction between Washington and Beijing, investors are reassessing risk across both equity and commodity markets.
          The ongoing political uncertainty in Japan and upcoming leadership developments in China add layers of volatility ahead. As gold reclaims its role as the dominant safe-haven asset, equity markets may continue to struggle under the weight of rising credit scrutiny and shaky global confidence.

          Source: AP

          To stay updated on all economic events of today, please check out our Economic calendar
          Risk Warnings and Disclaimers
          You understand and acknowledge that there is a high degree of risk involved in trading. Following any strategies or investment methods may lead to potential losses. The content on the site is provided by our contributors and analysts for information purposes only. You are solely responsible for determining whether any trading assets, securities, strategy, or any other product is suitable for investing based on your own investment objectives and financial situation.
          Add to Favorites
          Share

          ECB Agrees Policy Is In Good Place As Thoughts On Future Diverge

          James Whitman

          Central Bank

          Economic

          European Central Bank President Christine Lagarde has taken her mantra that interest rates are in a “good place” to Washington and received backup from nearly all her colleagues that also made the trip.

          Policymakers speaking on the sidelines of the IMF’s annual meetings in the US capital echoed Lagarde in signaling that the ECB is unlikely to cut its deposit rate, which has been at 2% since June, at this month’s meeting.

          Thoughts beyond that weren’t quite so aligned.

          Some warned that inflation risks are more on the downside and argued that a rate cut is the more likely next move. Others expressed concern that price pressures may turn out to be stronger than thought and opened the door to a hike as the ECB’s next step.

          Yet others — still suffering from ripple effects of the unconventional tools used to tackle past crises — want to preserve firepower and see the ECB’s job done unless it encounters another big shock.

          Chief Economist Philip Lane stuck to the script on how policy will be set looking ahead. “We mean it when we say it’s kind of data-dependent, meeting by meeting,” he said during a panel discussion, reiterating the ECB’s official line.

          What follows is a list of highlights from interviews and comments published this week:

          Christine Lagarde, president:

          “We are in a good place. But we have to anticipate anything happening,” she said in an interview with CNBC. “We’re positioned to respond just in case.”

          Asked whether monetary easing is over, she said “I would never say that because I think the job of a central banker is never done.”

          Philip Lane, chief economist:

          “We’re going to really be trying to be as open-minded as possible, go meeting by meeting,” he said. “If we want to do something, we will do it” and “we can change our mind eight times a year,” but “we mean it when we say it’s kind of data dependent, meeting by meeting.”

          Joachim Nagel, Governing Council member from Germany:

          “I’m rather comfortable where we are,” he told Bloomberg TV. “When there’s new data coming that gives me maybe a different opinion, I’m open to change something. But for the moment I would say it’s good where we are.”

          Francois Villeroy de Galhau, Governing Council member from France:

          “If there is a next move, a rate cut is more plausible, more likely than a rate hike,” he said in a Bloomberg TV interview. “I see few risks on the upside” but “there are more risks on the downside.”

          “We are in a good place but I fully agree with Christine Lagarde, our president, that a good place is not a fixed place.”

          Pierre Wunsch, Governing Council member from Belgium:

          We don’t “see big risks to inflation on the upside or downside,” but “if I would have to choose between risk on the upside or downside, I would say probably a bit more on the downside because of the appreciation of the euro, cheap Chinese imports and the economy.” Still, “we’re in a good place.”

          Martin Kocher, Governing Council member from Austria:

          “There is a good argument to be made for not adjusting policy rates, for not trying to over-engineer what we are doing as long as we are close to the 2%, as long as there is no shocks from the outside that might lead us to other conclusions,” he said. “We are in a good place,” and “it’s important to have dry powder, acting power and quickly adjust policy according to what is coming.”

          Olli Rehn, Governing Council member from Finland:

          “We have risks that are two sided,” and “it’s important in the current context where we have pervasive uncertainty still due to trade wars and due to geopolitical tensions that we maintain full freedom of action, we maintain optionality in monetary policy.”

          Gabriel Makhlouf, Governing Council member from Ireland:

          “I’m more focused on pressures that are going to push inflation up rather than pressures that are going to reduce growth,” he said in an interview. “On this debate about undershooting, I’m more worried that we’re going to be over than under 2%.”

          “For me, the next move is two-sided,” he added. “I’m not in the camp of those who think that we need another cut. I’m in the camp that says we’re probably in a fine position, but we need to pay attention to the fact that actually there are price pressures out there.”

          Madis Muller, Governing Council member from Estonia:

          With interest rates at an appropriate level, officials should be “patient” and mindful of developments that could pull price pressures in both directions. China’s export controls “show how barriers to free trade introduced by other countries can have an inflationary impact also in Europe.”

          “It is hard to predict when will it be justified to change rates again, and I personally don’t see why we should have an easing bias.”

          Primoz Dolenc, Governing Council member from Slovenia:

          “Current data show that the inflation undershoot we had projected for next year might even be slightly less pronounced than expected.” This “will probably be reflected in our next projection.”

          While risks to the growth outlook are “still a little bit to the downside,” those to inflation are “more or less balanced.” For monetary policy, this means that “the next interest-rate move could go in either direction.” But “we’re in balance and I’d find it really hard to find evidence to change monetary policy right now or in the next months.”

          Edward Scicluna, Governing Council member from Malta:

          “It’s not so straightforward whether higher trade tariffs will be disinflationary or inflationary,” he said. “The jury is still out and we shouldn’t jump to conclusions as this is crucial.”

          He doesn’t foresee changes to borrowing costs at the end of month, but expects a “more intense” debate in December, when more data — including fresh staff projections — are on hand. However, he said that “for me, it would need convincing arguments to support another cut. The onus is on those who want to cut further to convince the rest of us.”

          Source: Bloomberg Europe

          To stay updated on all economic events of today, please check out our Economic calendar
          Risk Warnings and Disclaimers
          You understand and acknowledge that there is a high degree of risk involved in trading. Following any strategies or investment methods may lead to potential losses. The content on the site is provided by our contributors and analysts for information purposes only. You are solely responsible for determining whether any trading assets, securities, strategy, or any other product is suitable for investing based on your own investment objectives and financial situation.
          Add to Favorites
          Share

          Why India’s Weak Rupee Has Suddenly Spiked In Value

          Samantha Luan

          Forex

          Political

          Economic

          Commodity

          Until mid-October, the Indian rupee was Asia’s worst-performing currency of 2025. It was heading for its biggest annual drop since 2022 — the year Russia’s invasion of Ukraine sent oil prices soaring past $100 per barrel, a major blow for India, which imports about 90% of its crude.This year, the rupee’s weakness has been fueled by higher US tariffs on Indian exports and a wave of foreign outflows from local equities. By Oct. 14, it had fallen to a near-record low of 88.8025 per dollar. Then, over just three days, the rupee rebounded more than 1% — a move traders attributed to central bank intervention.

          Now the rupee is at a crucial juncture. There are tentative signs US-India trade ties may be improving, which could ease pressure on the currency. But if that doesn’t happen, the Reserve Bank of India may be forced to step in again — especially if it suspects a pickup in speculative bets against the rupee.The RBI grew alarmed in mid-October as the rupee neared 89 to the dollar, and was determined not to let the currency breach its record low of 88.8050, according to a person familiar with the matter.In response, it’s understood that the RBI sold US dollars from its foreign exchange reserves, in both the spot and offshore markets.

          In the weeks prior, the central bank also built up short dollar positions worth at least $15 billion in the offshore non-deliverable forwards market. In effect, the RBI was betting on a weaker US dollar — and shoring up the rupee — by entering contracts to sell the greenback at a future date.While the new RBI governor earlier this year showed a willingness to loosen the central bank’s tight grip on the currency, traders now expect it to intervene more aggressively to stamp out what it believes are speculative bets on the currency’s decline. It has ample firepower to do so, with nearly $700 billion in foreign-exchange reserves — among the largest in the world and enough to cover about 11 months of imports.

          The rupee first dipped in January before it eked out slight gains against the dollar in March and April. At its strongest, in early May, the currency traded at 83.7538 per dollar. This was around the same time investors bet India would be among the first to clinch a trade deal with the US. Expectations of lower tariffs on Indian exports fueled optimism that foreign capital would flow into the country as companies sought manufacturing hubs outside of China.

          The tide turned in July, when President Donald Trump announced plans to impose higher-than-anticipated tariffs and threatened to penalize India for purchasing Russian energy and weapons. The levies dashed New Delhi’s hopes of preferential treatment over its Asian peers and the rupee suffered its worst monthly loss since 2022. In August, the US set tariffs on most Indian exports at 50% — the highest across Asia — which included a “secondary” 25% penalty tariff for India’s trade with Russia. The rupee fell to a series of record lows, breaching 88 per dollar.

          In September, the currency weakened further after reports that President Trump had urged European nations to impose similar Russia-related penalty tariffs on Indian imports, and that the US planned to raise the fee for its high-skilled H-1B visa — the vast majority of which go to Indian-born workers — from a few hundred dollars to $100,000.A frantic foreign exodus from Indian equities this year due to US tariffs, pricey stock valuations, slowing economic growth and persistently soft corporate earnings, has piled additional pressure on the rupee. As of Oct. 15, foreign investors had pulled out more than $16.5 billion from Indian shares this year, closing in on a record outflow set in 2022.

          The rupee’s overall depreciation this year didn’t come as a huge surprise; the currency has lost value every year since 2018. What made its weakness stand out is that the US dollar itself has been slipping, while many emerging-market currencies in the region have strengthened.The rupee slumped this year as peers such as the Taiwan dollar, Malaysian ringgit, Thai baht and South Korean won strengthened.One reason is that those countries face far less US tariffs on their exports. India’s economy — though largely driven by its domestic market — has been hit particularly hard because the US is its largest export market.

          Another drag on the rupee has been India’s persistent current account deficit, which means it imports more than it exports. India must buy foreign currency — normally US dollars — to pay for those imports, which weakens demand for the rupee. By contrast, Taiwan, Malaysia, Thailand and South Korea are all running current account surpluses, which means they export more than they import, earning foreign currency from their sales abroad.Fears that the US dollar will continue to fall amid trade frictions, policy uncertainties and potential Federal Reserve rate cuts have also prompted exporters elsewhere in Asia to sell more of their dollar holdings than usual and convert the proceeds back into their local currencies, further amplifying their value.

          A weaker rupee makes Indian goods and services cheaper abroad, boosting export competitiveness. This helps to offset the tariff pressures facing exporters, as India seeks to expand its markets by signing trade deals with countries such as the UK.It’s also a boon for families of Indian workers abroad who send money home. India is the world’s largest recipient of remittances, with a record $137 billion flowing into the country in 2024, according to the World Bank. A softer currency means every dollar remitted buys more rupees, lifting household incomes and consumption.

          On the flip side, a weaker rupee makes imports more expensive, pushing up the cost of essential items such as oil, fertilizers and electronics, most of which India buys from overseas.

          Source: Bloomberg Europe

          To stay updated on all economic events of today, please check out our Economic calendar
          Risk Warnings and Disclaimers
          You understand and acknowledge that there is a high degree of risk involved in trading. Following any strategies or investment methods may lead to potential losses. The content on the site is provided by our contributors and analysts for information purposes only. You are solely responsible for determining whether any trading assets, securities, strategy, or any other product is suitable for investing based on your own investment objectives and financial situation.
          Add to Favorites
          Share

          Korea, US Yet To Agree On FX Issues Tied To $350 Billion Fund

          James Whitman

          Forex

          Economic

          South Korea remains in intensive talks with the US to iron out final details of its $350 billion investment pledge, including a possible currency swap line aimed at safeguarding the Asian nation from potential financial instability.

          Several senior officials from Seoul, including presidential policy chief Kim Yong-beom and Trade Minister Yeo Han-koo, are in Washington this week seeking to finalize the agreement before the Asia-Pacific Economic Cooperation summit later this month. Policy Chief Kim also met with Commerce Secretary Howard Lutnick and other US officials during the visit.

          The trade talks have been in deadlock for more than two months, with the two countries divided over the implementation of the $350 billion investment fund. The investment pledge is the centerpiece of a trade agreement that capped US duties on Korean goods at 15%. With the details still unresolved, the US has yet to lower tariffs on cars from 25%, leaving South Korean automakers at a disadvantage against their Japanese rivals.

          President Donald Trump has repeatedly insisted that Seoul’s investment package be made “upfront.” South Korea pushed back, arguing that the amount represents more than 80% of its foreign exchange reserves. Officials warned that such an outflow could weaken the won and have pressed the US to establish a currency swap arrangement.

          With exports equivalent to over 40% of South Korea’s GDP, the finalized trade deal is expected to provide greater stability and confidence in its economy.

          Finance Minister Koo Yun-cheol said he had conveyed to Treasury Secretary Scott Bessent that making the investment upfront in cash would not be feasible given Korea’s foreign-exchange constraints.

          “Once an alternative structure is proposed, we’ll assess the associated FX demand and whether it can be managed within a range that ensures stability in Korea’s currency market,” Koo told reporters in Washington during a televised interview. “Depending on how that changes, we’ll then determine whether a currency swap is necessary, whether it’s feasible, and if so, to what extent it should be pursued.”

          The Munhwa Ilbo newspaper earlier reported that Korea is in discussions with the US on an Argentina-style currency swap to help curb volatility in its FX market. The arrangement would likely be made through US Treasury funding, rather than a direct deal between the Federal Reserve and the Bank of Korea, the report said.

          Policy Chief Kim also visited the US Office of Management and Budget on Thursday to discuss a shipbuilding initiative known as “Make American Shipbuilding Great Again,” according to Yonhap News.

          His visit comes after China sanctioned the US unit of South Korean shipbuilding giant Hanwha Ocean Co., and threatened further retaliatory measures against the industry. The US State Department condemned China’s actions as an “irresponsible attempt” to disrupt shipbuilding cooperation between Korea and the US, Yonhap reported.

          Source: Bloomberg

          To stay updated on all economic events of today, please check out our Economic calendar
          Risk Warnings and Disclaimers
          You understand and acknowledge that there is a high degree of risk involved in trading. Following any strategies or investment methods may lead to potential losses. The content on the site is provided by our contributors and analysts for information purposes only. You are solely responsible for determining whether any trading assets, securities, strategy, or any other product is suitable for investing based on your own investment objectives and financial situation.
          Add to Favorites
          Share
          FastBull
          Copyright © 2025 FastBull Ltd

          728 RM B 7/F GEE LOK IND BLDG NO 34 HUNG TO RD KWUN TONG KLN HONG KONG

          TelegramInstagramTwitterfacebooklinkedin
          App Store Google Play Google Play
          Products
          Charts

          Chats

          Q&A with Experts
          Screeners
          Economic Calendar
          Data
          Tools
          Membership
          Features
          Function
          Markets
          Copy Trading
          Latest Signals
          Contests
          News
          Analysis
          24/7
          Columns
          Education
          Company
          Careers
          About Us
          Contact Us
          Advertising
          Help Center
          Feedback
          User Agreement
          Privacy Policy
          Business

          White Label

          Data API

          Web Plug-ins

          Poster Maker

          Affiliate Program

          Risk Disclosure

          The risk of loss in trading financial instruments such as stocks, FX, commodities, futures, bonds, ETFs and crypto can be substantial. You may sustain a total loss of the funds that you deposit with your broker. Therefore, you should carefully consider whether such trading is suitable for you in light of your circumstances and financial resources.

          No decision to invest should be made without thoroughly conducting due diligence by yourself or consulting with your financial advisors. Our web content might not suit you since we don't know your financial conditions and investment needs. Our financial information might have latency or contain inaccuracy, so you should be fully responsible for any of your trading and investment decisions. The company will not be responsible for your capital loss.

          Without getting permission from the website, you are not allowed to copy the website's graphics, texts, or trademarks. Intellectual property rights in the content or data incorporated into this website belong to its providers and exchange merchants.

          Not Logged In

          Log in to access more features

          FastBull Membership

          Not yet

          Purchase

          Become a signal provider
          Help Center
          Customer Service
          Dark Mode
          Price Up/Down Colors

          Log In

          Sign Up

          Position
          Layout
          Fullscreen
          Default to Chart
          The chart page opens by default when you visit fastbull.com