• Trade
  • Markets
  • Copy
  • Contests
  • News
  • 24/7
  • Calendar
  • Q&A
  • Chats
Trending
Screeners
SYMBOL
LAST
BID
ASK
HIGH
LOW
NET CHG.
%CHG.
SPREAD
SPX
S&P 500 Index
6870.39
6870.39
6870.39
6895.79
6858.28
+13.27
+ 0.19%
--
DJI
Dow Jones Industrial Average
47954.98
47954.98
47954.98
48133.54
47871.51
+104.05
+ 0.22%
--
IXIC
NASDAQ Composite Index
23578.12
23578.12
23578.12
23680.03
23506.00
+72.99
+ 0.31%
--
USDX
US Dollar Index
98.910
98.990
98.910
98.960
98.730
-0.040
-0.04%
--
EURUSD
Euro / US Dollar
1.16515
1.16522
1.16515
1.16717
1.16341
+0.00089
+ 0.08%
--
GBPUSD
Pound Sterling / US Dollar
1.33196
1.33203
1.33196
1.33462
1.33136
-0.00116
-0.09%
--
XAUUSD
Gold / US Dollar
4212.01
4212.42
4212.01
4218.85
4190.61
+14.10
+ 0.34%
--
WTI
Light Sweet Crude Oil
59.264
59.294
59.264
60.084
59.160
-0.545
-0.91%
--

Community Accounts

Signal Accounts
--
Profit Accounts
--
Loss Accounts
--
View More

Become a signal provider

Sell trading signals to earn additional income

View More

Guide to Copy Trading

Get started with ease and confidence

View More

Signal Accounts for Members

All Signal Accounts

Best Return
  • Best Return
  • Best P/L
  • Best MDD
Past 1W
  • Past 1W
  • Past 1M
  • Past 1Y

All Contests

  • All
  • Trump Updates
  • Recommend
  • Stocks
  • Cryptocurrencies
  • Central Banks
  • Featured News
Top News Only
Share

India Government: Cancellations Are On Account Of Developer Delays And Not Due To Transmission Side Delays

Share

Fitch: We See Moderation Of Export Performance In China In 2026

Share

India Government: Revokes Grid Access Permissions For Renewable Energy Projects

Share

Fitch: Calibrating Fiscal And Monetary Policies In China To Boost Domestic Demand And Reverse Deflationary Pressures Will Be A Key Challenge

Share

Stats Office - Tanzania Inflation At 3.4% Year-On-Year In November

Share

Fitch: External Risks From US Tariffs For Greater China Region Have Subsided

Share

Temasek CEO Dilhan Pillay: We Are Taking A Conservative Stance On Allocating Capital

Share

Brazil Economists See Brazilian Real At 5.40 Per Dollar By Year-End 2025 Versus 5.40 In Previous Estimate - Central Bank Poll

Share

Brazil Economists See Year-End 2026 Interest Rate Selic At 12.25% Versus 12.00% In Previous Estimate - Central Bank Poll

Share

Brazil Economists See Year-End 2025 Interest Rate Selic At 15.00% Versus 15.00% In Previous Estimate - Central Bank Poll

Share

EU Commission Says Meta Has Committed To Give EU Users Choice On Personalised Ads

Share

Sources Revealed That The Bank Of England Has Invited Employees To Voluntarily Apply For Layoffs

Share

The Bank Of England Plans To Cut Staff Due To Budget Pressures

Share

Traders Believe There Is Less Than A 10% Chance That The European Central Bank Will Cut Interest Rates By 25 Basis Points In 2026

Share

Egypt, European Bank For Reconstruction And Development Sign $100 Million Financing Agreement

Share

Israel Budget Deficit 4.5% Of GDP In November Over Past 12 Months Versus 4.9% Deficit In October

Share

JPMorgan - Council Chaired By Jamie Dimon Includes Jeff Bezos

Share

UK Government: UK Health Security Agency Identified New Recombinant Mpox Virus In England In Individual Who Had Recently Travelled To Asia

Share

European Central Bank Governing Council Member Kazimir: I See No Reason To Change Rates In The Coming Months, Definitely No In December

Share

European Central Bank Governing Council Member Kazimir: Overengineering Policy Around Small Inflation Deviations Would Introduce Unnecessary Policy Uncertainty

TIME
ACT
FCST
PREV
France Industrial Output MoM (SA) (Oct)

A:--

F: --

P: --
France Trade Balance (SA) (Oct)

A:--

F: --

P: --
Euro Zone Employment YoY (SA) (Q3)

A:--

F: --

P: --
Canada Part-Time Employment (SA) (Nov)

A:--

F: --

P: --

Canada Unemployment Rate (SA) (Nov)

A:--

F: --

P: --

Canada Full-time Employment (SA) (Nov)

A:--

F: --

P: --

Canada Labor Force Participation Rate (SA) (Nov)

A:--

F: --

P: --

Canada Employment (SA) (Nov)

A:--

F: --

P: --

U.S. PCE Price Index MoM (Sept)

A:--

F: --

P: --

U.S. Personal Income MoM (Sept)

A:--

F: --

P: --

U.S. Core PCE Price Index MoM (Sept)

A:--

F: --

P: --

U.S. PCE Price Index YoY (SA) (Sept)

A:--

F: --

P: --

U.S. Core PCE Price Index YoY (Sept)

A:--

F: --

P: --

U.S. Personal Outlays MoM (SA) (Sept)

A:--

F: --

P: --
U.S. 5-10 Year-Ahead Inflation Expectations (Dec)

A:--

F: --

P: --

U.S. Real Personal Consumption Expenditures MoM (Sept)

A:--

F: --

P: --
U.S. Weekly Total Rig Count

A:--

F: --

P: --

U.S. Weekly Total Oil Rig Count

A:--

F: --

P: --

U.S. Consumer Credit (SA) (Oct)

A:--

F: --

P: --
China, Mainland Foreign Exchange Reserves (Nov)

A:--

F: --

P: --

Japan Trade Balance (Oct)

A:--

F: --

P: --

Japan Nominal GDP Revised QoQ (Q3)

A:--

F: --

P: --

China, Mainland Imports YoY (CNH) (Nov)

A:--

F: --

P: --

China, Mainland Exports (Nov)

A:--

F: --

P: --

China, Mainland Imports (CNH) (Nov)

A:--

F: --

P: --

China, Mainland Trade Balance (CNH) (Nov)

A:--

F: --

P: --

China, Mainland Exports YoY (USD) (Nov)

A:--

F: --

P: --

China, Mainland Imports YoY (USD) (Nov)

A:--

F: --

P: --

Germany Industrial Output MoM (SA) (Oct)

A:--

F: --

P: --
Euro Zone Sentix Investor Confidence Index (Dec)

A:--

F: --

P: --

Canada National Economic Confidence Index

--

F: --

P: --

U.K. BRC Like-For-Like Retail Sales YoY (Nov)

--

F: --

P: --

U.K. BRC Overall Retail Sales YoY (Nov)

--

F: --

P: --

Australia Overnight (Borrowing) Key Rate

--

F: --

P: --

RBA Rate Statement
RBA Press Conference
Germany Exports MoM (SA) (Oct)

--

F: --

P: --

U.S. NFIB Small Business Optimism Index (SA) (Nov)

--

F: --

P: --

Mexico 12-Month Inflation (CPI) (Nov)

--

F: --

P: --

Mexico Core CPI YoY (Nov)

--

F: --

P: --

Mexico PPI YoY (Nov)

--

F: --

P: --

U.S. Weekly Redbook Index YoY

--

F: --

P: --

U.S. JOLTS Job Openings (SA) (Oct)

--

F: --

P: --

China, Mainland M1 Money Supply YoY (Nov)

--

F: --

P: --

China, Mainland M0 Money Supply YoY (Nov)

--

F: --

P: --

China, Mainland M2 Money Supply YoY (Nov)

--

F: --

P: --

U.S. EIA Short-Term Crude Production Forecast For The Year (Dec)

--

F: --

P: --

U.S. EIA Natural Gas Production Forecast For The Next Year (Dec)

--

F: --

P: --

U.S. EIA Short-Term Crude Production Forecast For The Next Year (Dec)

--

F: --

P: --

EIA Monthly Short-Term Energy Outlook
U.S. API Weekly Gasoline Stocks

--

F: --

P: --

U.S. API Weekly Cushing Crude Oil Stocks

--

F: --

P: --

U.S. API Weekly Crude Oil Stocks

--

F: --

P: --

U.S. API Weekly Refined Oil Stocks

--

F: --

P: --

South Korea Unemployment Rate (SA) (Nov)

--

F: --

P: --

Japan Reuters Tankan Non-Manufacturers Index (Dec)

--

F: --

P: --

Japan Reuters Tankan Manufacturers Index (Dec)

--

F: --

P: --

Japan Domestic Enterprise Commodity Price Index MoM (Nov)

--

F: --

P: --

Japan Domestic Enterprise Commodity Price Index YoY (Nov)

--

F: --

P: --

China, Mainland PPI YoY (Nov)

--

F: --

P: --

China, Mainland CPI MoM (Nov)

--

F: --

P: --

Q&A with Experts
    • All
    • Chatrooms
    • Groups
    • Friends
    Connecting
    .
    .
    .
    Type here...
    Add Symbol or Code

      No matching data

      All
      Trump Updates
      Recommend
      Stocks
      Cryptocurrencies
      Central Banks
      Featured News
      • All
      • Russia-Ukraine Conflict
      • Middle East Flashpoint
      • All
      • Russia-Ukraine Conflict
      • Middle East Flashpoint

      Search
      Products

      Charts Free Forever

      Chats Q&A with Experts
      Screeners Economic Calendar Data Tools
      Membership Features
      Data Warehouse Market Trends Institutional Data Policy Rates Macro

      Market Trends

      Market Sentiment Order Book Forex Correlations

      Top Indicators

      Charts Free Forever
      Markets

      News

      News Analysis 24/7 Columns Education
      From Institutions From Analysts
      Topics Columnists

      Latest Views

      Latest Views

      Trending Topics

      Top Columnists

      Latest Update

      Signals

      Copy Rankings Latest Signals Become a signal provider AI Rating
      Contests
      Brokers

      Overview Brokers Assessment Rankings Regulators News Claims
      Broker listing Forex Brokers Comparison Tool Live Spread Comparison Scam
      Q&A Complaint Scam Alert Videos Tips to Detect Scam
      More

      Business
      Events
      Careers About Us Advertising Help Center

      White Label

      Data API

      Web Plug-ins

      Affiliate Program

      Awards Institution Evaluation IB Seminar Salon Event Exhibition
      Vietnam Thailand Singapore Dubai
      Fans Party Investment Sharing Session
      FastBull Summit BrokersView Expo
      Recent Searches
        Top Searches
          Markets
          News
          Analysis
          User
          24/7
          Economic Calendar
          Education
          Data
          • Names
          • Latest
          • Prev

          View All

          No data

          Scan to Download

          Faster Charts, Chat Faster!

          Download App
          English
          • English
          • Español
          • العربية
          • Bahasa Indonesia
          • Bahasa Melayu
          • Tiếng Việt
          • ภาษาไทย
          • Français
          • Italiano
          • Türkçe
          • Русский язык
          • 简中
          • 繁中
          Open Account
          Search
          Products
          Charts Free Forever
          Markets
          News
          Signals

          Copy Rankings Latest Signals Become a signal provider AI Rating
          Contests
          Brokers

          Overview Brokers Assessment Rankings Regulators News Claims
          Broker listing Forex Brokers Comparison Tool Live Spread Comparison Scam
          Q&A Complaint Scam Alert Videos Tips to Detect Scam
          More

          Business
          Events
          Careers About Us Advertising Help Center

          White Label

          Data API

          Web Plug-ins

          Affiliate Program

          Awards Institution Evaluation IB Seminar Salon Event Exhibition
          Vietnam Thailand Singapore Dubai
          Fans Party Investment Sharing Session
          FastBull Summit BrokersView Expo

          Central Bank Meetings Under The Christmas Tree This Week

          Danske Bank

          Forex

          Political

          Economic

          Central Bank

          Summary:

          In the euro area, focus turns to the Sentix investor confidence indicator for December and the German industrial production data for October. The Sentix indicator will give us the first signal of investor confidence in December while German industrial production is the first 'hard data' for Q4.

          In focus today

          In the euro area, focus turns to the Sentix investor confidence indicator for December and the German industrial production data for October. The Sentix indicator will give us the first signal of investor confidence in December while German industrial production is the first 'hard data' for Q4. The German PMIs suggest that industrial production in October was little changed compared to September.

          Early tomorrow morning, the Reserve Bank of Australia RBA will hold its final monetary policy meeting of the year. We expect no policy changes, in line with consensus and market pricing. Recent solid economic data has driven a hawkish repricing of markets' policy rate expectations, with the next most likely policy change being a rate hike in H2 2026.

          The big event this week is the FOMC meeting on Wednesday, preceded by the much-delayed September JOLTS job openings data on Tuesday. Rate decisions from Canada (Wednesday) as well as Switzerland and Turkey (Thursday) will also draw attention. In Scandinavia, notable data releases include final Swedish CPI and growth figures, Norwegian CPI, and Norges Bank's regional network report.

          Economic and market news

          What happened overnight

          In China, November trade data showed exports rising by 5.9% y/y (prior: -1.1%), exceeding expectations due to strong growth in shipments to non-US markets amid elevated US tariffs. Imports rose 1.9% y/y (prior: 1.0%), below forecasts and signalling subdued domestic demand. This marks the first time China's year-to-date trade surplus in goods exceeded USD 1tn. Read more in Research China – A two-speed economy, 8 December.

          In Japan, total cash earnings were up 2.6% y/y in October compared to 2.1% in September. This leaves real earnings at -0.7% y/y as wages continue to struggle to compensate for particularly food price surges earlier this year. Q3 GDP growth was revised lower to -0.6% on lower investments and exports. This is considered a temporary setback following several strong quarters, though, and it is not enough to derail a December Bank of Japan-hike. Private spending edged 0.2% higher, reflecting continuous recovering consumer sentiment since the spring.

          In Southeast Asia, Thailand launched air strikes on Cambodia, marking the collapse of the Trump-brokered peace deal. Cambodia accused Thailand of the attacks, while Malaysia called for restraint as tensions over historic border disputes escalate.

          What happened over the weekend

          In the euro area, wage growth in Q3 rose against expectations, with compensation per employee rising to 4.0% y/y from 3.8% y/y in Q2. Compared to the ECB staff projections from September, which estimated Q3 wage growth at 3.2% y/y, the high print is a hawkish surprise for the ECB. With headline inflation averaging 2.1%, consumers experienced significant real wage gains, which is supportive for consumption. While inflation is expected below 2% next year due to temporary factors like energy prices and a stronger euro, strong wage growth indicates persistent domestic price pressures.

          GDP growth in Q3 was revised up to 0.3% q/q from 0.2% q/q, driven by rounding adjustments. Private consumption contributed positively but slowed to 0.2% q/q from 0.3% q/q in Q2, reflecting cautious consumer behaviour despite solid real income gains of nearly 2% y/y. Apart from consumption, investments and government consumption were the main growth drivers, while net exports weighed negatively. Read more in Euro Area Macro Monitor – Southern Europe outshines in growth and public finances, 8 December.

          In the US, the delayed September PCE inflation landed close to expectations. Core services inflation momentum cooled slightly at 0.2% m/m SA (cons: 0.2%, prior: 0.1981). At the same time, December's flash consumer confidence index from the University of Michigan revealed a decline in consumers' inflation expectations, with 1-year expectations falling to 4.1% (prior: 4.5%) and 5-year expectations dropping to 3.2% (prior: 3.4%), likely reflecting lower gasoline prices. While no major surprises, this on the margin supports the Fed's rate cut anticipated this week.

          Also in the US, President Trump unveiled his National Security Strategy, emphasising his 'America First' vision. Key priorities include reinforcing US dominance in the Western Hemisphere via the revived Monroe Doctrine, countering China's influence in Latin America, and deterring conflict in the Indo-Pacific through military strength. The strategy also questions Europe's reliability as an ally, calling on NATO members to assume greater defence responsibilities. Notably, the Kremlin welcomed the strategy, stating its adjustments align with Russia's own global perspective.

          In the Russia-Ukraine war, US Special Envoy Keith Kellogg stated that efforts to reach a breakthrough are "really close", with key issues including the Donbas region and Zaporizhzhia nuclear plant. However, the Kremlin has called for radical changes to US proposals, underscoring ongoing challenges in reaching a resolution. Today, Zelensky meets European leaders to discuss next steps, including securing meaningful guarantees.

          In Japan-China relations, tensions escalated as Japanese aircraft were targeted by radar from Chinese fighter jets near Okinawa in two incidents Tokyo called "dangerous". PM Takaichi condemned the actions and lodged a protest with Beijing, while Japan vowed to respond calmly to maintain regional stability. The incidents highlight strained ties amid disputes over Taiwan and broader regional security challenges.

          Equities: Equities slowed on Friday following strong gains earlier in the week. US and European indices were little changed on Friday but ended the week almost 1% higher. Nordic markets outperformed, with Stockholm and Helsinki locking in almost 2% for the week. The explanation is straightforward: Nordic equities lagged in the initial recovery. Asian markets are continuing higher this morning, while US and European futures are somewhat indecisive.

          Although markets appeared calm on the surface on Friday, we note a clear risk-on rotation beneath it, with cyclical sectors rising roughly 1%, financed by declines in defensives. For the week as a whole, global cyclicals outperformed defensives by 2.5 p.p., the strongest relative performance since the earnings season.

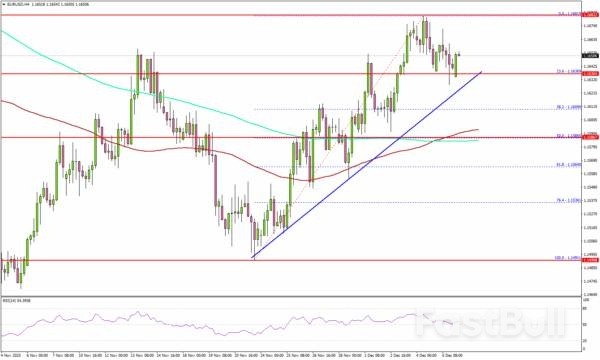
          FI and FX: Last week ended with slightly higher yields, both in Europe (2bp) and the US (4bp). We start the week at unchanged levels compared to Friday in US-treasuries. EURUSD is hovering around 1.165 and USDJPY at 155.2 as markets will increasingly focus on the widely expected Fed rate cut on Wednesday where markets price -23bp.

          Source: Danske Bank

          To stay updated on all economic events of today, please check out our Economic calendar
          Risk Warnings and Disclaimers
          You understand and acknowledge that there is a high degree of risk involved in trading. Following any strategies or investment methods may lead to potential losses. The content on the site is provided by our contributors and analysts for information purposes only. You are solely responsible for determining whether any trading assets, securities, strategy, or any other product is suitable for investing based on your own investment objectives and financial situation.
          Add to Favorites
          Share

          Frontier Markets Shine in 2025, Set to Continue Rally into 2026 as Investors Bet on Resilience and Recovery

          Gerik

          Economic

          Frontier Markets Emerge as 2025’s Top Performers Amid Economic Recalibration

          In a year marked by geopolitical volatility and diverging monetary policies across developed economies, frontier markets have carved out a space of surprising resilience and exceptional performance. The MSCI Frontier Markets Index surged 43% in U.S. dollar terms the strongest annual performance since 2005 while the FTSE Frontier Emerging Markets Government Bond Index posted a 12% gain, also on track for a record. These returns reflect both capital appreciation and high income components, signaling growing investor confidence in economies once thought too risky or unstable for serious allocations.
          The renewed optimism is anchored in improved macroeconomic fundamentals, particularly in nations that have recently exited sovereign debt crises. Countries like Sri Lanka, Ecuador, and Ghana, which were previously undergoing painful restructuring, have managed to stabilize their finances, re-engage with the global debt markets, and reassure investors through more disciplined fiscal management. The shift from skepticism to strategic allocation suggests a causal relationship between policy reform and capital inflows.
          Asia Frontier Capital, for example, has increased equity exposure in Sri Lanka and Bangladesh. At the same time, fixed-income managers such as Federated Hermes and Aberdeen are betting on sovereign debt from Nigeria, Pakistan, and Argentina. Federated Hermes in particular notes that frontier bonds offer both yield and price growth potential, making them attractive for total return portfolios in 2026.

          Less Correlation, More Diversification: Frontier Assets as Portfolio Buffers

          One of the standout features drawing institutional investors to frontier markets is their limited correlation with broader global risk assets. This idiosyncratic nature has proven useful in the current market environment where traditional safe havens like developed-market bonds have shown increased volatility. Portfolio managers like Daniel Wood from William Blair describe frontier markets as one of their “highest convictions,” highlighting countries like Uzbekistan and Kazakhstan for their diversification value. This reflects a strategic allocation motive rather than a short-term trading play.
          While 2025 has been a banner year for returns, not all observers expect the same pace in 2026. Some caution is warranted as yield premiums on frontier debt such as those from Ivory Coast have compressed substantially, reducing the potential upside for new entrants. Liquidity constraints and political instability also remain structural risks that can quickly reverse investor sentiment.
          Nevertheless, the appetite for local-currency bonds continues to build. Aberdeen’s $930 million frontier bond fund plans to increase exposure to Uganda and Kazakhstan’s domestic debt markets, banking on favorable macroeconomic trends and more stable exchange rates. This indicates confidence in local monetary authorities and the potential for real yield gains, assuming inflation remains under control.

          Macroeconomic Outlook: Watching the Central Banks and Inflation Prints

          Looking forward, monetary policy decisions and inflation data from key emerging economies will be closely monitored. The U.S. Federal Reserve is widely expected to cut interest rates, which could further enhance capital flows into higher-yielding frontier assets. Other central bank decisions from Brazil, the Philippines, and Turkey will also shape risk sentiment across the developing world.
          Simultaneously, inflation reports from China, Argentina, and India, as well as trade and industrial output data from countries like Mexico, Taiwan, and Malaysia, will offer clues on demand conditions and supply chain recovery factors that can indirectly affect frontier market exports and investor flows.
          The remarkable rally of frontier markets in 2025 reflects a confluence of structural improvements, investor search for yield, and a relative insulation from global trade and geopolitical tensions. As reforms mature and capital markets deepen, the frontier asset class is evolving from a speculative fringe to a credible diversifier in global portfolios. While risks remain, particularly in liquidity and governance, the core narrative for 2026 is built on stability, reform, and momentum elements that suggest continued investor interest in this dynamic segment of the global economy.

          Source: Bloomberg

          To stay updated on all economic events of today, please check out our Economic calendar
          Risk Warnings and Disclaimers
          You understand and acknowledge that there is a high degree of risk involved in trading. Following any strategies or investment methods may lead to potential losses. The content on the site is provided by our contributors and analysts for information purposes only. You are solely responsible for determining whether any trading assets, securities, strategy, or any other product is suitable for investing based on your own investment objectives and financial situation.
          Add to Favorites
          Share

          Traders Await New Bullish Momentum On XAUUSD

          Winkelmann

          Forex

          Commodity

          XAUUSD continues to rise amid expectations of Fed policy easing and steady gold demand from China, with prices currently standing at 4,217 USD.

          XAUUSD forecast: key trading points

          · The market is focused on the final Fed monetary policy meeting of the year
          · The core PCE price index for September rose to its highest level since April 2024
          · The People's Bank of China increases its gold reserves for the 13th consecutive month
          · XAUUSD forecast for 8 December 2025: 4,365

          Fundamental analysis

          XAUUSD quotes are moderately rising after rebounding confidently from the 4,205 USD support level. The market is focused on the final Fed monetary policy meeting of the year, where traders expect policymakers to move towards lowering interest rates.

          Mixed US labour market data, combined with core inflation that matched forecasts, strengthens the case for further policy easing. The core PCE price index, which excludes food and energy, rose 0.2% month-on-month and 2.8% year-over-year in September, the highest since April 2024.

          Current market expectations indicate an 87.2% probability that the Federal Reserve will cut interest rates by 25 basis points, with investors also pricing in two additional cuts next year. Gold is further supported by continued demand from China: the country's central bank has increased its gold reserves for 13 consecutive months.

          XAUUSD technical analysis

          XAUUSD quotes continue to attempt to rise within an ascending price channel. Despite the slowdown in upward movement and the formation of a Triangle pattern, buying pressure remains dominant, as evidenced by the price holding above the EMA-65.

          The XAUUSD forecast for 8 December 2025 suggests the bearish correction is nearing completion, followed by renewed growth towards 4,365 USD. An additional bullish signal comes from the Stochastic Oscillator, with the signal lines bouncing off the support level and approaching oversold territory.

          A consolidation above 4,290 USD will serve as key confirmation of the end of consolidation and the formation of a bullish impulse within the Triangle pattern.

          Summary

          XAUUSD prices retain strong upside potential amid expectations of Fed rate cuts and stable gold demand from China. Today's XAUUSD analysis indicates continued bullish sentiment, and a breakout above 4,290 USD will open the way towards the next target at 4,365 USD.

          EURUSD 2026-2027 forecast: key market trends and future predictions

          This article provides the EURUSD forecast for 2026 and 2027 and highlights the main factors determining the direction of the pair's movements. We will apply technical analysis, take into account the opinions of leading experts, large banks, and financial institutions, and study AI-based forecasts. This comprehensive insight into EURUSD predictions should help investors and traders make informed decisions.

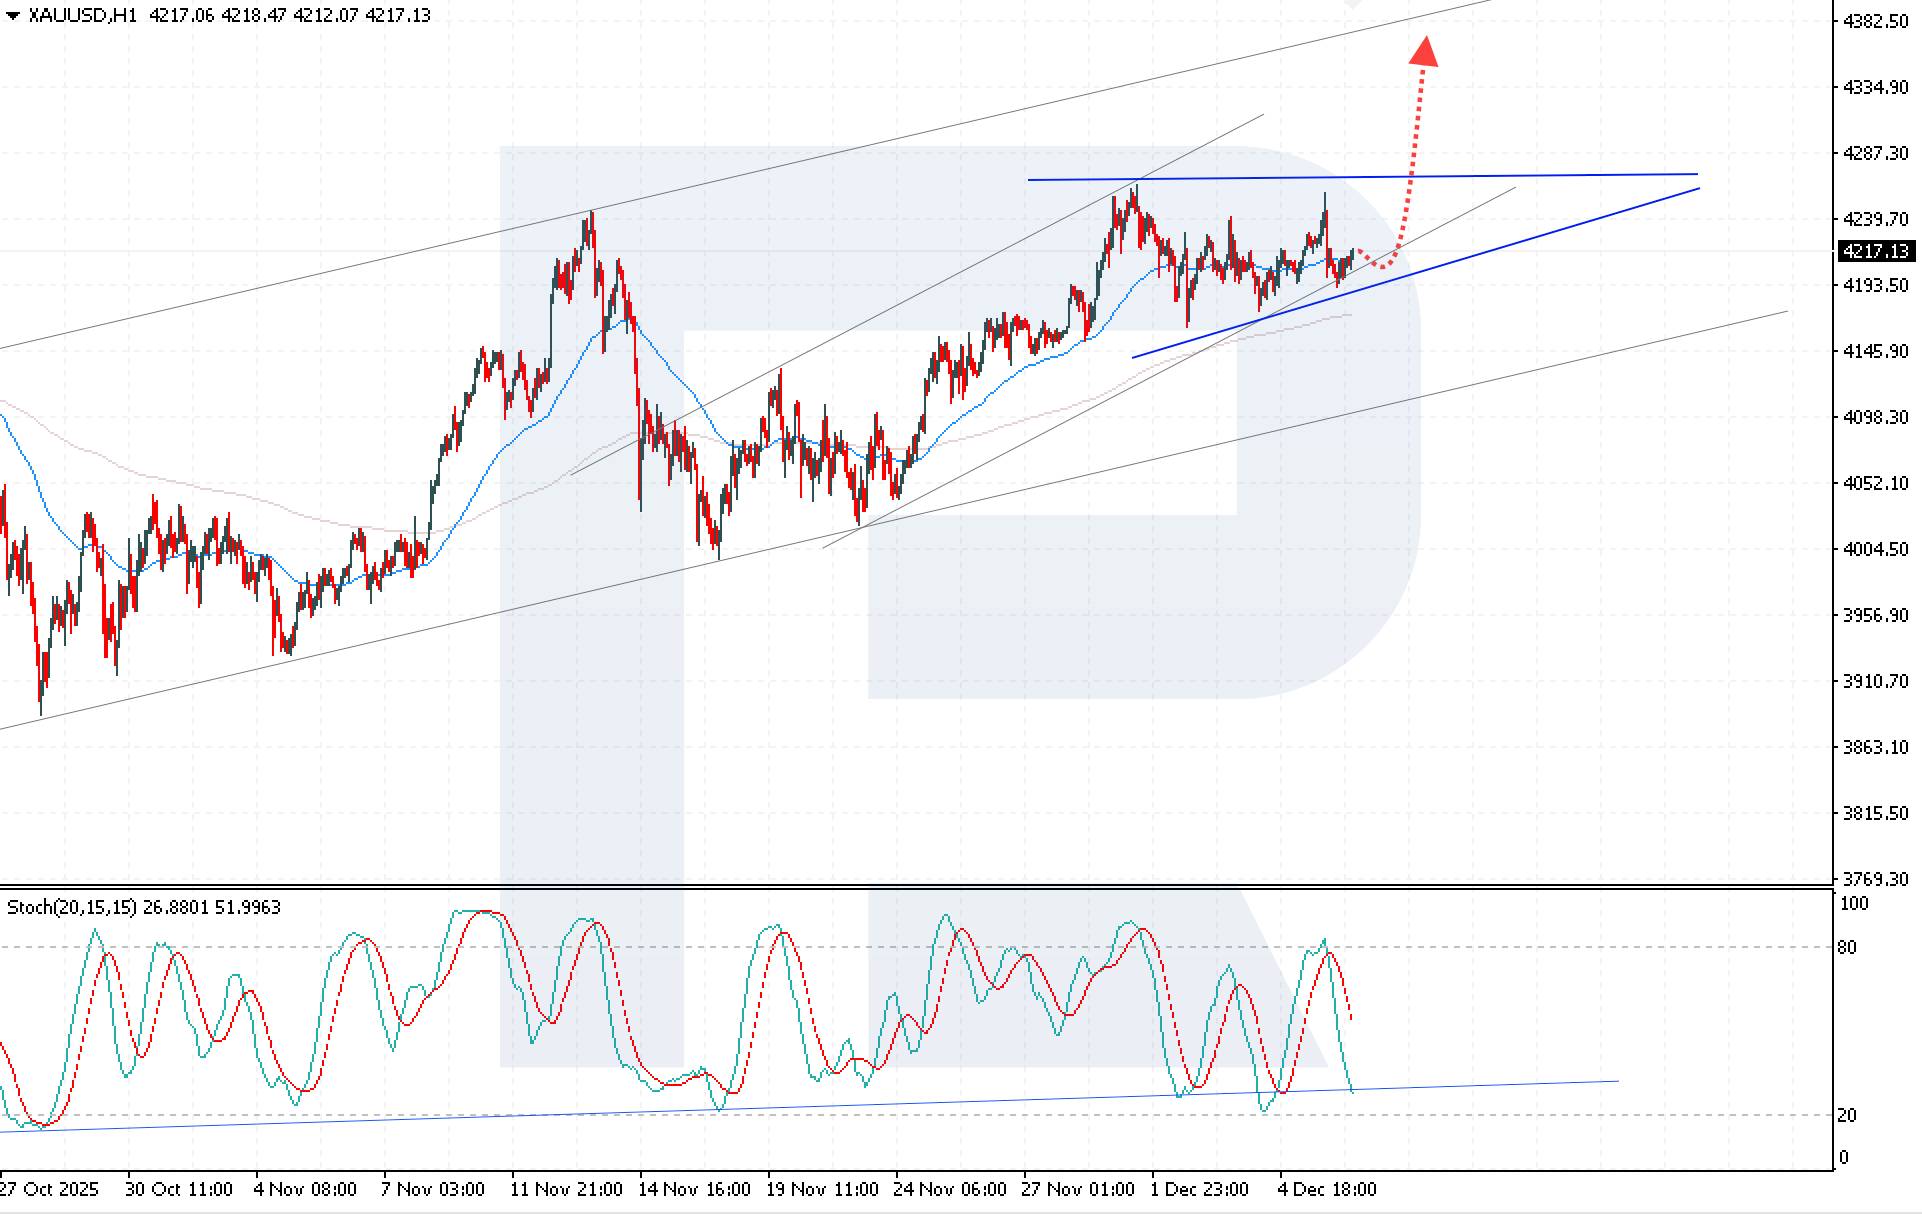
          Gold (XAUUSD) forecast 2026 and beyond: expert insights, price predictions, and analysis

          Dive deep into the Gold (XAUUSD) price outlook for 2026 and beyond, combining technical analysis, expert forecasts, and key macroeconomic factors. It explains the drivers behind gold's recent surge, explores potential scenarios including a move toward 4,500 to 5,000 USD per ounce, and highlights why the metal remains a strong hedge during global uncertainty.

          Source: RoboForex

          Risk Warnings and Disclaimers
          You understand and acknowledge that there is a high degree of risk involved in trading. Following any strategies or investment methods may lead to potential losses. The content on the site is provided by our contributors and analysts for information purposes only. You are solely responsible for determining whether any trading assets, securities, strategy, or any other product is suitable for investing based on your own investment objectives and financial situation.
          Add to Favorites
          Share

          The Cut Is Certain – The Outlook Isn’t

          Swissquote

          Forex

          Political

          Economic

          Central Bank

          Last week was full of uncertainties and mixed signals, but US indices ultimately ended in the green after the PCE report — the Fed's preferred inflation gauge — confirmed that inflation remains elevated, near 3%, well above the 2% target, but broadly stable.

          Core PCE even eased slightly to 2.8% from 2.9%. More importantly for sentiment, both the 1-year and 5-year Michigan inflation expectations fell. December's survey showed a modest improvement in consumer sentiment — likely helped by the holiday season — but current conditions deteriorated. The softening in recent economic data explains why inflation expectations are easing: the weaker the labour market, the more cautious households become, and the slower price pressures build. That's not good news for Main Street — but it is good news for Wall Street, where investors are eager for rate cuts as long as corporate earnings hold up.

          The good news for them is that a 25bp Fed cut on Wednesday is essentially locked in. The recent weakness in employment data and a stable, up-to-date PCE print support that decision.

          But what happens next is the part no one agrees on. The FOMC is divided. Some members worry that tariff-driven inflation could offset disinflationary forces and argue for caution — versus those pushing for quicker cuts, in line with political pressures and public preference. The base case is that politics will dominate and that rates will continue to move lower as the committee rotates toward members more aligned with the incoming administration's views, starting with a new Federal Reserve (Fed) Chair.

          But here is the risk: if the Fed delivers politically driven cuts without economic justification, markets could push back and long-term yields could rise.

          Elsewhere, the Reserve Bank of Australia (RBA), the Bank of Canada (BoC) and the Swiss National Bank (SNB) are all expected to keep rates unchanged. In Japan, today's weak GDP print raised some doubts among Bank of Japan (BoJ) hawks, but 10-year yield continues to climb — now around 1.96% — as wage growth accelerates and keeps inflation concerns alive. The BoJ still looks likely to hike next week.

          Meanwhile, tensions between China and Japan are rising, boosting Japanese defence stocks, with Mitsubishi and Kawasaki Heavy Industries each up between 2-3% this morning. Chinese equities, by contrast, are gaining on strong trade data showing a robust jump in exports last month as firms rushed to move inventory ahead of the latest tariff truce with the US.

          Oil is also firmer: WTI broke above its 50-day moving average last Friday and closed the week above it, suggesting that further upside is possible, supported by a softer US dollar — which, in theory, should help EM demand — and ongoing AI-related energy needs.

          AI earnings: two major AI-linked names report earnings this week. Let's start with the simpler one: Broadcom, reporting Thursday. Expectations are constructive. Broadcom continues to benefit from Google's accelerating deployment of TPUs — for internal use and for Google Cloud customers. Broadcom is one of Google's key partners in producing these chips, handling physical design and components for the latest TPU generations. Rising TPU demand therefore translates into meaningful revenue for Broadcom. The company also recently expanded its client base, including chip supply for Meta. Altogether, the stock remains — for now — relatively resilient to the broader AI-sector volatility.

          Oracle, however, is more complicated. The company is now treated as a bellwether of AI-related balance-sheet RISK: it has taken on significant debt to fund its AI and cloud expansion, and carries a lower credit rating than its Big Tech peers. Its 5-year CDS widened sharply last week to a 16-month high.

          Analysts expect Oracle to report roughly $16.2bn in revenue and $1.63 EPS. Those figures look solid at first glance but current estimates imply about 9–10% revenue growth and 11–12% EPS growth versus last year. That signals that Wall Street is no longer expecting blowout numbers, but rather a steadier, more incremental climb as Oracle converts its large AI-cloud backlog into realised revenue. Expectations are low — the good news. The bad news is that investors will scrutinise margins and capital efficiency.

          Oracle's massive cloud and AI build-out has required equally massive spending. Capex has surged as the company races to expand data-centre capacity, putting pressure on margins just as scrutiny intensifies. At the same time, Oracle's elevated debt load remains one of the largest in Big Tech, and the recent CDS widening shows that credit markets are increasingly sensitive to how much leverage is being used to finance its AI push.

          Source: Swissquote Bank SA

          To stay updated on all economic events of today, please check out our Economic calendar
          Risk Warnings and Disclaimers
          You understand and acknowledge that there is a high degree of risk involved in trading. Following any strategies or investment methods may lead to potential losses. The content on the site is provided by our contributors and analysts for information purposes only. You are solely responsible for determining whether any trading assets, securities, strategy, or any other product is suitable for investing based on your own investment objectives and financial situation.
          Add to Favorites
          Share

          German Industrial Production Jumps, Supporting Economic Rebound

          Olivia Brooks

          Economic

          German industrial production rose much more than anticipated, supporting assumptions that the economy will return to growth in the final quarter of 2025.

          Output increased 1.8% from the previous month in October, up from a revised 1.1% in September, Destatis said in a statement. That surpassed analyst estimates for a 0.3% gain.

          The advance was driven by construction, machinery and electronics products, though output in the car industry fell, the statistics agency said.

          Europe's largest economy was boosted by trade at the start of the year as companies rushed to avoid US tariffs. A reversal of that effect weighed on output in the following months, almost tipping the country into another recession.

          Germany may see slight growth in the fourth quarter as exports and the manufacturing sector in general "stabilize," the Bundesbank said last month. A significant pickup is forecast next year thanks to government spending on infrastructure on defense.

          Factory orders also rose in October, driven by large-scale orders — in particular a 87% jump in the transport category that includes aircraft, ships, trains and military vehicles, data Friday showed.

          Industrial firms have still rung the alarm due to their worsening competitive position. The influential BDI business lobby said last week that every month without effective structural reforms will cost more jobs and prosperity.

          Surveys by S&P Global last month confirmed the important manufacturing sector still faces significant challenges, with an activity index falling to a nine-month low. Firms have frequently complained about excessive red tape, high labor costs and growing competition from China.

          Source: Bloomberg Europe

          To stay updated on all economic events of today, please check out our Economic calendar
          Risk Warnings and Disclaimers
          You understand and acknowledge that there is a high degree of risk involved in trading. Following any strategies or investment methods may lead to potential losses. The content on the site is provided by our contributors and analysts for information purposes only. You are solely responsible for determining whether any trading assets, securities, strategy, or any other product is suitable for investing based on your own investment objectives and financial situation.
          Add to Favorites
          Share

          China’s Chip IPO Frenzy Heats Up as Moore Threads Ignites Retail Investor Mania

          Gerik

          Economic

          Moore Threads’ Breakout Debut Fuels Semiconductor IPO Rush

          China’s domestic chip industry is experiencing a dramatic surge in investor enthusiasm, as evidenced by overwhelming retail participation in two upcoming semiconductor IPOs. Following Moore Threads Technology Co.’s sensational 425% surge on its trading debut last Friday, retail investors poured into offerings from MetaX Integrated Circuits Shanghai Co. and Beijing Onmicro Electronics Co., resulting in subscription rates of 2,986 and 2,899 times, respectively. These figures reflect an extraordinary level of retail optimism tied closely to China’s broader push to cultivate a self-reliant semiconductor ecosystem.
          Moore Threads’ market debut acted as a key trigger, with investors interpreting its skyrocketing price performance as both a vote of confidence in Chinese chipmaking capability and a sign of strong upside potential for similar firms. Prior to listing, Moore Threads’ own IPO was oversubscribed by around 2,750 times, already signaling the level of anticipation building within retail segments. The post-listing 425% spike further validated the bullish narrative, amplifying sentiment around peers like MetaX and Onmicro.
          The causal relationship here is direct: Moore Threads’ successful market entry significantly influenced demand for subsequent IPOs, creating a cascading effect of investor enthusiasm across the sector. The timing of the MetaX and Onmicro subscription windows both coinciding with Moore’s debut reinforces the momentum-driven nature of these investments.

          Policy Support and Regulatory Constraints Shape Market Dynamics

          This fervent activity is not occurring in a vacuum. Beijing’s policy directive to achieve technological independence, especially in semiconductors, has positioned domestic chipmakers as strategic national assets. Companies like Moore Threads, MetaX, and Onmicro are seen as key participants in this mission, particularly as Western export controls tighten access to advanced chips and manufacturing tools.
          Furthermore, China’s IPO market is tightly regulated, with authorities limiting the number of new listings to avoid draining secondary market liquidity. This regulatory bottleneck creates scarcity, which in turn enhances the perceived value of each approved offering. Consequently, investors are driven to aggressively pursue the limited opportunities available, especially in high-profile sectors like AI and semiconductor manufacturing.
          Additionally, a recent downturn in China’s secondary market has led investors to seek returns from primary market opportunities, including IPOs. With risk appetite subdued elsewhere, the IPO channel is emerging as a focal point for capital deployment among retail participants.

          MetaX Aims for Massive Raise Amid High Valuation

          Founded in 2020, MetaX is preparing to raise approximately $585.8 million through its Shanghai debut. The company specializes in graphics processing unit (GPU) chips, operating in a space increasingly critical to AI and data-intensive applications. At an offer price of 104.66 yuan per share, MetaX is set to trade at a price-to-sales ratio of 56.4 times, which, while high, is still significantly below the peer average of 127.4 times projected for 2024. This discount has added to the appeal for investors who see Moore Threads’ success as a benchmark.
          This valuation gap may represent both an opportunity and a risk. On one hand, MetaX is entering the market with relative affordability compared to its peers, which could support a strong first-day performance. On the other, it reflects investor caution about the company’s ability to match Moore Threads’ scale, speed of innovation, or policy alignment in the short term.
          The extraordinary demand for MetaX and Onmicro IPOs underscores a new wave of retail investor confidence in China’s semiconductor sector, driven by Moore Threads’ breakout success and the country’s aggressive drive for technological autonomy. With a tight regulatory environment and heightened geopolitical stakes, Chinese chipmakers are positioned as both financial opportunities and strategic symbols. However, the sector’s sustainability will depend on more than investor sentiment; it must be underpinned by real innovation, competitive performance, and policy clarity as China continues to reshape its role in the global tech supply chain.

          Source: Bloomberg

          To stay updated on all economic events of today, please check out our Economic calendar
          Risk Warnings and Disclaimers
          You understand and acknowledge that there is a high degree of risk involved in trading. Following any strategies or investment methods may lead to potential losses. The content on the site is provided by our contributors and analysts for information purposes only. You are solely responsible for determining whether any trading assets, securities, strategy, or any other product is suitable for investing based on your own investment objectives and financial situation.
          Add to Favorites
          Share

          EUR/USD Holds Firm At Support, Raising Odds Of Additional Gains

          Blue River

          Forex

          Economic

          Technical Analysis

          Key Highlights

          EUR/USD gained pace for a move above the 1.1620 resistance.
          A key bullish trend line is forming with support at 1.1630 on the 4-hour chart.
          GBP/USD started consolidating gains above 1.3300.
          USD/JPY might start a fresh increase if it clears the 156.00 resistance.

          EUR/USD Technical Analysis

          The Euro started a decent increase above 1.1550 against the US Dollar. EUR/USD cleared the key barrier at 1.1600 to enter a positive zone.

          Looking at the 4-hour chart, the pair gained pace for a move above 1.1620. It traded as high as 1.1681 and settled above the 100 simple moving average (red, 4-hour) and the 200 simple moving average (green, 4-hour).

          It is now consolidating gains above 1.1620. There is also a key bullish trend line forming with support at 1.1630. Immediate resistance sits near 1.1660. The first key hurdle is seen near 1.1680.

          A close above 1.1680 could open the doors for a move toward 1.1725. Any more gains could set the pace for a steady increase toward 1.1780.

          On the downside, there is key support at 1.1630 and the trend line at 1.1620. The next support is 1.1580 and the 100 simple moving average (red, 4-hour). A close below the 100 simple moving average (red, 4-hour) could spark a bearish move and send the pair to 1.1510. Any more losses might call for a test of 1.1465.

          Looking at GBP/USD, the pair rallied above 1.3300 and recently started a consolidation phase. The main support sits at 1.3260.

          Source: ACTIONFOREX

          To stay updated on all economic events of today, please check out our Economic calendar
          Risk Warnings and Disclaimers
          You understand and acknowledge that there is a high degree of risk involved in trading. Following any strategies or investment methods may lead to potential losses. The content on the site is provided by our contributors and analysts for information purposes only. You are solely responsible for determining whether any trading assets, securities, strategy, or any other product is suitable for investing based on your own investment objectives and financial situation.
          Add to Favorites
          Share
          FastBull
          Copyright © 2025 FastBull Ltd

          728 RM B 7/F GEE LOK IND BLDG NO 34 HUNG TO RD KWUN TONG KLN HONG KONG

          TelegramInstagramTwitterfacebooklinkedin
          App Store Google Play Google Play
          Products
          Charts

          Chats

          Q&A with Experts
          Screeners
          Economic Calendar
          Data
          Tools
          Membership
          Features
          Function
          Markets
          Copy Trading
          Latest Signals
          Contests
          News
          Analysis
          24/7
          Columns
          Education
          Company
          Careers
          About Us
          Contact Us
          Advertising
          Help Center
          Feedback
          User Agreement
          Privacy Policy
          Business

          White Label

          Data API

          Web Plug-ins

          Poster Maker

          Affiliate Program

          Risk Disclosure

          The risk of loss in trading financial instruments such as stocks, FX, commodities, futures, bonds, ETFs and crypto can be substantial. You may sustain a total loss of the funds that you deposit with your broker. Therefore, you should carefully consider whether such trading is suitable for you in light of your circumstances and financial resources.

          No decision to invest should be made without thoroughly conducting due diligence by yourself or consulting with your financial advisors. Our web content might not suit you since we don't know your financial conditions and investment needs. Our financial information might have latency or contain inaccuracy, so you should be fully responsible for any of your trading and investment decisions. The company will not be responsible for your capital loss.

          Without getting permission from the website, you are not allowed to copy the website's graphics, texts, or trademarks. Intellectual property rights in the content or data incorporated into this website belong to its providers and exchange merchants.

          Not Logged In

          Log in to access more features

          FastBull Membership

          Not yet

          Purchase

          Become a signal provider
          Help Center
          Customer Service
          Dark Mode
          Price Up/Down Colors

          Log In

          Sign Up

          Position
          Layout
          Fullscreen
          Default to Chart
          The chart page opens by default when you visit fastbull.com