

Markets
News
Analysis
User
24/7
Economic Calendar
Education
Data
- Names
- Latest
- Prev


Signal Accounts for Members
All Signal Accounts
All Contests
 U.S. Dallas Fed New Orders Index (Jan)
A:--
F: --
P: --
U.S. 2-Year Note Auction Avg. YieldA:--
F: --
P: --
 U.K. BRC Shop Price Index YoY (Jan)
A:--
F: --
P: --
 China, Mainland Industrial Profit YoY (YTD) (Dec)
A:--
F: --
P: --
 Germany 2-Year Schatz Auction Avg. Yield
A:--
F: --
P: --
 Mexico Trade Balance (Dec)
A:--
F: --
P: --
U.S. Weekly Redbook Index YoYA:--
F: --
P: --
U.S. S&P/CS 20-City Home Price Index YoY (Not SA) (Nov)A:--
F: --
P: --
U.S. S&P/CS 20-City Home Price Index MoM (SA) (Nov)A:--
F: --
U.S. FHFA House Price Index MoM (Nov)A:--
F: --
P: --
U.S. FHFA House Price Index (Nov)A:--
F: --
P: --
U.S. FHFA House Price Index YoY (Nov)A:--
F: --
U.S. S&P/CS 10-City Home Price Index YoY (Nov)A:--
F: --
P: --
U.S. S&P/CS 10-City Home Price Index MoM (Not SA) (Nov)A:--
F: --
P: --
U.S. S&P/CS 20-City Home Price Index (Not SA) (Nov)A:--
F: --
P: --
U.S. S&P/CS 20-City Home Price Index MoM (Not SA) (Nov)A:--
F: --
P: --
U.S. Richmond Fed Manufacturing Composite Index (Jan)A:--
F: --
P: --
U.S. Conference Board Present Situation Index (Jan)A:--
F: --
P: --
U.S. Conference Board Consumer Expectations Index (Jan)A:--
F: --
P: --
U.S. Richmond Fed Manufacturing Shipments Index (Jan)A:--
F: --
P: --
U.S. Richmond Fed Services Revenue Index (Jan)A:--
F: --
P: --
U.S. Conference Board Consumer Confidence Index (Jan)A:--
F: --
U.S. 5-Year Note Auction Avg. YieldA:--
F: --
P: --
U.S. API Weekly Refined Oil StocksA:--
F: --
P: --
U.S. API Weekly Crude Oil StocksA:--
F: --
P: --
U.S. API Weekly Gasoline StocksA:--
F: --
P: --
U.S. API Weekly Cushing Crude Oil StocksA:--
F: --
P: --
 Australia RBA Trimmed Mean CPI YoY (Q4)
A:--
F: --
P: --
Australia CPI YoY (Q4)A:--
F: --
P: --
Australia CPI QoQ (Q4)A:--
F: --
P: --
Germany GfK Consumer Confidence Index (SA) (Feb)--
F: --
P: --
Germany 10-Year Bund Auction Avg. Yield--
F: --
P: --
 India Industrial Production Index YoY (Dec)
--
F: --
P: --
India Manufacturing Output MoM (Dec)--
F: --
P: --
U.S. MBA Mortgage Application Activity Index WoW--
F: --
P: --
 Canada Overnight Target Rate
--
F: --
P: --
BOC Monetary Policy Report U.S. EIA Weekly Crude Stocks Change--
F: --
P: --
U.S. EIA Weekly Cushing, Oklahoma Crude Oil Stocks Change--
F: --
P: --
U.S. EIA Weekly Crude Demand Projected by Production--
F: --
P: --
U.S. EIA Weekly Crude Oil Imports Changes--
F: --
P: --
U.S. EIA Weekly Heating Oil Stock Changes--
F: --
P: --
U.S. EIA Weekly Gasoline Stocks Change--
F: --
P: --
BOC Press Conference Russia PPI MoM (Dec)
--
F: --
P: --
Russia PPI YoY (Dec)--
F: --
P: --
U.S. Target Federal Funds Rate Lower Limit (Overnight Reverse Repo Rate)--
F: --
P: --
U.S. Interest Rate On Reserve Balances--
F: --
P: --
U.S. Federal Funds Rate Target--
F: --
P: --
U.S. Target Federal Funds Rate Upper Limit (Excess Reserves Ratio)--
F: --
P: --
FOMC Statement FOMC Press Conference Brazil Selic Interest Rate
--
F: --
P: --
Australia Import Price Index YoY (Q4)--
F: --
P: --
 Japan Household Consumer Confidence Index (Jan)
--
F: --
P: --
 Turkey Economic Sentiment Indicator (Jan)
--
F: --
P: --
 Euro Zone M3 Money Supply (SA) (Dec)
--
F: --
P: --
Euro Zone Private Sector Credit YoY (Dec)--
F: --
P: --
Euro Zone M3 Money Supply YoY (Dec)--
F: --
P: --
Euro Zone 3-Month M3 Money Supply YoY (Dec)--
F: --
P: --
 South Africa PPI YoY (Dec)
--
F: --
P: --


No matching data
Latest Views
Latest Views
Trending Topics
Top Columnists
Latest Update
White Label
Data API
Web Plug-ins
Affiliate Program
View All
No data
Only a portion of natural capital’s value to the economy is priced into markets today. But we expect asset prices will adjust to better reflect both the risks and opportunities linked to natural capital – a trend we are already starting to see.


Wholesale inflation cooled more than expected last month. Here is the latest news release from the Bureau of Labor Statistics.
The producer price index for final demand increased 0.1% month-over-month (s.a.), less than the expected 0.2% growth. On a non-seasonally adjusted annual basis, headline PPI decelerated from 2.7% in June to 2.2% in July, coming in below the expected 2.3% growth.
Core PPI (excluding food and energy) for final demand was flat last month, less than the expected 0.2% growth. On a non-seasonally adjusted annual basis, core PPI decelerated from 3.0% year-over-year in June to 2.4% in July, coming in below the expected 2.7% growth.
Below is a chart of the historical series with a callout to the most recent 12 months.
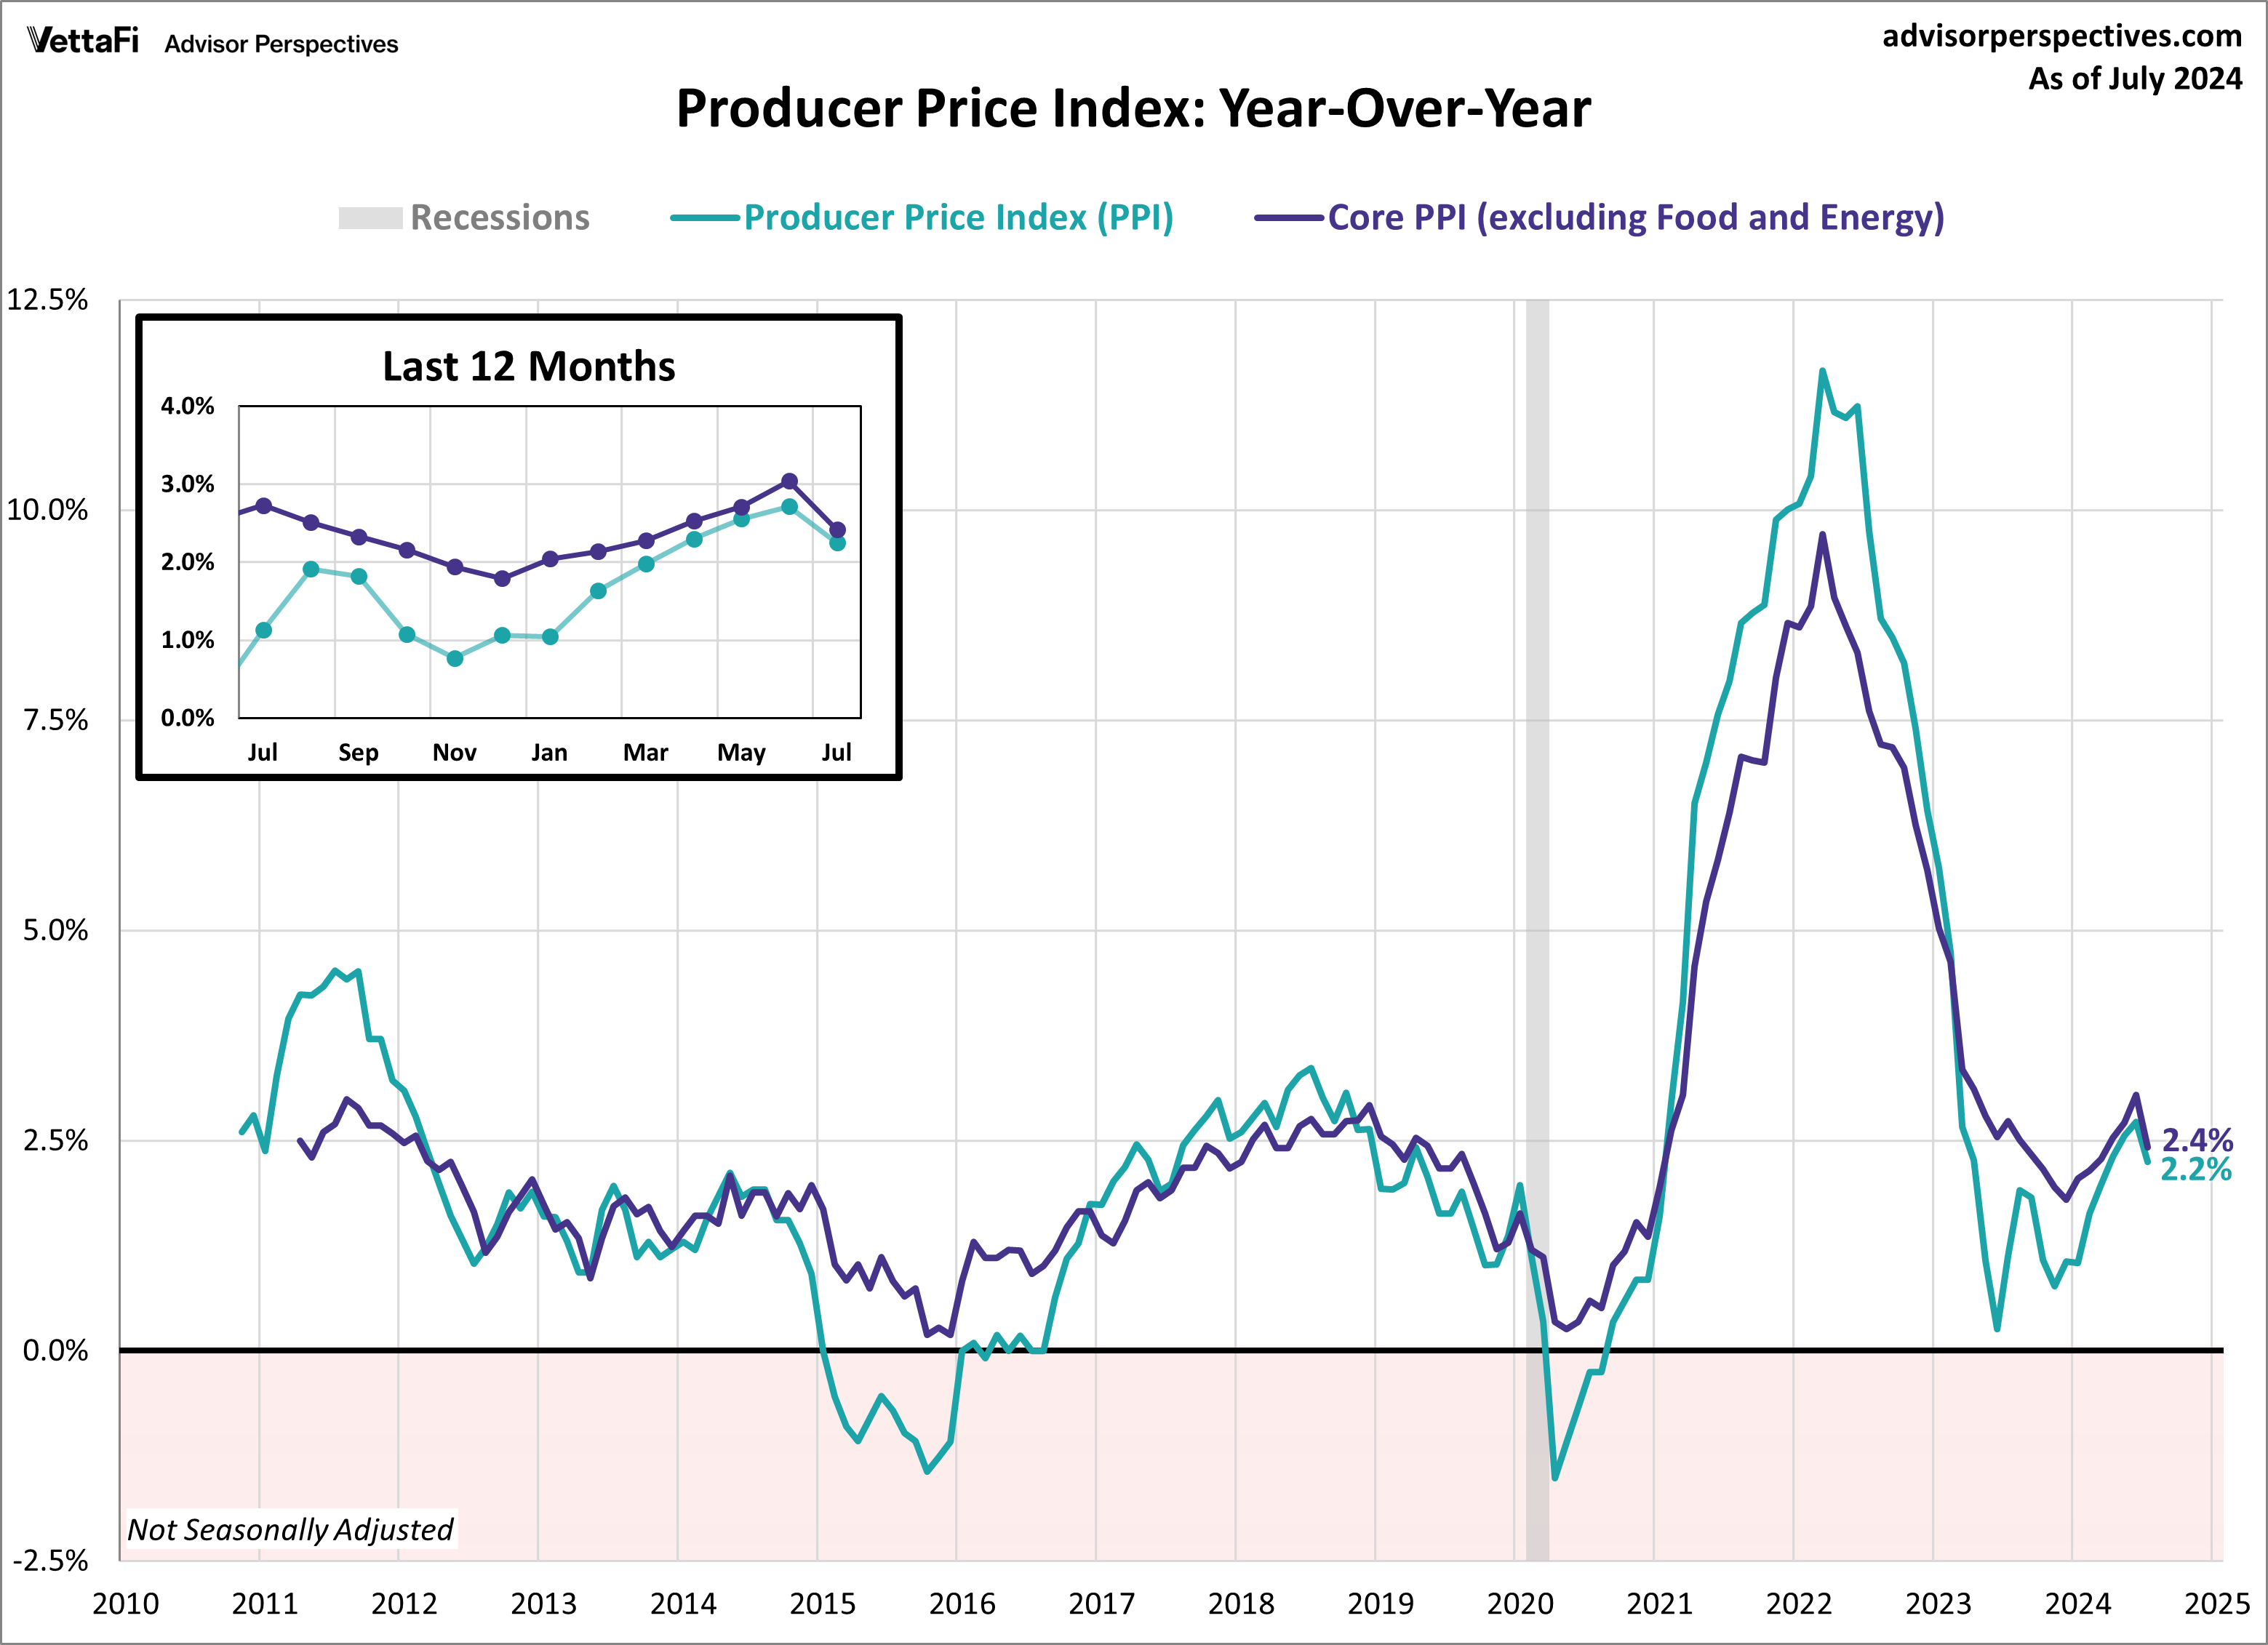
The BLS shifted its focus to its new "final demand" series in 2014, a shift I support. However, the data for these series are only constructed back to November 2009 for headline and April 2010 for core.
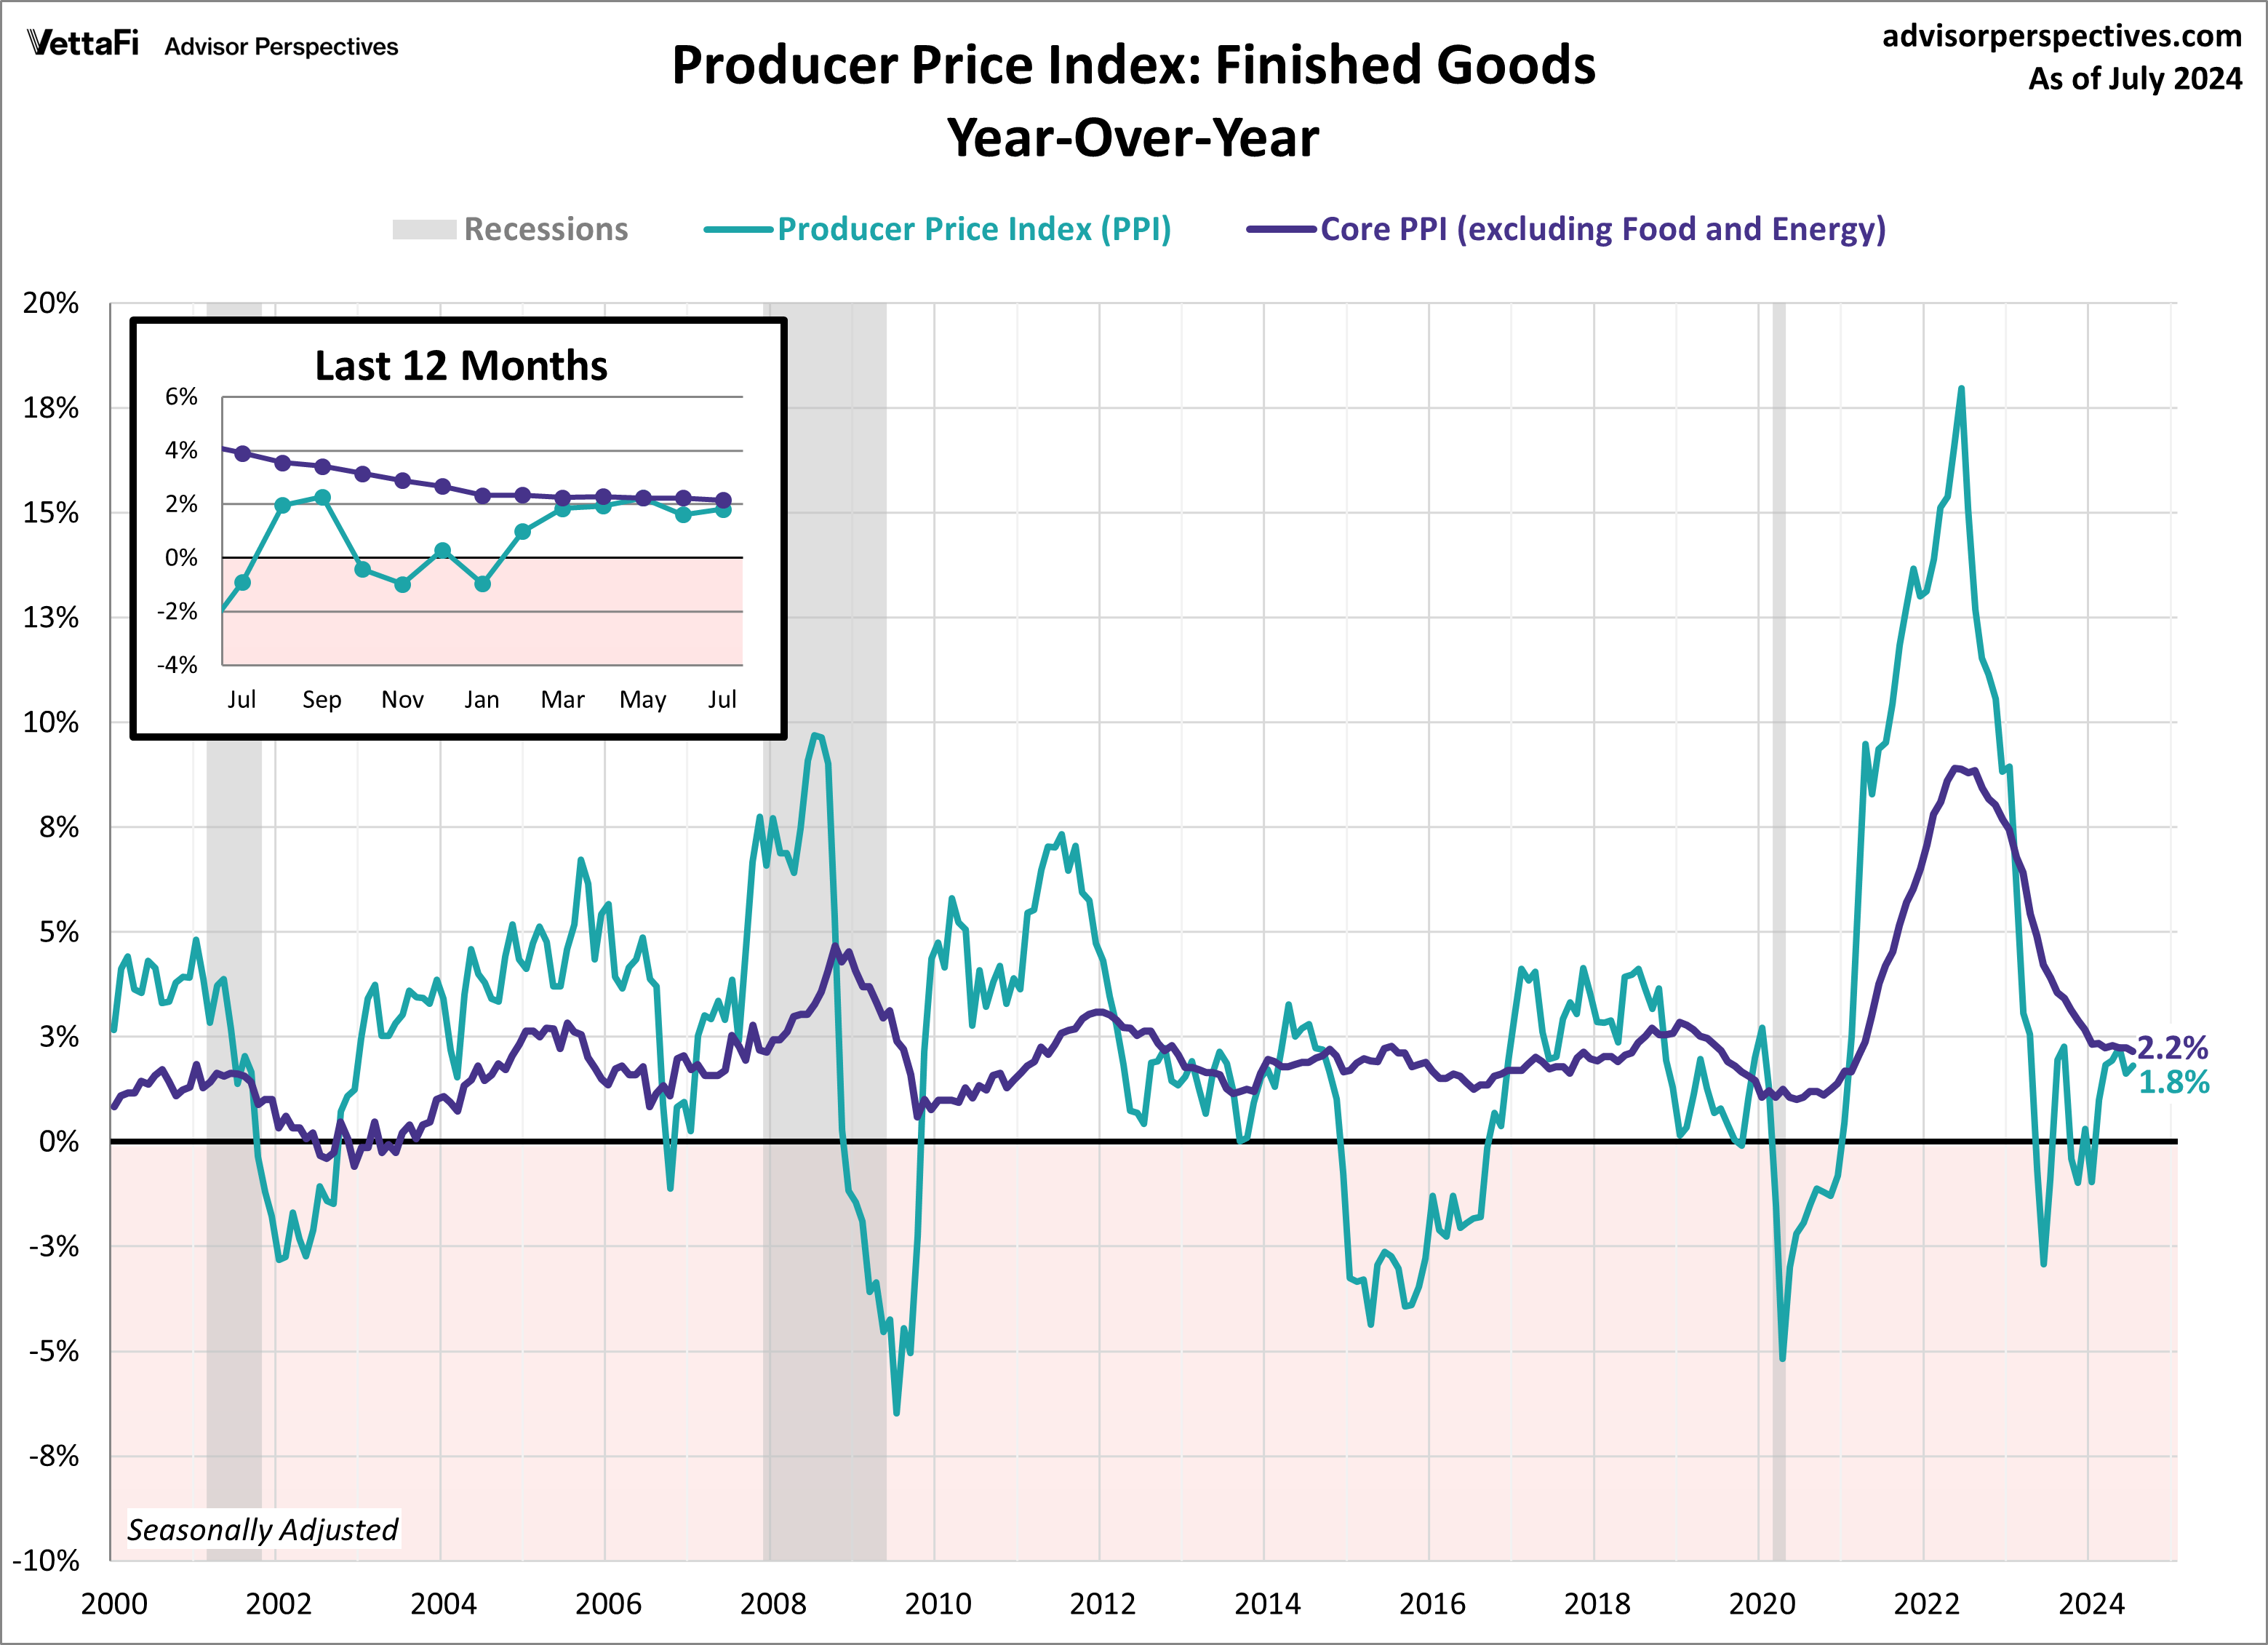
Since our focus is on longer-term trends, we continue to track the legacy PPI for finished goods, which the BLS also includes in its monthly updates. We will see in a later overlay chart that the final demand and finished goods indexes are highly correlated.
The July PPI for finished goods rose 0.5% month-over-month seasonally adjusted, up from the previous month's 0.4% decline. On an annual basis, headline PPI for finished goods is currently at 1.8% year-over-year, up from 1.6% the previous month (seasonally adjusted).
Core PPI for finished goods rose 0.1% month-over-month, unchanged from the previous month. On an annual basis, core PPI for finished goods is currently at 2.2% year-over-year, unchanged from the previous month (seasonally adjusted).
Both PPI and CPI illustrate monthly price changes, however, as their names suggest, the Producer Price Index measures price changes from the producer perspective whereas the Consumer Price Index measures price changes from the consumer perspective.
PPI is thought to be a leading indicator of consumer inflation because, for the most part, when producers pay more for goods and services they are likely to pass along those higher costs to the consumer. With that being said, during the last recession producers were unable to pass along price increases, demonstrating the higher volatility of core PPI than core CPI.
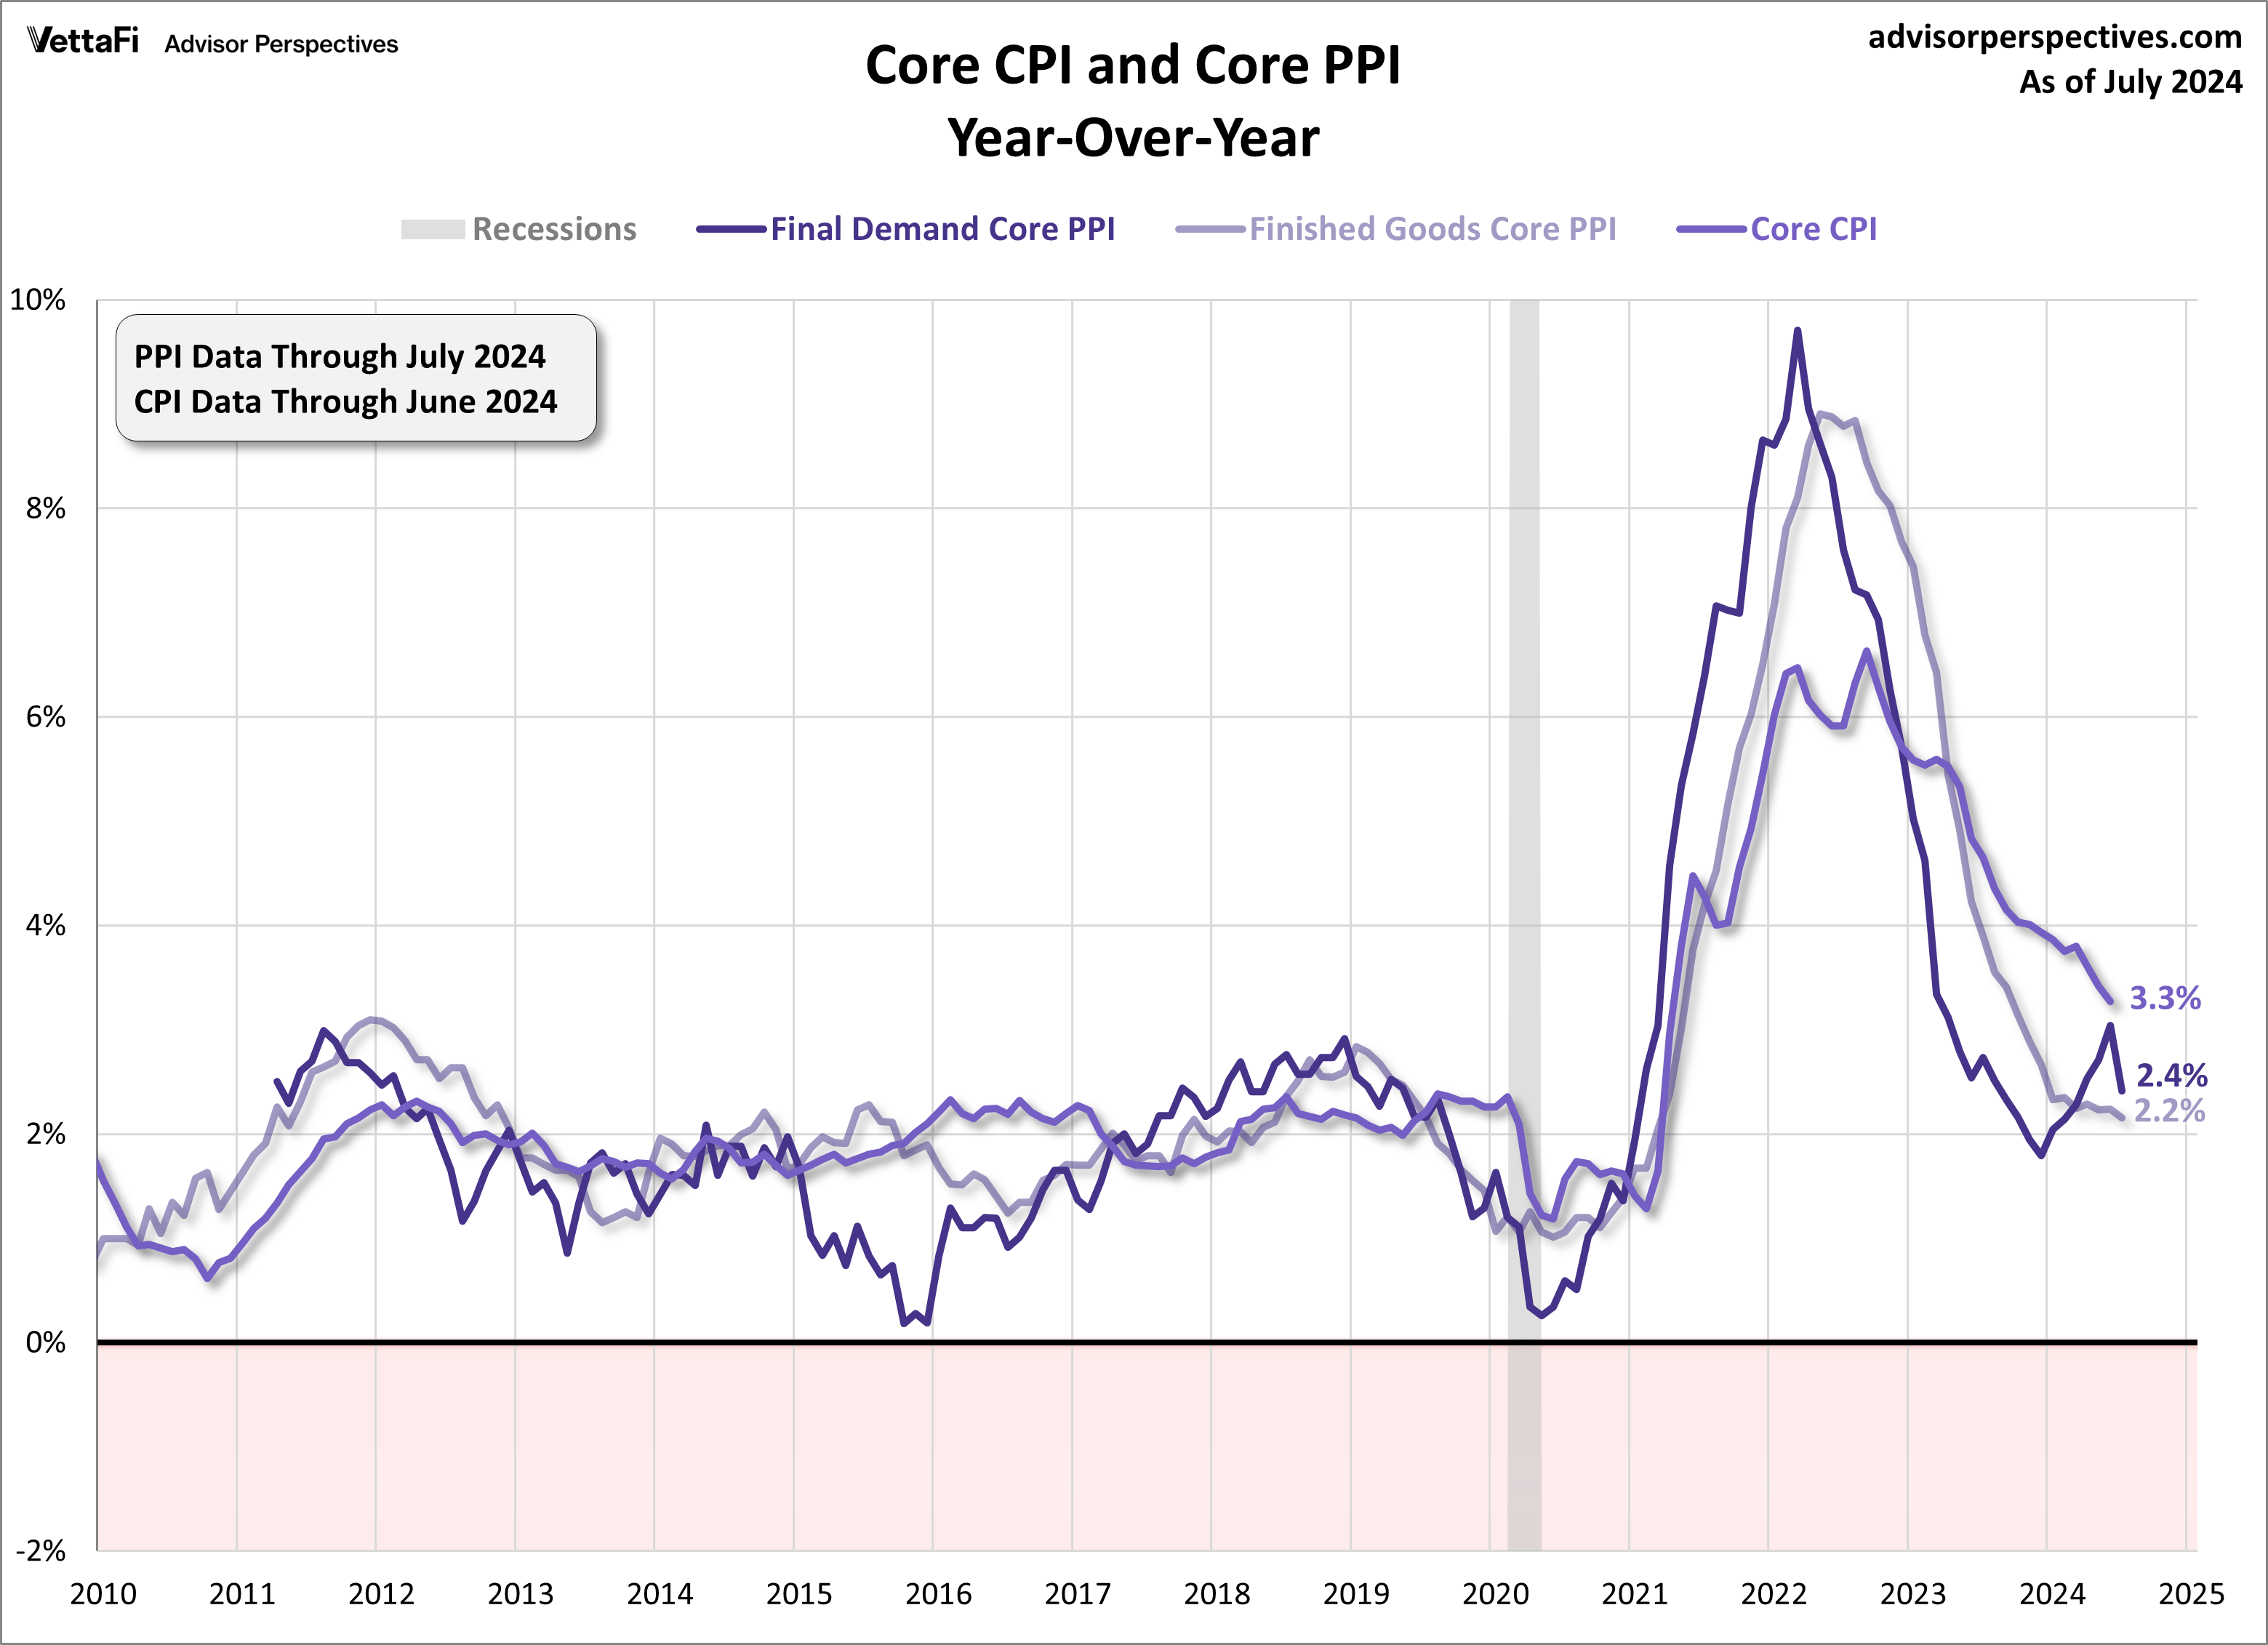
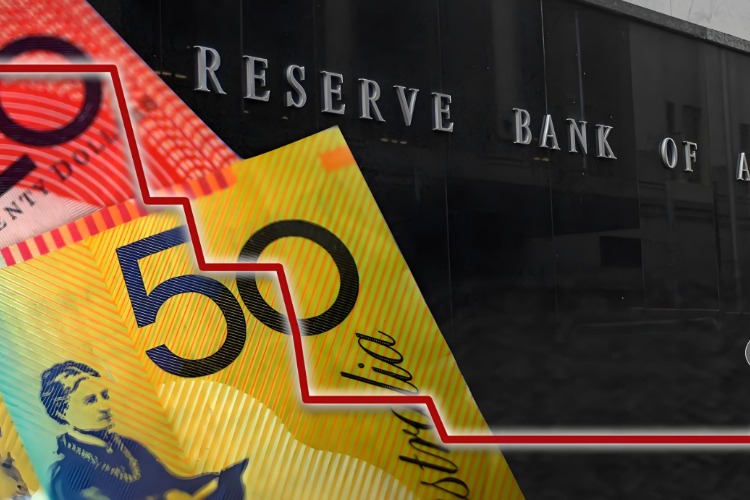
The Fed has been in a tightening cycle to tackle high inflation, among other things. Inflation has eased over the few years, but the threat of a resurgence hangs in the air. On the other hand, the threat of disinflation has started to emerge. Thus, a few big questions remain: "When will the Fed begin to cut rates?", "Has the Fed waited too long to begin to cut rates?" and "Will there be a recession?"

 BTC/USD vs. XAU/USD chart. Source: William Clemente/X
728 RM B 7/F GEE LOK IND BLDG NO 34 HUNG TO RD KWUN TONG KLN HONG KONG


White Label
Data API
Web Plug-ins
Poster Maker
Affiliate Program
The risk of loss in trading financial instruments such as stocks, FX, commodities, futures, bonds, ETFs and crypto can be substantial. You may sustain a total loss of the funds that you deposit with your broker. Therefore, you should carefully consider whether such trading is suitable for you in light of your circumstances and financial resources.
No decision to invest should be made without thoroughly conducting due diligence by yourself or consulting with your financial advisors. Our web content might not suit you since we don't know your financial conditions and investment needs. Our financial information might have latency or contain inaccuracy, so you should be fully responsible for any of your trading and investment decisions. The company will not be responsible for your capital loss.
Without getting permission from the website, you are not allowed to copy the website's graphics, texts, or trademarks. Intellectual property rights in the content or data incorporated into this website belong to its providers and exchange merchants.
Not Logged In
Log in to access more features


Log In
Sign Up


