• Trade
  • Markets
  • Copy
  • Contests
  • News
  • 24/7
  • Calendar
  • Q&A
  • Chats
Trending
Screeners
SYMBOL
LAST
BID
ASK
HIGH
LOW
NET CHG.
%CHG.
SPREAD
SPX
S&P 500 Index
6857.13
6857.13
6857.13
6865.94
6827.13
+7.41
+ 0.11%
--
DJI
Dow Jones Industrial Average
47850.93
47850.93
47850.93
48049.72
47692.96
-31.96
-0.07%
--
IXIC
NASDAQ Composite Index
23505.13
23505.13
23505.13
23528.53
23372.33
+51.04
+ 0.22%
--
USDX
US Dollar Index
98.850
98.930
98.850
98.980
98.740
-0.130
-0.13%
--
EURUSD
Euro / US Dollar
1.16582
1.16590
1.16582
1.16715
1.16408
+0.00137
+ 0.12%
--
GBPUSD
Pound Sterling / US Dollar
1.33528
1.33538
1.33528
1.33622
1.33165
+0.00257
+ 0.19%
--
XAUUSD
Gold / US Dollar
4224.03
4224.37
4224.03
4230.62
4194.54
+16.86
+ 0.40%
--
WTI
Light Sweet Crude Oil
59.456
59.486
59.456
59.480
59.187
+0.073
+ 0.12%
--

Community Accounts

Signal Accounts
--
Profit Accounts
--
Loss Accounts
--
View More

Become a signal provider

Sell trading signals to earn additional income

View More

Guide to Copy Trading

Get started with ease and confidence

View More

Signal Accounts for Members

All Signal Accounts

Best Return
  • Best Return
  • Best P/L
  • Best MDD
Past 1W
  • Past 1W
  • Past 1M
  • Past 1Y

All Contests

  • All
  • Trump Updates
  • Recommend
  • Stocks
  • Cryptocurrencies
  • Central Banks
  • Featured News
Top News Only
Share

Kremlin Aide Ushakov Says USA Kushner Is Working Very Actively On Ukrainian Settlement

Share

Norway To Acquire 2 More Submarines, Long-Range Missiles, Daily Vg Reports

Share

Ucb Sa Shares Open Up 7.3% After 2025 Guidance Upgrade, Top Of Bel 20 Index

Share

Shares In Italy's Mediobanca Down 1.3% After Barclays Cuts To Underweight From Equal-Weight

Share

Stats Office - Austrian November Wholesale Prices +0.9% Year-On-Year

Share

Britain's FTSE 100 Up 0.15%

Share

Europe's STOXX 600 Up 0.1%

Share

Taiwan November PPI -2.8% Year-On-Year

Share

Stats Office - Austrian September Trade -230.8 Million EUR

Share

Swiss National Bank Forex Reserves Revised To Chf 724906 Million At End Of October - SNB

Share

Swiss National Bank Forex Reserves At Chf 727386 Million At End Of November - SNB

Share

Shanghai Warehouse Rubber Stocks Up 8.54% From Week Earlier

Share

Turkey's Main Banking Index Up 2%

Share

French October Trade Balance -3.92 Billion Euros Versus Revised -6.35 Billion Euros In September

Share

Kremlin Aide Says Russia Is Ready To Work Further With Current USA Team

Share

Kremlin Aide Says Russia And USA Are Moving Forward In Ukraine Talks

Share

Shanghai Rubber Warehouse Stocks Up 7336 Tons

Share

Shanghai Tin Warehouse Stocks Up 506 Tons

Share

Reserve Bank Of India Chief Malhotra: Goal Is To Have Inflation Be Around 4%

Share

Ukmto Says Master Has Confirmed That The Small Crafts Have Left The Scene, Vessel Is Proceeding To Its Next Port Of Call

TIME
ACT
FCST
PREV
France 10-Year OAT Auction Avg. Yield

A:--

F: --

P: --

Euro Zone Retail Sales MoM (Oct)

A:--

F: --

P: --

Euro Zone Retail Sales YoY (Oct)

A:--

F: --

P: --

Brazil GDP YoY (Q3)

A:--

F: --

P: --

U.S. Challenger Job Cuts (Nov)

A:--

F: --

P: --

U.S. Challenger Job Cuts MoM (Nov)

A:--

F: --

P: --

U.S. Challenger Job Cuts YoY (Nov)

A:--

F: --

P: --

U.S. Initial Jobless Claims 4-Week Avg. (SA)

A:--

F: --

P: --

U.S. Weekly Initial Jobless Claims (SA)

A:--

F: --

P: --

U.S. Weekly Continued Jobless Claims (SA)

A:--

F: --

P: --

Canada Ivey PMI (SA) (Nov)

A:--

F: --

P: --

Canada Ivey PMI (Not SA) (Nov)

A:--

F: --

P: --

U.S. Non-Defense Capital Durable Goods Orders Revised MoM (Excl. Aircraft) (SA) (Sept)

A:--

F: --

P: --
U.S. Factory Orders MoM (Excl. Transport) (Sept)

A:--

F: --

P: --

U.S. Factory Orders MoM (Sept)

A:--

F: --

P: --

U.S. Factory Orders MoM (Excl. Defense) (Sept)

A:--

F: --

P: --

U.S. EIA Weekly Natural Gas Stocks Change

A:--

F: --

P: --

Saudi Arabia Crude Oil Production

A:--

F: --

P: --

U.S. Weekly Treasuries Held by Foreign Central Banks

A:--

F: --

P: --

Japan Foreign Exchange Reserves (Nov)

A:--

F: --

P: --

India Repo Rate

A:--

F: --

P: --

India Benchmark Interest Rate

A:--

F: --

P: --

India Reverse Repo Rate

A:--

F: --

P: --

India Cash Reserve Ratio

A:--

F: --

P: --

Japan Leading Indicators Prelim (Oct)

A:--

F: --

P: --

U.K. Halifax House Price Index YoY (SA) (Nov)

A:--

F: --

P: --

U.K. Halifax House Price Index MoM (SA) (Nov)

A:--

F: --

P: --

France Current Account (Not SA) (Oct)

A:--

F: --

P: --

France Trade Balance (SA) (Oct)

A:--

F: --

P: --

France Industrial Output MoM (SA) (Oct)

A:--

F: --

P: --

Italy Retail Sales MoM (SA) (Oct)

--

F: --

P: --

Euro Zone Employment YoY (SA) (Q3)

--

F: --

P: --

Euro Zone GDP Final YoY (Q3)

--

F: --

P: --

Euro Zone GDP Final QoQ (Q3)

--

F: --

P: --

Euro Zone Employment Final QoQ (SA) (Q3)

--

F: --

P: --

Euro Zone Employment Final (SA) (Q3)

--

F: --

P: --
Brazil PPI MoM (Oct)

--

F: --

P: --

Mexico Consumer Confidence Index (Nov)

--

F: --

P: --

Canada Unemployment Rate (SA) (Nov)

--

F: --

P: --

Canada Labor Force Participation Rate (SA) (Nov)

--

F: --

P: --

Canada Employment (SA) (Nov)

--

F: --

P: --

Canada Part-Time Employment (SA) (Nov)

--

F: --

P: --

Canada Full-time Employment (SA) (Nov)

--

F: --

P: --

U.S. Personal Income MoM (Sept)

--

F: --

P: --

U.S. Dallas Fed PCE Price Index YoY (Sept)

--

F: --

P: --

U.S. PCE Price Index YoY (SA) (Sept)

--

F: --

P: --

U.S. PCE Price Index MoM (Sept)

--

F: --

P: --

U.S. Personal Outlays MoM (SA) (Sept)

--

F: --

P: --

U.S. Core PCE Price Index MoM (Sept)

--

F: --

P: --

U.S. UMich 5-Year-Ahead Inflation Expectations Prelim YoY (Dec)

--

F: --

P: --

U.S. Core PCE Price Index YoY (Sept)

--

F: --

P: --

U.S. Real Personal Consumption Expenditures MoM (Sept)

--

F: --

P: --

U.S. 5-10 Year-Ahead Inflation Expectations (Dec)

--

F: --

P: --

U.S. UMich Current Economic Conditions Index Prelim (Dec)

--

F: --

P: --

U.S. UMich Consumer Sentiment Index Prelim (Dec)

--

F: --

P: --

U.S. UMich 1-Year-Ahead Inflation Expectations Prelim (Dec)

--

F: --

P: --

U.S. UMich Consumer Expectations Index Prelim (Dec)

--

F: --

P: --

U.S. Weekly Total Rig Count

--

F: --

P: --

U.S. Weekly Total Oil Rig Count

--

F: --

P: --

U.S. Consumer Credit (SA) (Oct)

--

F: --

P: --

Q&A with Experts
    • All
    • Chatrooms
    • Groups
    • Friends
    Connecting
    .
    .
    .
    Type here...
    Add Symbol or Code

      No matching data

      All
      Trump Updates
      Recommend
      Stocks
      Cryptocurrencies
      Central Banks
      Featured News
      • All
      • Russia-Ukraine Conflict
      • Middle East Flashpoint
      • All
      • Russia-Ukraine Conflict
      • Middle East Flashpoint

      Search
      Products

      Charts Free Forever

      Chats Q&A with Experts
      Screeners Economic Calendar Data Tools
      Membership Features
      Data Warehouse Market Trends Institutional Data Policy Rates Macro

      Market Trends

      Market Sentiment Order Book Forex Correlations

      Top Indicators

      Charts Free Forever
      Markets

      News

      News Analysis 24/7 Columns Education
      From Institutions From Analysts
      Topics Columnists

      Latest Views

      Latest Views

      Trending Topics

      Top Columnists

      Latest Update

      Signals

      Copy Rankings Latest Signals Become a signal provider AI Rating
      Contests
      Brokers

      Overview Brokers Assessment Rankings Regulators News Claims
      Broker listing Forex Brokers Comparison Tool Live Spread Comparison Scam
      Q&A Complaint Scam Alert Videos Tips to Detect Scam
      More

      Business
      Events
      Careers About Us Advertising Help Center

      White Label

      Data API

      Web Plug-ins

      Affiliate Program

      Awards Institution Evaluation IB Seminar Salon Event Exhibition
      Vietnam Thailand Singapore Dubai
      Fans Party Investment Sharing Session
      FastBull Summit BrokersView Expo
      Recent Searches
        Top Searches
          Markets
          News
          Analysis
          User
          24/7
          Economic Calendar
          Education
          Data
          • Names
          • Latest
          • Prev

          View All

          No data

          Scan to Download

          Faster Charts, Chat Faster!

          Download App
          English
          • English
          • Español
          • العربية
          • Bahasa Indonesia
          • Bahasa Melayu
          • Tiếng Việt
          • ภาษาไทย
          • Français
          • Italiano
          • Türkçe
          • Русский язык
          • 简中
          • 繁中
          Open Account
          Search
          Products
          Charts Free Forever
          Markets
          News
          Signals

          Copy Rankings Latest Signals Become a signal provider AI Rating
          Contests
          Brokers

          Overview Brokers Assessment Rankings Regulators News Claims
          Broker listing Forex Brokers Comparison Tool Live Spread Comparison Scam
          Q&A Complaint Scam Alert Videos Tips to Detect Scam
          More

          Business
          Events
          Careers About Us Advertising Help Center

          White Label

          Data API

          Web Plug-ins

          Affiliate Program

          Awards Institution Evaluation IB Seminar Salon Event Exhibition
          Vietnam Thailand Singapore Dubai
          Fans Party Investment Sharing Session
          FastBull Summit BrokersView Expo

          Australian Met Coal Producers Face Rising Competition For Exports To India

          S&P Global Inc.

          Economic

          Commodity

          Forex

          Summary:

          Australian metallurgical coal producers expect higher exports to India but are facing increasing competition from the US and Russia, according to S&P Global Commodities at Sea data.

          Australian metallurgical coal producers expect higher exports to India but are facing increasing competition from the US and Russia, according to S&P Global Commodities at Sea data.BHP Group Ltd., Whitehaven Coal Ltd. and Yancoal Australia Ltd. outlined increased met coal production in fiscal 2025 while talking up India's demand growth, which could help arrest declining average realized prices. Platts assessed the premium hard coking coal Australia export FOB East Coast price at $187.50/mt on Aug. 22, down from $200.50/mt a year prior.

          While Japan accounts for about half of Whitehaven's total volume, "India has actually emerged with 11% now, which is good because that footprint we know will expand considerably as we go forward," Paul Flynn, managing director and CEO, said Aug. 21 during a fiscal 2025 call with analysts.In fiscal 2025, India shot up to become Whitehaven's second-largest export destination with A$795 million in revenue — all of it met coal — behind Japan's A$2.73 billion, according to the miner's annual report.

          "Structurally, India is very dependent on the seaborne market for met coal. It has next to nothing in terms of its own resource ... and Australia is already the largest supplier to India of its metallurgical coal demand," Flynn said during a same-day media call."With the growth in blast furnace construction capacity in [India], we can see an outlook for growth in metallurgical coal demand that's very strong; and we see limited opportunities in the pipeline for new supply to come on, hence our view that prices will continue to tighten and you'll see better pricing emerge as a result," Flynn added.

          Rising exports, increasing competition

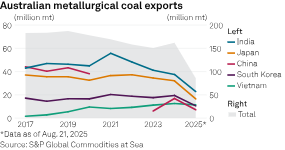
          While Australia's total met coal exports rose annually in 2024, the downtrend in exports to India that started in 2021 persisted, according to CAS data. In 2024, exports to India comprised 37.5 million mt of Australia's total of 161.9 million mt.China's return to procuring Australian coal, after banning coal from Down Under in 2020, is partly responsible for Australia's falling exports to India in recent years, said Pranay Shukla, head of dry bulk freight and commodities research at Commodity Insights, in an interview. India diversifying met coal supplies, including from the US, is also a factor, Shukla added.

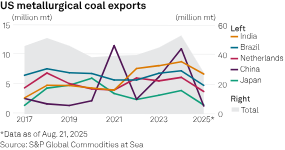
          India's met coal imports from the US steadily increased after 2021, hitting a record 8.8 million mt in 2024, second only to China's 11 million mt. India is already the lead destination for US met coal this year with 6.7 million mt as of Aug. 21, ahead of Brazil's 4.8 million mt and the Netherlands' 3.7 million mt. China stood at 1.4 million mt amid trade tensions with the US.The US, whose coal industry is now aided by an accommodative president, was India's third-highest met coal source behind Australia and Russia in 2024. Russia's exports to the subcontinent have also risen since 2021.

          Bright spot

          A slowdown in China's property sector lowered demand and cut met coal prices across product categories in fiscal 2025, and "India's demand has also been tempered by the early onset of the monsoon season along with higher levels of domestic production," Yancoal said Aug. 19 in its half-year report.However, "the Indian growth opportunity is real," Mark Salem, Yancoal's executive general manager of marketing, said on an analyst call Aug. 20.

          "The advantage of the Indian market is that India does not produce its own metallurgical coal, unlike China. Therefore, based on their GDP growth assumptions and this demand profile based on their infrastructure plans, they will need the coking coal to meet that growth requirement," Salem said.BHP CEO Mike Henry also highlighted India as "a bright spot for commodity demand" during an Aug. 19 fiscal 2025 results call.

          "Indian pig iron production growth remained strong" during fiscal 2025, and "robust hard coking coal imports from developing countries such as India will lead to growing and resilient demand for decades to come," BHP said in its results."India will likely remain the fastest-growing major economy, driven by sustained public investment, improving monetary conditions and resilient service sector activity," BHP said.

          Resilient China

          However, Henry noted on the call that BHP had underestimated the resilience of steel demand in China, whose production is believed to have peaked in 2020.BHP has seen "robust commodity demand in China from the continued strong growth there, including from the infrastructure and electrification sectors, even as demand from the property sector remains subdued," Henry added.

          Flynn also pointed to Chinese policy being "focused on constraint of surplus production of coal and of course, surplus steel production."Whitehaven's coal exports to China surged by over 957% to A$571 million in fiscal 2025 — all metallurgical — to become the miner's third-highest export destination after not even making its top 10 in fiscal 2024.

          Source: S&P Global Platts

          To stay updated on all economic events of today, please check out our Economic calendar
          Risk Warnings and Disclaimers
          You understand and acknowledge that there is a high degree of risk involved in trading. Following any strategies or investment methods may lead to potential losses. The content on the site is provided by our contributors and analysts for information purposes only. You are solely responsible for determining whether any trading assets, securities, strategy, or any other product is suitable for investing based on your own investment objectives and financial situation.
          Add to Favorites
          Share

          Fed’s Jackson Hole Exposes Hard Road Ahead For Central Bankers

          Samantha Luan

          Economic

          Political

          Forex

          The Federal Reserve’s (Fed) annual gathering in the Rocky Mountains is usually a time for central bankers and their wonky friends to kick back, discuss a few complicated economic topics and then go for a hike in the shadow of Grand Teton.This year, the Fed’s Jackson Hole symposium, which wrapped up Saturday, was at times a tense affair and drove home how difficult the path ahead is for the US central bank.

          On Friday, Chair Jerome Powell used his keynote speech to signal the Fed is headed for an interest-rate cut as soon as its next policy meeting in September. Yet there are clear divisions among policymakers over whether that’s the right call. Powell, himself, noted the economy has handed Fed officials a “challenging situation”.Policymakers are grappling with inflation that’s still above their 2% goal — and rising — and a labour market that’s showing signs of weakness. That unnerving reality, which pulls policy in opposite directions, is made worse by a high degree of uncertainty about how each of those factors will evolve over the coming months.

          “We’re getting some cross-currents and it’s in a difficult environment,” Chicago Fed President Austan Goolsbee said in an interview on the sidelines of the conference. “I always say the hardest job the central bank has is to get the timing right at moments of transition.”The conference also highlighted the political pressures weighing on the Fed. Those are likely to intensify in coming months as President Donald Trump looks to put his stamp on what may be the most prominent federal institution to have so far escaped his overhaul attempts.

          As Powell delivered his speech Friday morning, Trump said he would fire Fed Governor Lisa Cook if she didn’t resign over recent allegations that she committed mortgage fraud. It’s the latest attempt by the administration to pressure the Fed from multiple angles as Trump relentlessly pushes for lower interest rates.Security for the event was noticeably heightened compared to recent years, adding to the tension at the gathering. Officers from the Fed Police, US Park Police and Teton County Sheriff’s Office, some in military-style fatigues and carrying weapons, were a constant presence.

          Earlier Friday morning, officers had to remove one person, the Trump-backer and Fed gadfly James Fishback, after he confronted Cook in the lobby of the lodge and shouted questions about the mortgage controversy.

          Rate path

          Powell, in what was likely his final Jackson Hole speech at the helm of the Fed, detailed the cloudy signals coming from the economy.While the effect of tariffs on prices is now visible, there are still questions about whether that will reignite inflation in a more persistent way, he said. He called the labour market’s current status — with both falling demand for, and declining supply of workers — “curious”.

          Even with those uncertainties, Powell opened the door to a rate cut at the Fed’s Sept 16-17 meeting, though it wasn’t as clear a signal as at last year’s conference. Then, the labour market was deteriorating but inflation worries had receded, and many policymakers shared a desire to cut soon. The backing is not nearly as strong this year.

          Recent data have shown inflation has stalled above the Fed’s 2% goal, with some measures indicating that price pressures may be spilling over to products and services not directly impacted by tariffs. Meantime, while hiring has slowed significantly over the summer, other labour market indicators, like the low level of unemployment, paint a more stable picture.Without much clarity on how the economy will unfold, disagreements over how to proceed are festering among policymakers. Already, two governors dissented at the Fed’s July meeting, when officials didn’t cut rates. If they do cut in September, others may dissent in the opposite direction.

          Policy disagreements could grow in the coming months as Trump names new officials to vacancies at the Fed and Powell’s term as chair ends in May. The president has already tapped Stephen Miran, who chairs his Council of Economic Advisers, to fill an open slot on the Fed board that expires in January.

          Under pressure

          The discord among Fed officials comes at a time when the central bank is facing intense scrutiny from the White House. The topic seeped into conversations over coffee, during meals and in between sessions, even if there wasn’t much outright discussion of it during official conference proceedings.

          Karen Dynan, an economics professor at Harvard University and frequent attendee of the conference, said she wasn’t surprised that central bankers didn’t want to wade into conversations about politics. Still, she said the conference set an example of how big-picture economic issues should be approached.

          “This year it feels particularly meaningful that we have a bunch of papers that are grounded in good economics done by people who are prominent experts,” Dynan said. “These are not problems that can be solved by thinking about one’s intuition or talking to just a circle of people around you — you really need this sort of expertise.”

          A new framework

          One issue that received less attention was the new framework Powell unveiled in his speech.The document, which will guide policymakers as they pursue their inflation and employment goals, is the culmination of a months-long review of the previous one, implemented in 2020. The new strategy removes some of the language that more narrowly focused on the pre-pandemic challenge of persistently low inflation.

          It’s a return to basics and sets the Fed up to more clearly focus on its mandates of maximum employment and stable prices, said Carolin Pflueger, associate professor at the University of Chicago Harris School of Public Policy.In his remarks, Powell “emphasised that his job is inflation and unemployment, and that can only be achieved within an independent Fed,” Pflueger said. “I think people appreciate that.”

          Global impact

          That appreciation became apparent when Powell was greeted Friday morning with a standing ovation from economists and policymakers from around the world — and not for the first time this year.For them Fed independence is not only a matter of principle but also practicality, since decisions taken in Washington inevitably come with consequences that spread far beyond.

          The euro strengthened by 1% against the dollar following Powell’s remarks, adding downside risks to euro-area inflation that’s already seen falling to 1.6% next year.“If a cut does come and reflects slower US growth, that probably means slower growth for them given the size of the US,” Maurice Obstfeld, a senior fellow at the Peterson Institute for International Economics and the former chief economist at the International Monetary Fund, said of the euro area and other economies.

          Source: Theedgemarkets

          To stay updated on all economic events of today, please check out our Economic calendar
          Risk Warnings and Disclaimers
          You understand and acknowledge that there is a high degree of risk involved in trading. Following any strategies or investment methods may lead to potential losses. The content on the site is provided by our contributors and analysts for information purposes only. You are solely responsible for determining whether any trading assets, securities, strategy, or any other product is suitable for investing based on your own investment objectives and financial situation.
          Add to Favorites
          Share

          Texas Plant Turns U.S. Tariffs into Strategic Win for Chinese Copper Firm

          Gerik

          Economic

          Strategic Hedging Becomes Strategic Advantage

          Wellascent’s early-2024 decision to build a factory in Grand Prairie, Texas, initially served as a hedge against rising U.S.–China tensions. Now, that move is proving fruitful. As U.S. tariffs hit 50% on copper wire imports, the firm’s American-made products are gaining ground. The facility is set to start operations later in 2025 and aims to produce 3,000 metric tons of copper flat wire annually by 2028, with major clients like automaker Stellantis already in its portfolio.
          Hazel Zhu, a board member of Wellascent, revealed that American clients were initially hesitant due to trade tensions, but the new domestic plant removed doubts and created a “golden opportunity” under Trump’s tariff regime.

          Tariffs Fuel Local Manufacturing, but with Chinese Ownership

          The plant helps U.S. clients bypass tariffs on semi-finished copper products such as wires and tubes though refined copper remains tariff-exempt. Despite being a Chinese-owned facility, the investment ironically supports Washington’s reshoring goal: bringing more industrial capacity onto U.S. soil.
          Wellascent’s case underscores a contradiction in U.S. policy. While lawmakers support onshoring, they’re wary of Chinese firms. For example, Ford faced political backlash for sourcing battery tech from China’s CATL, raising debate on whether such collaborations deserve U.S. tax incentives.
          In the solar sector, U.S. firms have voiced similar concerns that Chinese rivals setting up plants in America still enjoy indirect advantages via China’s subsidized supply chains.

          Political Risk Remains High for Chinese FDI

          While Wellascent succeeded, broader trends show waning Chinese investment in the U.S. Net Chinese FDI dropped $8.1 billion from 2019 to 2023. Cameron Johnson of Tidalwave Solutions notes a climate of mutual distrust, with both Washington and Beijing discouraging cross-border industrial expansion. “Anybody who is big and could be a target is doing hardly any investment,” Johnson stated, calling Wellascent’s case “lucky.”
          The project almost failed when a surprise 145% tariff was slapped on their equipment shipments to the U.S. in April. Fortunately, a trade truce reached in May lifted those tariffs, allowing the second shipment to proceed without a 60% cost surge.

          Trade Truce Extensions & A Possible Blueprint

          The trade truce has since been extended by another 90 days, with Trump hinting a final deal is near. If realized, Wellascent’s Texas facility could become a case study in tariff-era resilience and adaptability. Cameron Johnson believes the firm’s example, while rare, may inspire others if relations improve.
          This development highlights a nuanced trend: while U.S. policies aim to counter China’s industrial clout, some Chinese firms are responding not with retreat but by embedding themselves directly within the American supply chain, thereby rewriting the rules of engagement.
          To stay updated on all economic events of today, please check out our Economic calendar
          Risk Warnings and Disclaimers
          You understand and acknowledge that there is a high degree of risk involved in trading. Following any strategies or investment methods may lead to potential losses. The content on the site is provided by our contributors and analysts for information purposes only. You are solely responsible for determining whether any trading assets, securities, strategy, or any other product is suitable for investing based on your own investment objectives and financial situation.
          Add to Favorites
          Share

          Tedious Seesaw For Gold About To End

          Winkelmann

          Commodity

          Forex

          Economic

          Gold’s hopes for an aggressive cut in the Fed’s federal funds rate, the associated decline in Treasury bond yields, and the weakening of the US dollar have not yet materialised. The Fed is likely to ease monetary policy in September. However, it may then pause again. Its slowness is bringing investors’ interest back to the greenback.

          Clouds are gathering over the precious metal due to Donald Trump’s efforts to end the armed conflict in Ukraine. The start of hostilities, followed by the West’s freezing of Russia’s gold and foreign exchange reserves, was the starting point for the Gold’s rally. Since February 2022, gold has risen 1.7x and reached a record high of more than $3,500 per ounce in April. The rally was driven by de-dollarisation, active buying of bullion by central banks, and increased demand for ETFs.

          In the second quarter, central bank activity in the precious metals market declined significantly, and capital flows into specialised exchange-traded funds slowed. Without these advantages, XAUUSD can forget about recovering the upward trend. However, the favourable external background in the form of monetary stimulus from the Fed, lower Treasury yields, and a weaker US dollar in the medium term will give gold a boost.

          The gold chart clearly shows consolidation since April, with the price right in the middle of the 12% range from peak to correction lows. This tedious five-month movement to the right is likely to end in the coming weeks, as August often marks the start of major trends in gold. The duration of consolidation is often directly proportional to the strength of the breakout.From a technical analysis perspective, given the accumulated overbought condition, the downside potential is huge – up to $3000 or even $2200 per ounce. However, the upside potential is no less impressive: $4600 in an extreme bullish scenario, including the Fed switching to a mode of absolute softness.

          Tedious Seesaw For Gold About To End_1

          Source: ACTIONFOREX

          To stay updated on all economic events of today, please check out our Economic calendar
          Risk Warnings and Disclaimers
          You understand and acknowledge that there is a high degree of risk involved in trading. Following any strategies or investment methods may lead to potential losses. The content on the site is provided by our contributors and analysts for information purposes only. You are solely responsible for determining whether any trading assets, securities, strategy, or any other product is suitable for investing based on your own investment objectives and financial situation.
          Add to Favorites
          Share

          First Impressions: NZ Retail Trade, June Quarter 2025

          Winkelmann

          Economic

          Forex

          Political

          Retail spending levels rose 0.5% in the June quarter, beating expectations. Retail sector conditions remain tough, but we are starting to see signs of the long-awaited recovery taking shape.

          June quarter retail sales

          ● Retail sales (volume of goods sold): +0.5% (Prev: +0.8%)
          ● Westpac f/c: -0.7%, Market: -0.3%
          ● Core retail sales (volume of goods sold): +0.7% (Prev: +0.4%)
          ● Nominal retail sales: +0.1% (Prev: +1.4%)

          Year to June

          ● Volume of goods sold: +2.3%
          ● Nominal sales: +2.5%

          Retail spending stronger than expected in the June quarter

          The June retail spending report was better than expected. While overall spending growth is still modest, spending appetites are gradually firming, including a lift in some discretionary categories.Retail spending rose 0.5% over the June quarter. That’s the third quarter in a row that spending levels have been pushing higher. The result was well ahead of our own forecast and the average market forecast for a fall in spending over the June quarter.At first glance, today’s result seems at odds with comments from the retail and hospitality sectors of continued soft trading conditions. But digging under the surface, we can start to see what’s going on.

          In several sectors (especially durable items for the home), spending levels remain well down on the levels we saw in 2021. In addition, while spending levels are turning higher, spending growth remains quite modest – the volume of goods sold rose around 2.5% over the past year, compared to gains of around 4.5% per annum before the pandemic.But while the retail sector is still confronting some tough trading conditions, we are starting to see signs that the long-awaited recovery is taking shape. Spending levels have risen for the past three quarter. That includes gains in discretionary areas like recreational goods and electronics. However, it is still a mixed picture with spending in sectors like hospitality still flat.

          What’s the outlook for the rest of 2025?

          Today’s update is an encouraging sign for spending over the remainder of 2025. Spending levels are already pushing higher, and the full impact of the large reductions in interest rates over the past year is yet to be felt.Over the coming months, increasing numbers of borrowers will be rolling on to lower borrowing rates. The related lift in disposable incomes could be sizeable in some cases, and that’s set to boost spending through the latter part of the year.

          There are still some headwinds for the retail sector. Most notably, unemployment is likely to rise around to 5.3% before the end of the year.

          Even so, it looks like a recovery in the retail sector is now taking shape.

          Implications for GDP growth

          We’re forecasting flat GDP growth over the June quarter. Today’s result was ahead of our expectations. However, we’ll take a closer look at how our forecast for GDP growth is shaping up over the next couple of weeks as additional data on June quarter activity is released.

          Source: ACTIONFOREX

          To stay updated on all economic events of today, please check out our Economic calendar
          Risk Warnings and Disclaimers
          You understand and acknowledge that there is a high degree of risk involved in trading. Following any strategies or investment methods may lead to potential losses. The content on the site is provided by our contributors and analysts for information purposes only. You are solely responsible for determining whether any trading assets, securities, strategy, or any other product is suitable for investing based on your own investment objectives and financial situation.
          Add to Favorites
          Share

          Oil Prices Edge Up Amid Ukraine Strikes on Russian Energy, Fed Easing Hopes

          Gerik

          Economic

          Commodity

          Geopolitical Tensions Push Supply Risk Higher

          Oil markets began the week on firmer footing after Ukraine intensified drone attacks on Russian energy sites over the weekend. The most notable incident was a strike that triggered a significant fire at the Ust-Luga fuel export terminal and reduced operations at a reactor within one of Russia’s largest nuclear power plants. Meanwhile, a separate blaze at the Novoshakhtinsk refinery caused by another Ukrainian drone has been burning for four consecutive days.
          The Novoshakhtinsk facility processes about 100,000 barrels of crude per day, primarily for export, making it a strategically significant asset. As these strikes continue to successfully target Russia’s oil infrastructure, the market is increasingly pricing in the risk of a tighter global supply.
          Tony Sycamore, an analyst at IG Markets, noted that “the risks for crude oil are shifting to the topside” as Ukraine’s attacks yield greater operational disruption.

          Mild Gains Reflect Market Caution

          Despite the geopolitical shock, price movements remain modest. As of early Monday trading (0050 GMT), Brent crude rose 6 cents to $67.79 per barrel (+0.09%), and WTI crude increased 9 cents to $63.75 per barrel (+0.14%). These small gains suggest that while risk is elevated, markets remain cautious balancing physical supply threats with diplomatic developments and macroeconomic signals.
          U.S. Vice President JD Vance offered a somewhat optimistic note, stating on NBC that Russia has made “significant concessions” in its war strategy, stepping back from its initial ambition to install a puppet government in Kyiv. He also mentioned that Russia had agreed, in principle, to some form of security guarantees for Ukraine’s territorial sovereignty.
          However, President Donald Trump simultaneously increased pressure on Moscow, issuing a two-week ultimatum to show credible progress toward peace or face additional sanctions. This push-pull between negotiation and renewed economic threats adds further complexity to oil market forecasts.

          Macro Tailwinds from U.S. Fed Pivot

          The upward momentum in oil is also supported by global macroeconomic sentiment. Federal Reserve Chair Jerome Powell signaled last Friday that a rate cut could be on the table in September, prompting a risk-on rally across commodity and equity markets. Lower interest rates are typically seen as stimulative for economic growth, which in turn boosts demand for energy and fuels.
          ANZ analysts summarized the mood: “A risk-on tone across markets boosted investor appetite across the commodities complex, aided by renewed supply side issues across energy and metals.”
          While oil prices are only marginally higher for now, the convergence of intensifying conflict in Eastern Europe, potential U.S. policy shifts, and central bank dovishness sets the stage for potential volatility. Should Ukrainian strikes further degrade Russian oil infrastructure or if diplomatic negotiations falter the upward pressure on crude could intensify sharply. Conversely, any de-escalation or surprise in global growth data may temper the current bullish undertone.

          Source: Reuters

          To stay updated on all economic events of today, please check out our Economic calendar
          Risk Warnings and Disclaimers
          You understand and acknowledge that there is a high degree of risk involved in trading. Following any strategies or investment methods may lead to potential losses. The content on the site is provided by our contributors and analysts for information purposes only. You are solely responsible for determining whether any trading assets, securities, strategy, or any other product is suitable for investing based on your own investment objectives and financial situation.
          Add to Favorites
          Share

          Asian Markets Surge on Fed Pivot and Nvidia Optimism, but Inflation Looms

          Gerik

          Economic

          Stocks

          Markets Rally on Rate Cut Hopes

          Asian stock markets opened the week on a strong note, lifted by investor optimism that the U.S. Federal Reserve will begin cutting interest rates as early as September. Futures markets now price in an 84% probability of a 25-basis-point rate cut next month, with total easing expected to reach 100 basis points by mid-2026, bringing the Fed funds rate to around 3.25–3.5%.
          This optimism follows Fed Chair Jerome Powell’s recent shift toward a more dovish stance, prompting a retreat in both Treasury yields and the U.S. dollar. While this is supportive of corporate earnings and risk appetite, it also signals that the Fed may be more concerned about a potential softening in employment and overall economic growth.
          Bruce Kasman, Chief Economist at JPMorgan, noted that the Fed’s pivot aligns with his firm’s forecast of declining labor demand and increased downside risks to global growth in the current quarter.

          Inflation Risks Still Cast a Shadow

          Despite the bullish tone, markets face a key test later this week with the release of U.S. personal consumption expenditures (PCE) data. Core PCE inflation is projected to rise to 2.9% its highest level since late 2023.
          Kasman warned that rising service-sector prices, compounded by tariff pressures, could push core inflation to a 4% annualized pace. A surprise in either direction could disrupt the current rally in equities and longer-dated Treasuries, especially with $183 billion in new U.S. debt set to be issued this week.
          On Monday, 10-year Treasury yields held steady at 4.263% after falling 7 basis points last Friday.

          Asian Indices Gain Across the Board

          Following Wall Street's lead, major Asian indices posted gains. Japan’s Nikkei rose 0.8%, South Korea’s KOSPI climbed 0.7%, and Australia’s ASX 200 added 0.9%. MSCI’s broadest index of Asia-Pacific shares outside Japan rose 0.4%.
          Meanwhile, European and U.S. futures remained flat as investors awaited midweek data and earnings announcements.
          Investors are closely watching Nvidia’s earnings report due Wednesday. The chipmaker, now valued at $4 trillion, is expected to post a 48% year-on-year EPS growth on revenues of $45.9 billion for its second fiscal quarter. Options traders are bracing for a 6% swing in share price, which could ripple across tech-heavy indices.
          Markets are also eager for more detail on Nvidia’s China sales outlook and its agreement with President Trump’s administration to share 15% of revenues from certain advanced chip sales in China.
          Trump further made headlines by announcing a $8.9 billion U.S. government stake in Intel, acquiring 9.9% at a discounted $20.47 per share, compared to Intel’s Friday close of $24.80.

          Currency and Commodities Respond to Weaker Dollar

          The U.S. dollar stabilized at 147.28 yen after Friday’s 1% drop, while the euro recovered to $1.1702. The ECB is expected to keep rates unchanged in September, though internal discussions about possible cuts may resume later in the year if the Eurozone economy deteriorates further.
          Gold surged to $3,365 per ounce, benefiting from a weaker dollar. Oil prices edged higher due to stalled Russia–Ukraine talks, with Brent crude at $67.31 and U.S. WTI at $63.78 per barrel.
          The global market rebound is being driven by a blend of macro-policy hope and AI-fueled corporate momentum, particularly from Nvidia. However, upcoming inflation data and bond market stress tests could quickly temper the current euphoria. Investors remain cautiously optimistic but are bracing for volatility amid shifting monetary, geopolitical, and earnings dynamics.

          Source: Reuters

          To stay updated on all economic events of today, please check out our Economic calendar
          Risk Warnings and Disclaimers
          You understand and acknowledge that there is a high degree of risk involved in trading. Following any strategies or investment methods may lead to potential losses. The content on the site is provided by our contributors and analysts for information purposes only. You are solely responsible for determining whether any trading assets, securities, strategy, or any other product is suitable for investing based on your own investment objectives and financial situation.
          Add to Favorites
          Share
          FastBull
          Copyright © 2025 FastBull Ltd

          728 RM B 7/F GEE LOK IND BLDG NO 34 HUNG TO RD KWUN TONG KLN HONG KONG

          TelegramInstagramTwitterfacebooklinkedin
          App Store Google Play Google Play
          Products
          Charts

          Chats

          Q&A with Experts
          Screeners
          Economic Calendar
          Data
          Tools
          Membership
          Features
          Function
          Markets
          Copy Trading
          Latest Signals
          Contests
          News
          Analysis
          24/7
          Columns
          Education
          Company
          Careers
          About Us
          Contact Us
          Advertising
          Help Center
          Feedback
          User Agreement
          Privacy Policy
          Business

          White Label

          Data API

          Web Plug-ins

          Poster Maker

          Affiliate Program

          Risk Disclosure

          The risk of loss in trading financial instruments such as stocks, FX, commodities, futures, bonds, ETFs and crypto can be substantial. You may sustain a total loss of the funds that you deposit with your broker. Therefore, you should carefully consider whether such trading is suitable for you in light of your circumstances and financial resources.

          No decision to invest should be made without thoroughly conducting due diligence by yourself or consulting with your financial advisors. Our web content might not suit you since we don't know your financial conditions and investment needs. Our financial information might have latency or contain inaccuracy, so you should be fully responsible for any of your trading and investment decisions. The company will not be responsible for your capital loss.

          Without getting permission from the website, you are not allowed to copy the website's graphics, texts, or trademarks. Intellectual property rights in the content or data incorporated into this website belong to its providers and exchange merchants.

          Not Logged In

          Log in to access more features

          FastBull Membership

          Not yet

          Purchase

          Become a signal provider
          Help Center
          Customer Service
          Dark Mode
          Price Up/Down Colors

          Log In

          Sign Up

          Position
          Layout
          Fullscreen
          Default to Chart
          The chart page opens by default when you visit fastbull.com