• Trade
  • Markets
  • Copy
  • Contests
  • 24/7
  • Calendar
  • Q&A
  • Chats
Screeners
SYMBOL
LAST
BID
ASK
HIGH
LOW
NET CHG.
%CHG.
SPREAD
SOURCE
SPX
S&P 500 Index
7511.42
7511.42
7511.42
7564.96
7508.68
-42.86
-0.57%
--
--
DJI
Dow Jones Industrial Average
52002.21
52002.21
52002.21
52190.29
51864.99
+331.19
+ 0.64%
--
--
IXIC
NASDAQ Composite Index
26376.33
26376.33
26376.33
26788.62
26369.39
-307.60
-1.15%
--
--
USDX
US Dollar Index
99.280
99.280
99.360
99.510
99.160
-0.030
-0.03%
--
--
EURUSD
Euro / US Dollar
1.16065
1.16065
1.16073
1.16195
1.15747
+0.00177
+ 0.15%
--
--
GBPUSD
Pound Sterling / US Dollar
1.34219
1.34219
1.34226
1.34429
1.33902
+0.00114
+ 0.09%
--
--
XAUUSD
Gold / US Dollar
4332.02
4332.02
4332.45
4354.80
4305.88
+23.67
+ 0.55%
--
--
WTI
Light Sweet Crude Oil
76.058
76.058
76.088
80.135
74.723
-3.780
-4.73%
--
--

Community Accounts

Signal Accounts
--
Profit Accounts
--
Loss Accounts
--
View More

Become a signal provider

Sell trading signals to earn additional income

View More

Guide to Copy Trading

Get started with ease and confidence

View More

Signal Accounts for Members

All Signal Accounts

Best Return
  • Best Return
  • Best P/L
  • Best MDD
Past 1W
  • Past 1W
  • Past 1M
  • Past 1Y

All Contests

  • All
  • Recommend
  • Stocks
  • Cryptocurrencies
  • Central Banks
  • Trump Updates
  • Featured News
Top News Only
Share

Russia Has Banned 103 Canadians From Entering The Country In Response To Canadian Sanctions

Share

Industry Insiders: "All China–U.S. Routes Are Fully Booked."

Share

U.S. Defense Secretary Hergsays Will Travel To Belgium Tomorrow To Attend A NATO Ministerial Meeting

Share

According To Serbian State Television, The Sanction Grace Period For NIS Oil Company, Which Is Owned By Russia And Subject To US Sanctions, Has Been Extended To July 1

Share

Cheniere Energy CFO: Most Developing Countries Will Not Entrust Their Energy Security To The United States. We Hope Qatar Energy Will Return To The Market As Soon As Possible, As This Will Create A More Diversified Global Supply Structure

Share

According To Venezuelan State Television: Venezuela's State Oil Company, PDVSA, Has Signed A Memorandum Of Understanding With Spain's Repsol For Crude Oil And Natural Gas

Share

Citadel Securities: Loose Financial Conditions, Persistent Supply Chain Disruptions, An Accelerating Recovery In The Labor Market, And A Surge In Investment In Artificial Intelligence Are All Working Together To Maintain Inflationary Pressures

Share

Citadel Securities: With Inflation Persisting And Widespread, The Federal Reserve May Begin A Series Of Rate Hikes As Early As September

Share

The China Earthquake Networks Center Officially Determined That A 3.7-magnitude Earthquake Occurred In Haixi Prefecture, Qinghai Province At 02:50 On June 17, With A Focal Depth Of 10 Kilometers

Share

The Central Bank Of Peru Purchased $221 Million In The Spot Foreign Exchange Market

Share

The Central Bank Of Peru Conducted A Currency Swap Operation Of 1.1 Million Soles

Share

Fitch: Brazil's Total Government Debt As A Percentage Of GDP Will Rise To 78.6% In 2025 And Is Expected To Exceed 80% In 2026

Share

Fitch: We Expect Brazil’s Overall Government Deficit As A Percentage Of GDP To Widen From 8.1% In 2025 To 8.6% In 2026

Share

Fitch Affirmed Brazil's Rating At BB With A Stable Outlook

Share

U.S. Senate Republican Leader Thune: In My Opinion, At Least Senate Minority Leader Schumer And The Democrats Seem To Want One More Government Shutdown

Share

The Ukrainian Air Force Stated That A Su-24M Aircraft Crashed In Western Ukraine, Killing Both Crew Members On Board

Share

The Bank Of France Has Lowered Its 2026 Economic Growth Forecast From 0.9% To 0.5%

Share

The Bank Of France Projects Inflation At 2.5% In 2026 (previously Forecast At 1.7%). Economic Growth Is Expected To Stagnate In The Second Quarter

Share

Brazilian President Lula And European Commission President Von Der Leyen Pledged To Seek Solutions To The EU's Concerns

Share

Brazilian President Lula Met With European Commission President Ursula Von Der Leyen To Discuss Trade Restrictions On Brazilian Products

TIME
ACT
FCST
PREV
IMPACT
U.S. Industrial Output YoY (May)

A:--

F: --

P: --

USDX
  • USDX
  • XAUUSD
  • XAGUSD
  • WTI
U.S. Manufacturing Capacity Utilization (May)

A:--

F: --

P: --

USDX
  • USDX
  • XAUUSD
  • XAGUSD
  • WTI
U.S. NAHB Housing Market Index (Jun)

A:--

F: --

P: --

USDX
  • USDX
  • XAUUSD
  • XAGUSD
  • WTI
China, Mainland Urban Area Unemployment Rate (May)

A:--

F: --

P: --

XAUUSD
  • XAUUSD
  • XAGUSD
  • WTI
  • USDX
China, Mainland Industrial Output YoY (YTD) (May)

A:--

F: --

P: --

XAUUSD
  • XAUUSD
  • XAGUSD
  • WTI
  • USDX
Japan Benchmark Interest Rate

A:--

F: --

P: --

USDJPY
  • USDJPY
  • XAUUSD
  • XAGUSD
  • WTI
  • USDX
BOJ Monetary Policy Statement
Australia Overnight (Borrowing) Key Rate

A:--

F: --

P: --

AUDUSD
  • AUDUSD
  • XAUUSD
  • XAGUSD
  • WTI
  • USDX
RBA Rate Statement
BOJ Press Conference
Turkey Retail Sales YoY (Apr)

A:--

F: --

P: --

XAUUSD
  • XAUUSD
  • XAGUSD
  • WTI
  • USDX
Euro Zone Gross Wages YoY (Q1)

A:--

F: --

P: --

EURUSD
  • EURUSD
  • XAUUSD
  • XAGUSD
  • WTI
  • USDX
Euro Zone ZEW Current Conditions Index (Jun)

A:--

F: --

P: --

EURUSD
  • EURUSD
  • XAUUSD
  • XAGUSD
  • WTI
  • USDX
Germany ZEW Economic Sentiment Index (Jun)

A:--

F: --

P: --

EURUSD
  • EURUSD
  • XAUUSD
  • XAGUSD
  • WTI
  • USDX
Canada Existing Home Sales MoM (May)

A:--

F: --

P: --

USDCAD
  • USDCAD
  • XAUUSD
  • XAGUSD
  • WTI
  • USDX
Euro Zone Labor Cost YoY (Q1)

A:--

F: --

P: --

EURUSD
  • EURUSD
  • XAUUSD
  • XAGUSD
  • WTI
  • USDX
Euro Zone ZEW Economic Sentiment Index (Jun)

A:--

F: --

P: --

EURUSD
  • EURUSD
  • XAUUSD
  • XAGUSD
  • WTI
  • USDX
Germany ZEW Current Conditions Index (Jun)

A:--

F: --

P: --

EURUSD
  • EURUSD
  • XAUUSD
  • XAGUSD
  • WTI
  • USDX
U.K. 10-Year Note Auction Yield

A:--

F: --

P: --

GBPUSD
  • GBPUSD
  • XAUUSD
  • XAGUSD
  • WTI
  • USDX
Brazil Retail Sales MoM (Apr)

A:--

F: --

P: --

XAUUSD
  • XAUUSD
  • XAGUSD
  • WTI
  • USDX
U.S. Import Price Index YoY (May)

A:--

F: --

P: --

USDX
  • USDX
  • XAUUSD
  • XAGUSD
  • WTI
U.S. Building Permits MoM (SA) (May)

A:--

F: --

P: --

USDX
  • USDX
  • XAUUSD
  • XAGUSD
  • WTI
U.S. New Housing Starts Annualized MoM (SA) (May)

A:--

F: --

P: --
USDX
  • USDX
  • XAUUSD
  • XAGUSD
  • WTI
U.S. Export Price Index MoM (May)

A:--

F: --

P: --
USDX
  • USDX
  • XAUUSD
  • XAGUSD
  • WTI
U.S. Export Price Index YoY (May)

A:--

F: --

P: --

USDX
  • USDX
  • XAUUSD
  • XAGUSD
  • WTI
U.S. Import Price Index MoM (May)

A:--

F: --

P: --
USDX
  • USDX
  • XAUUSD
  • XAGUSD
  • WTI
U.S. Total Building Permits (SA) (May)

A:--

F: --

P: --

USDX
  • USDX
  • XAUUSD
  • XAGUSD
  • WTI
U.S. Annual New Housing Starts (SA) (May)

A:--

F: --

P: --
USDX
  • USDX
  • XAUUSD
  • XAGUSD
  • WTI
U.S. Weekly Redbook Index YoY

A:--

F: --

P: --

XAUUSD
  • XAUUSD
  • XAGUSD
  • WTI
  • USDX
ECB Chief Economist Lane Speaks
U.S. API Weekly Refined Oil Stocks

--

F: --

P: --

U.S. API Weekly Gasoline Stocks

--

F: --

P: --

U.S. API Weekly Cushing Crude Oil Stocks

--

F: --

P: --

U.S. API Weekly Crude Oil Stocks

--

F: --

P: --

Japan Reuters Tankan Manufacturers Index (Jun)

--

F: --

P: --

Japan Reuters Tankan Non-Manufacturers Index (Jun)

--

F: --

P: --

Japan Imports YoY (May)

--

F: --

P: --
Japan Exports YoY (May)

--

F: --

P: --

Japan Trade Balance (Not SA) (May)

--

F: --

P: --
Japan Goods Trade Balance (SA) (May)

--

F: --

P: --

Japan Core Machinery Orders YoY (Apr)

--

F: --

P: --

Japan Core Machinery Orders MoM (Apr)

--

F: --

P: --

Australia Westpac Leading Index MoM (May)

--

F: --

P: --

U.K. CPI MoM (May)

--

F: --

P: --

U.K. Core CPI YoY (May)

--

F: --

P: --

U.K. Output PPI MoM (Not SA) (May)

--

F: --

P: --

U.K. Retail Prices Index YoY (May)

--

F: --

P: --

U.K. Core Retail Prices Index YoY (May)

--

F: --

P: --

U.K. CPI YoY (May)

--

F: --

P: --

U.K. Retail Prices Index MoM (May)

--

F: --

P: --

U.K. Output PPI YoY (Not SA) (May)

--

F: --

P: --
U.K. Input PPI YoY (Not SA) (May)

--

F: --

P: --

U.K. Input PPI MoM (Not SA) (May)

--

F: --

P: --

U.K. Core CPI MoM (May)

--

F: --

P: --

South Africa Core CPI YoY (May)

--

F: --

P: --

South Africa CPI YoY (May)

--

F: --

P: --

IEA Oil Market Report
Euro Zone Core CPI Final MoM (May)

--

F: --

P: --

Euro Zone CPI YoY (Excl. Tobacco) (May)

--

F: --

P: --

South Africa Retail Sales YoY (Apr)

--

F: --

P: --

U.S. MBA Mortgage Application Activity Index WoW

--

F: --

P: --

Q&A with Experts
    • All
    • Chatrooms
    • Groups
    • Friends
    EuroTrader flag
    EuroTrader
    @mis Dallas this is Bitcoin on the h4 time frame. it's really at a strong resistance level and could trade lower from here
    mis Dallas
    you don't use trading view
    EuroTrader flag
    mis Dallas
    @EuroTraderyh but still bearish
    @mis Dallas Yes it's still very much bearish in the short and long term. let's just ride the flow
    mis Dallas
    EuroTrader
    @mis Dallas this is Bitcoin on the h4 time frame. it's really at a strong resistance level and could trade lower from here
    @EuroTraderyes exactly 💯 even m15
    EuroTrader flag
    mis Dallas
    @EuroTraderyes exactly 💯 even m15
    @mis Dallas all-time friends asides the daily and the weekly time frames are actually bearish
    mis Dallas
    EuroTrader
    @mis Dallas all-time friends asides the daily and the weekly time frames are actually bearish
    @EuroTraderokay as far me I just used 4h 30m wait for enter 15m confirm
    EuroTrader flag
    mis Dallas
    @EuroTraderokay as far me I just used 4h 30m wait for enter 15m confirm
    @mis Dallas that means you are more of an intraday trader than a scalper which is great
    EuroTrader flag
    mis Dallas
    EuroTrader
    @mis Dallas that means you are more of an intraday trader than a scalper which is great
    @EuroTraderwhat do you mean me I don't do scalper because am busy during day time
    EuroTrader flag
    mis Dallas
    @EuroTraderwhat do you mean me I don't do scalper because am busy during day time
    @mis Dallas how long do you hold your trades for. if you hold it for more than a day then you are not a scalper but rather Intraday trader
    mis Dallas
    EuroTrader
    @mis Dallas how long do you hold your trades for. if you hold it for more than a day then you are not a scalper but rather Intraday trader
    @EuroTraderme I don't hold trader for days because I have small account am still bulling account
    mis Dallas
    I just entered and out and not everyday
    mis Dallas
    mis Dallas
    is also drop
    EuroTrader flag
    mis Dallas
    @EuroTraderme I don't hold trader for days because I have small account am still bulling account
    @mis Dallas ohh that means you are actually a scalper. cause of your time frame i thought you were actually a swing trader or day trader
    EuroTrader flag
    mis Dallas
    @mis Dallas This is the dow jones Industrial average you are looking at right
    mis Dallas
    EuroTrader
    @mis Dallas This is the dow jones Industrial average you are looking at right
    @EuroTraderokay exactly 💯
    mis Dallas
    EuroTrader
    @mis Dallas ohh that means you are actually a scalper. cause of your time frame i thought you were actually a swing trader or day trader
    @EuroTraderwhich good time frame can use to hold the trade for days.
    mis Dallas
    maybe help me to change something but not rushing
    mis Dallas
    mis Dallas
    @EuroTraderwhich good time frame can use to hold the trade for days.
    oil is now consolidating just looking for liquidity mean no enter
    Type here...
    Add Symbol or Code

      No matching data

      All
      Recommend
      Stocks
      Cryptocurrencies
      Central Banks
      Trump Updates
      Featured News
      • All
      • Russia-Ukraine Conflict
      • Middle East Flashpoint
      • All
      • Russia-Ukraine Conflict
      • Middle East Flashpoint

      Search
      Products

      Charts Free Forever

      Chats Q&A with Experts
      Screeners Economic Calendar Data Tools
      Membership Features
      Data Warehouse Market Trends Institutional Data Policy Rates Macro

      Market Trends

      Market Sentiment Order Book Forex Correlations

      Top Indicators

      Charts Free Forever
      Markets

      News

      24/7 Analysis Education

      Latest Views

      Latest Update

      Signals

      Copy Rankings Latest Signals Become a signal provider AI Rating
      Contests
      Brokers

      Overview Brokers Assessment Rankings Regulators News Claims
      Broker listing Forex Brokers Comparison Tool Live Spread Comparison Scam
      Q&A Complaint Scam Alert Videos Tips to Detect Scam
      More

      Business
      Events
      Careers About Us Advertising Help Center

      White Label

      Broker API

      Data API

      Web Plug-ins

      Affiliate Program

      Awards Institution Evaluation IB Seminar Salon Event Exhibition
      Vietnam Thailand Singapore Dubai
      Fans Party Investment Sharing Session
      FastBull Summit BrokersView Expo
      Recent Searches
        Top Searches
          Markets
          Analysis
          User
          24/7
          Economic Calendar
          Education
          Data
          • Names
          • Latest
          • Prev

          View All

          No data

          Scan to Download

          Faster Charts, Chat Faster!

          Download
          English
          • English
          • Español
          • العربية
          • Bahasa Indonesia
          • Bahasa Melayu
          • Tiếng Việt
          • ภาษาไทย
          • Français
          • Italiano
          • Türkçe
          • Русский язык
          • 简中
          • 繁中
          Open Account
          Search
          Products
          Charts Free Forever
          Markets
          News
          Signals

          Copy Rankings Latest Signals Become a signal provider AI Rating
          Contests
          Brokers

          Overview Brokers Assessment Rankings Regulators News Claims
          Broker listing Forex Brokers Comparison Tool Live Spread Comparison Scam
          Q&A Complaint Scam Alert Videos Tips to Detect Scam
          More

          Business
          Events
          Careers About Us Advertising Help Center

          White Label

          Broker API

          Data API

          Web Plug-ins

          Affiliate Program

          Awards Institution Evaluation IB Seminar Salon Event Exhibition
          Vietnam Thailand Singapore Dubai
          Fans Party Investment Sharing Session
          FastBull Summit BrokersView Expo

          Gold Consolidates After Its Best Multi-Day Rally in Months as Investors Demand More Than Just Trump's Word on the Deal

          Warren Takunda

          Traders' Opinions

          Summary:

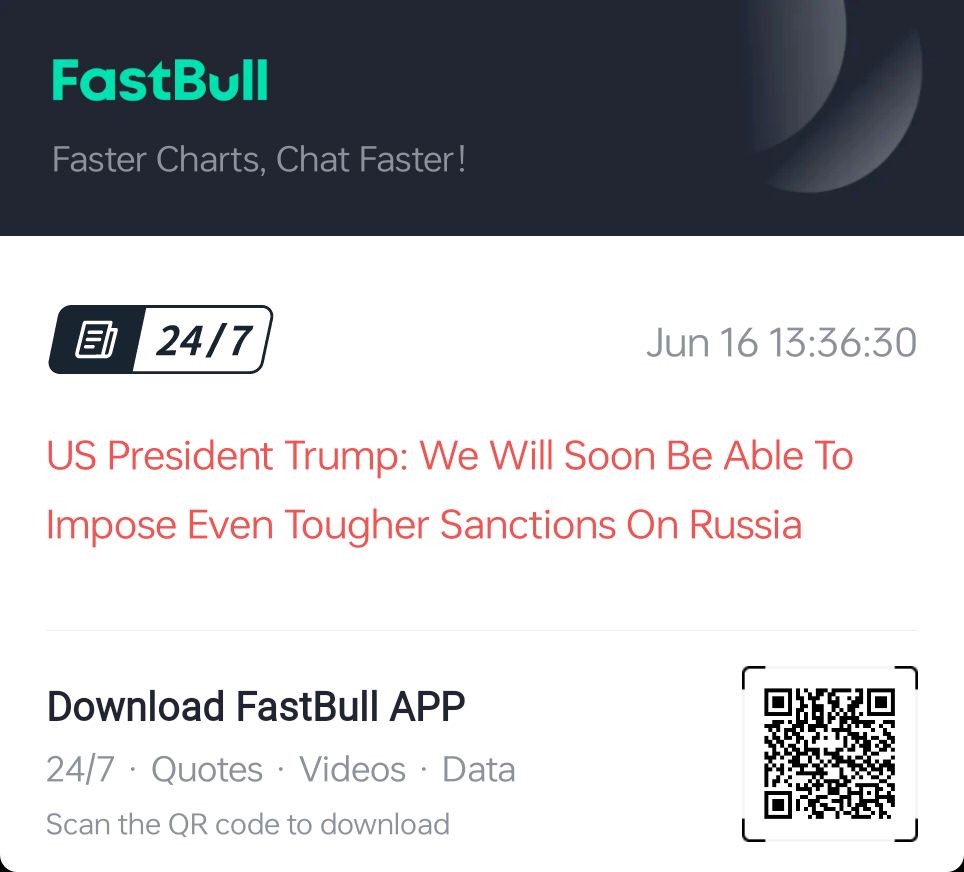
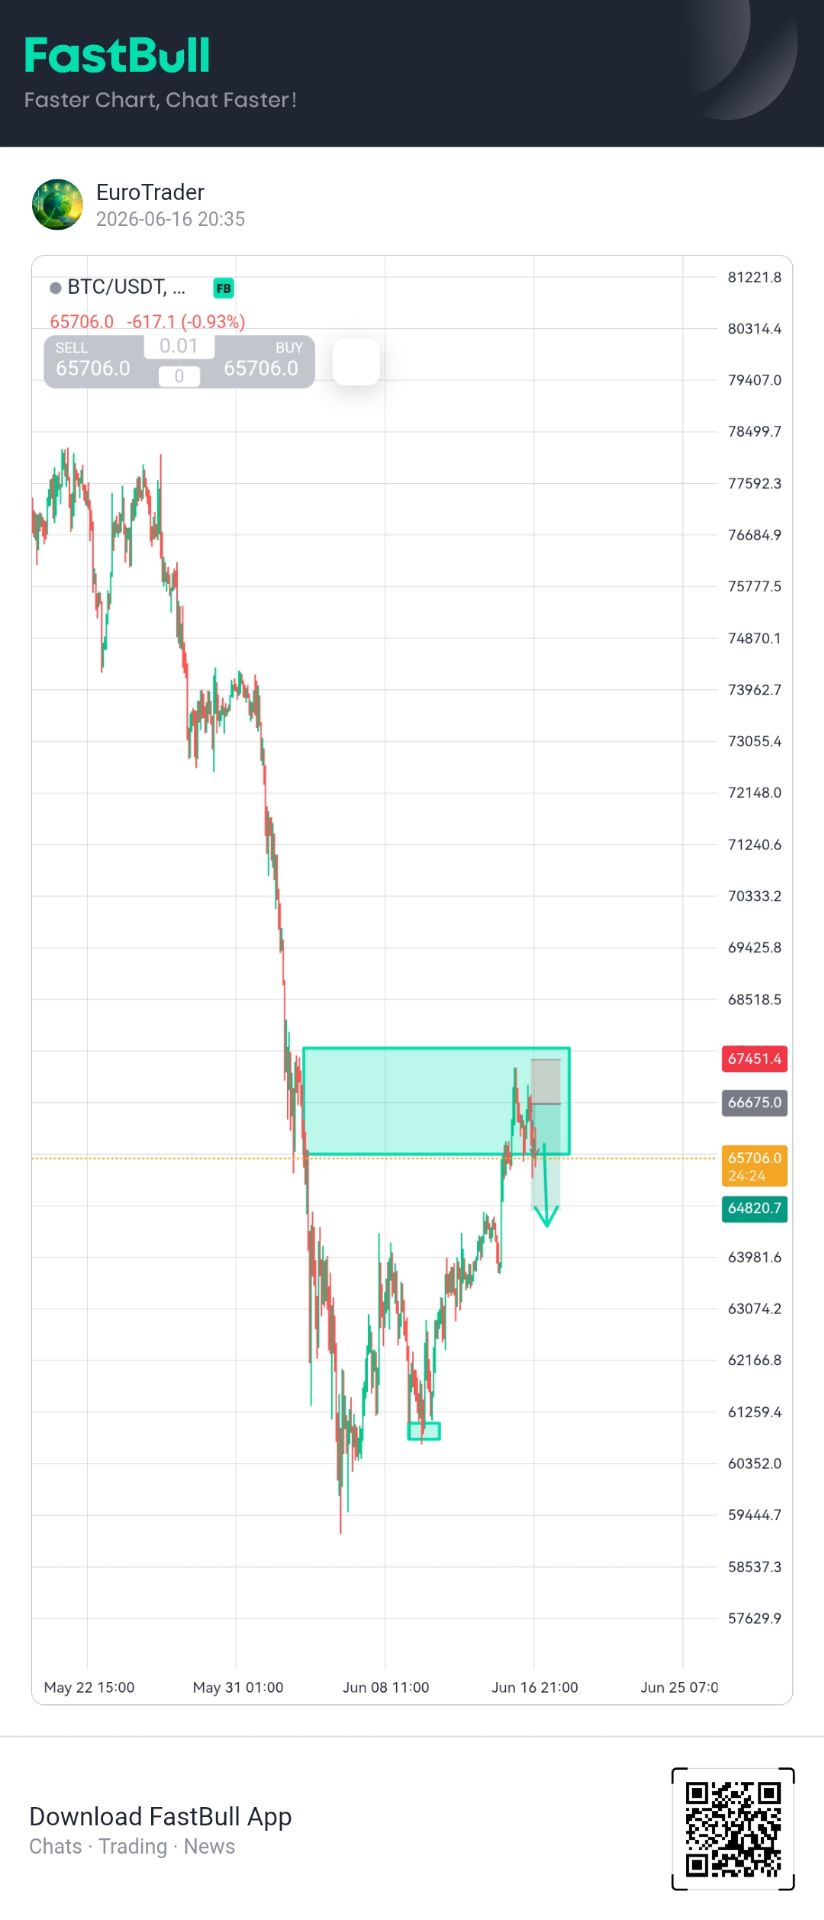
          Gold holds above $4,300 after a 6.5% rally on the US-Iran peace deal but momentum has stalled as investors wait for details on Hormuz traffic, Iran's nuclear program, and whether major central banks will now stand down from their tightening plans. Trump says it is signed. Markets want proof.

          BUY XAUUSD
          EXP
          TRADING

          4339.89

          Entry Price

          4600.00

          TP

          4200.00

          SL

          4332.02 +23.67 +0.55%

          0.0

          Pips

          Flat

          4200.00

          SL

          Exit Price

          4339.89

          Entry Price

          4600.00

          TP

          Gold has done something remarkable over the past few sessions. A 6.5% rally is not routine. It is the kind of repricing that happens when a market-defining event lands with enough force to rearrange the entire macro landscape in hours. The US-Iran peace deal is that event. The stall at $4,300 is the market asking whether the event is actually what it appears to be.
          Trump said the deal is signed and details may come before Friday. In normal diplomatic circumstances a signed agreement generates immediate sustained conviction. In the context of a conflict that has produced ceasefire extensions, contradictory statements, IRGC counterclaims, and US military strikes called self-defense over the past three months, the market has learned to treat announcements as the beginning of the verification process rather than the end of uncertainty. $4,300 is where the headline ends and the questions begin.
          The Strait of Hormuz is the most important variable in that verification process. Three months of closure drove global inflation to levels that forced central banks worldwide to abandon easing cycles and pivot toward tightening. That inflationary pressure is embedded in every CPI reading, every producer price survey, and every central bank communication since March. If the deal delivers genuine Hormuz reopening, energy costs fall, inflation moderates, and the central banks that were forced hawkish by a supply shock they could not control suddenly have room to pause. That is the scenario gold's 6.5% rally was pricing. The stall reflects uncertainty about whether it is actually being delivered.
          The nuclear dimension adds complexity. Reports suggest Iran's nuclear program was deferred to a later negotiating stage rather than resolved in the current agreement. Re-escalation risk has not been completely eliminated, and any investor who has watched this conflict produce surprise military strikes and vessel seizures is entitled to maintain skepticism about any arrangement that leaves the hardest question unanswered.
          This week's central bank decisions are the secondary catalyst that matters. A Fed that signals comfort pausing given the prospect of reduced energy inflation would be genuinely bullish for gold. A Fed that maintains hawkish language pending Hormuz confirmation would cap gold near current levels. The monetary policy pivot that peace makes possible is the mechanism through which gold's traditional inflation hedge role gets restored, because the contradiction of the past three months, high inflation forcing rate hikes that suppressed gold, finally resolves in the metal's favor if rates stop rising.

          Technical AnalysisGold Consolidates After Its Best Multi-Day Rally in Months as Investors Demand More Than Just Trump's Word on the Deal_1

          The gold chart over the past three weeks is one of the most dramatic price action sequences visible on any major asset right now, and understanding what it means for the immediate and medium-term outlook requires reading the full narrative rather than just the current candle.
          Gold peaked near $4,580 to $4,600 in late May and early June before experiencing a sharp and aggressive decline that carried price all the way to the $4,060 to $4,080 lows by June 11, a drawdown of approximately $500 in less than a week. The velocity of that decline, visible in the consecutive large bearish candles between June 5 and June 11, was not a gradual correction. It was a capitulation move driven by macro repricing around central bank expectations and conflict de-escalation reducing the safe-haven premium that had built up in gold during the Hormuz closure. The June 11 lows near $4,060 to $4,080 represent a significant structural floor where buyers absorbed the entirety of that selling pressure and staged an equally aggressive recovery.
          That recovery from $4,060 to the current $4,338 area has been the defining bullish event of the past week. Price moved approximately $280 in just a few sessions, with the most powerful single-candle move occurring on June 12 when the market repriced rapidly on peace deal confirmation news. The recovery has since entered a consolidation phase between the $4,300 to $4,310 support reference and the $4,360 to $4,380 resistance band overhead, and this consolidation is where the most important near-term technical decision is being made.
          The dotted horizontal reference near $4,340 to $4,360 is the immediate battleground. Price has tested this zone from below multiple times across the past two sessions, producing modest recoveries that stall before clearing the level with conviction. A sustained 2-hour close above $4,360 would confirm that the consolidation is resolving in favor of the bulls and would trigger the next leg of the projected advance toward the $4,440 to $4,460 horizontal resistance band, which provided multiple support and resistance pivot points during the late May trading range.
          The projected path on the chart extends beyond $4,440 toward the $4,580 to $4,600 major resistance zone, which represents the pre-decline highs and the most significant supply area on the visible chart. Reaching that target requires clearing $4,360 first, then $4,440 to $4,460, and sustaining momentum through each level. The step-pattern nature of the projected advance shown on the chart is realistic given the density of horizontal reference points overhead.
          The $4,280 to $4,300 zone is the critical support floor for the current recovery structure. A sustained close below $4,280 would signal that the bounce from the $4,060 lows is failing and would risk a retest of the $4,120 to $4,140 area before any fresh bullish attempt becomes viable. The $4,060 lows are the absolute reference for the medium-term bullish thesis, and their breach would demand a complete reassessment of the peace deal repricing narrative.
          TRADE RECOMMENDATION
          BUY XAU/USD (GOLD)
          ENTRY PRICE: $4,340
          STOP LOSS: $4,200
          TAKE PROFIT: $4,600
          Risk Warnings and Disclaimers
          You understand and acknowledge that there is a high degree of risk involved in trading. Following any strategies or investment methods may lead to potential losses. The content on the site is provided by our contributors and analysts for information purposes only. You are solely responsible for determining whether any trading assets, securities, strategy, or any other product is suitable for investing based on your own investment objectives and financial situation.
          Add to Favorites
          Share
          FastBull
          Copyright © 2026 FastBull Ltd

          728 RM B 7/F GEE LOK IND BLDG NO 34 HUNG TO RD KWUN TONG KLN HONG KONG

          TelegramInstagramTwitterfacebooklinkedin
          App Store Google Play Android Windows
          Products
          Charts

          Chats

          Q&A with Experts
          Screeners
          Economic Calendar
          Data
          Tools
          Membership
          Features
          Function
          Markets
          Copy Trading
          Latest Signals
          Contests
          24/7
          Analysis
          Education
          Company
          Careers
          About Us
          Contact Us
          Advertising
          Download FastBull
          Help Center
          Feedback
          User Agreement
          Privacy Policy
          Personal Information Protection Statement
          Business

          White Label

          Broker API

          Data API

          Web Plug-ins

          Poster Maker

          Affiliate Program

          Risk Disclosure

          The risk of loss in trading financial instruments such as stocks, FX, commodities, futures, bonds, ETFs and crypto can be substantial. You may sustain a total loss of the funds that you deposit with your broker. Therefore, you should carefully consider whether such trading is suitable for you in light of your circumstances and financial resources.

          No decision to invest should be made without thoroughly conducting due diligence by yourself or consulting with your financial advisors. Our web content might not suit you since we don't know your financial conditions and investment needs. Our financial information might have latency or contain inaccuracy, so you should be fully responsible for any of your trading and investment decisions. The company will not be responsible for your capital loss.

          Without getting permission from the website, you are not allowed to copy the website's graphics, texts, or trademarks. Intellectual property rights in the content or data incorporated into this website belong to its providers and exchange merchants.

          Not Logged In

          Log in to access more features

          Connect Broker
          Become a signal provider
          Help Center
          Customer Service
          Dark Mode
          Price Up/Down Colors

          Log In

          Sign Up

          Position
          Layout
          Fullscreen
          Default to Chart
          The chart page opens by default when you visit fastbull.com