


- USDX
- XAUUSD
- XAGUSD
- WTI


Markets
Analysis
User
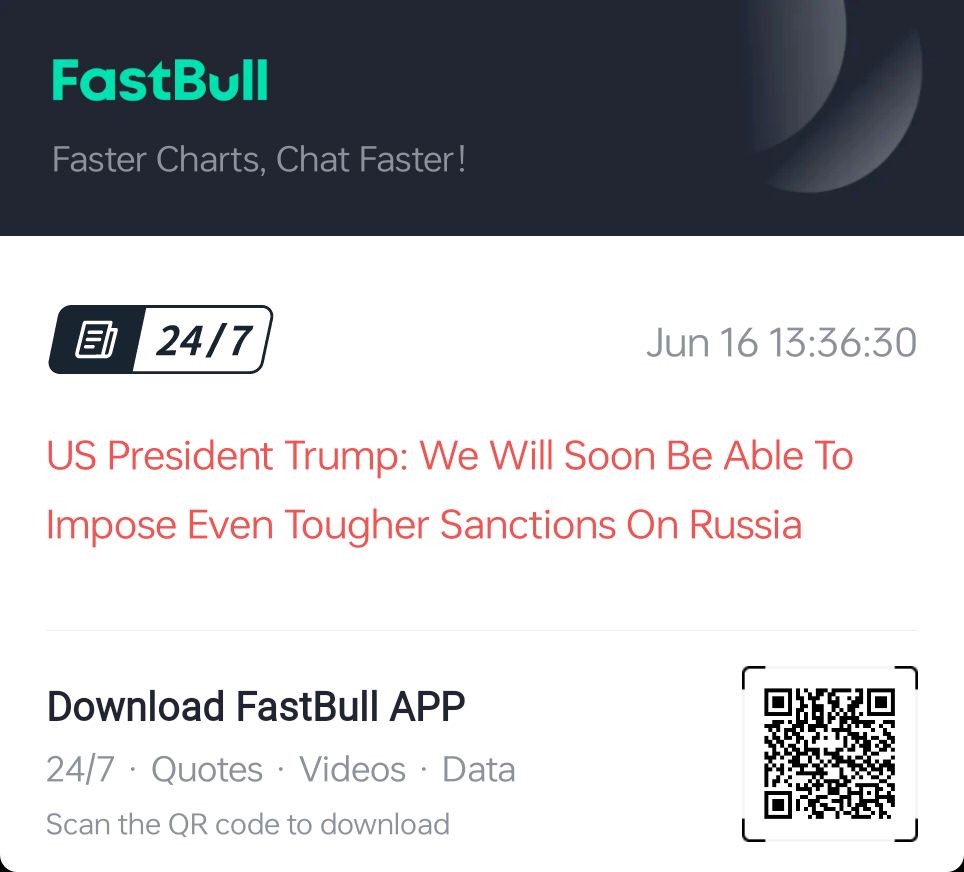
24/7
Economic Calendar
Education
Data
- Names
- Latest
- Prev


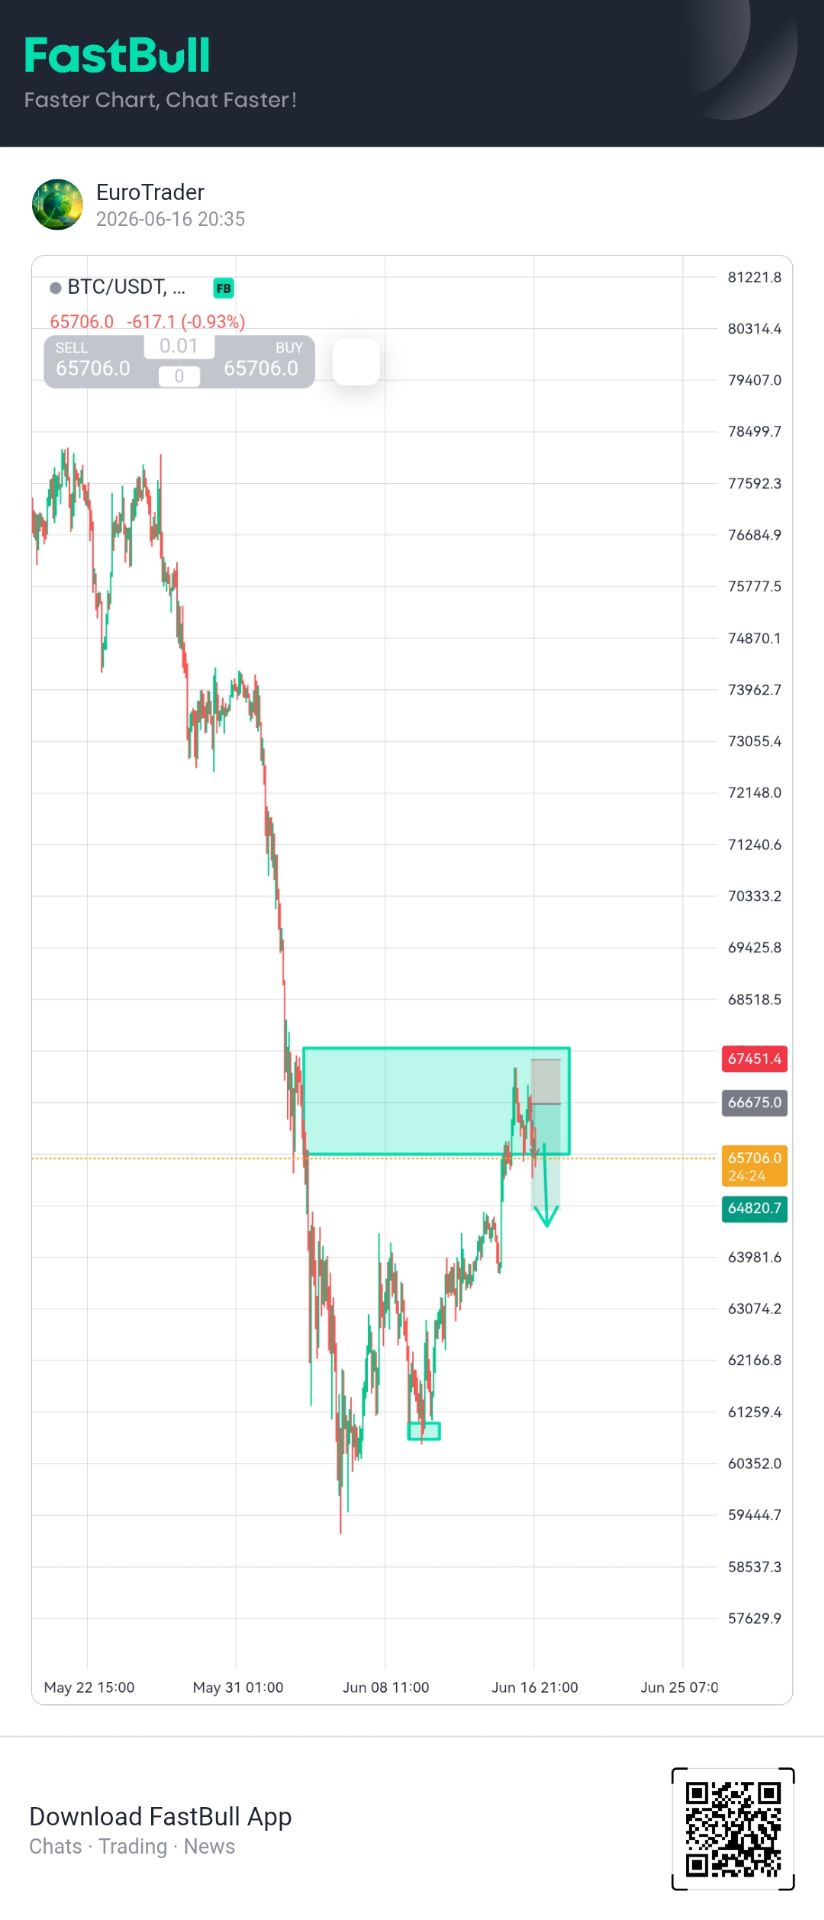

Easing tensions between the United States and Iran, combined with a recovery in market risk appetite, have helped drive a rebound across the cryptocurrency market. Although Bitcoin remains in a medium-term corrective phase, technical indicators suggest bearish momentum is fading. As long as key support levels remain intact, the market could extend its advance toward and beyond the $70,000 mark.
65969.5
Entry Price
72001.0
TP
60000.0
SL
0.0
Pips
Flat
60000.0
SL
Exit Price
65969.5
Entry Price
72001.0
TP

728 RM B 7/F GEE LOK IND BLDG NO 34 HUNG TO RD KWUN TONG KLN HONG KONG


The risk of loss in trading financial instruments such as stocks, FX, commodities, futures, bonds, ETFs and crypto can be substantial. You may sustain a total loss of the funds that you deposit with your broker. Therefore, you should carefully consider whether such trading is suitable for you in light of your circumstances and financial resources.
No decision to invest should be made without thoroughly conducting due diligence by yourself or consulting with your financial advisors. Our web content might not suit you since we don't know your financial conditions and investment needs. Our financial information might have latency or contain inaccuracy, so you should be fully responsible for any of your trading and investment decisions. The company will not be responsible for your capital loss.
Without getting permission from the website, you are not allowed to copy the website's graphics, texts, or trademarks. Intellectual property rights in the content or data incorporated into this website belong to its providers and exchange merchants.
Not Logged In
Log in to access more features


Log In
Sign Up


