Markets
News
Analysis
User
24/7
Economic Calendar
Education
Data
- Names
- Latest
- Prev


Signal Accounts for Members
All Signal Accounts
All Contests


France Trade Balance (SA) (Oct)A:--
F: --
Euro Zone Employment YoY (SA) (Q3)A:--
F: --
Canada Part-Time Employment (SA) (Nov)A:--
F: --
P: --
Canada Unemployment Rate (SA) (Nov)A:--
F: --
P: --
Canada Full-time Employment (SA) (Nov)A:--
F: --
P: --
Canada Labor Force Participation Rate (SA) (Nov)A:--
F: --
P: --
Canada Employment (SA) (Nov)A:--
F: --
P: --
U.S. PCE Price Index MoM (Sept)A:--
F: --
P: --
U.S. Personal Income MoM (Sept)A:--
F: --
P: --
U.S. Core PCE Price Index MoM (Sept)A:--
F: --
P: --
U.S. PCE Price Index YoY (SA) (Sept)A:--
F: --
P: --
U.S. Core PCE Price Index YoY (Sept)A:--
F: --
P: --
U.S. Personal Outlays MoM (SA) (Sept)A:--
F: --
U.S. 5-10 Year-Ahead Inflation Expectations (Dec)A:--
F: --
P: --
U.S. Real Personal Consumption Expenditures MoM (Sept)A:--
F: --
U.S. Weekly Total Rig CountA:--
F: --
P: --
U.S. Weekly Total Oil Rig CountA:--
F: --
P: --
U.S. Consumer Credit (SA) (Oct)A:--
F: --
China, Mainland Foreign Exchange Reserves (Nov)A:--
F: --
P: --
Japan Trade Balance (Oct)A:--
F: --
P: --
Japan Nominal GDP Revised QoQ (Q3)A:--
F: --
P: --
China, Mainland Imports YoY (CNH) (Nov)A:--
F: --
P: --
China, Mainland Exports (Nov)A:--
F: --
P: --
China, Mainland Imports (CNH) (Nov)A:--
F: --
P: --
China, Mainland Trade Balance (CNH) (Nov)A:--
F: --
P: --
China, Mainland Exports YoY (USD) (Nov)A:--
F: --
P: --
China, Mainland Imports YoY (USD) (Nov)A:--
F: --
P: --
Germany Industrial Output MoM (SA) (Oct)A:--
F: --
Euro Zone Sentix Investor Confidence Index (Dec)A:--
F: --
P: --
Canada National Economic Confidence IndexA:--
F: --
P: --
U.K. BRC Like-For-Like Retail Sales YoY (Nov)--
F: --
P: --
U.K. BRC Overall Retail Sales YoY (Nov)--
F: --
P: --
Australia Overnight (Borrowing) Key Rate--
F: --
P: --
RBA Rate Statement
RBA Press Conference
Germany Exports MoM (SA) (Oct)--
F: --
P: --
U.S. NFIB Small Business Optimism Index (SA) (Nov)--
F: --
P: --
Mexico 12-Month Inflation (CPI) (Nov)--
F: --
P: --
Mexico Core CPI YoY (Nov)--
F: --
P: --
Mexico PPI YoY (Nov)--
F: --
P: --
U.S. Weekly Redbook Index YoY--
F: --
P: --
U.S. JOLTS Job Openings (SA) (Oct)--
F: --
P: --
China, Mainland M1 Money Supply YoY (Nov)--
F: --
P: --
China, Mainland M0 Money Supply YoY (Nov)--
F: --
P: --
China, Mainland M2 Money Supply YoY (Nov)--
F: --
P: --
U.S. EIA Short-Term Crude Production Forecast For The Year (Dec)--
F: --
P: --
U.S. EIA Natural Gas Production Forecast For The Next Year (Dec)--
F: --
P: --
U.S. EIA Short-Term Crude Production Forecast For The Next Year (Dec)--
F: --
P: --
EIA Monthly Short-Term Energy Outlook
U.S. API Weekly Gasoline Stocks--
F: --
P: --
U.S. API Weekly Cushing Crude Oil Stocks--
F: --
P: --
U.S. API Weekly Crude Oil Stocks--
F: --
P: --
U.S. API Weekly Refined Oil Stocks--
F: --
P: --
South Korea Unemployment Rate (SA) (Nov)--
F: --
P: --
Japan Reuters Tankan Non-Manufacturers Index (Dec)--
F: --
P: --
Japan Reuters Tankan Manufacturers Index (Dec)--
F: --
P: --
Japan Domestic Enterprise Commodity Price Index MoM (Nov)--
F: --
P: --
Japan Domestic Enterprise Commodity Price Index YoY (Nov)--
F: --
P: --
China, Mainland PPI YoY (Nov)--
F: --
P: --
China, Mainland CPI MoM (Nov)--
F: --
P: --
Italy Industrial Output YoY (SA) (Oct)--
F: --
P: --


No matching data
Latest Views
Latest Views
Trending Topics
Top Columnists
Latest Update
White Label
Data API
Web Plug-ins
Affiliate Program
View All

No data
Amid a blizzard of contradictory signals, it's becoming increasingly difficult to get any visibility on the U.S. labor market.
Amid a blizzard of contradictory signals, it's becoming increasingly difficult to get any visibility on the U.S. labor market. But of all the numbers that feed into the all-important unemployment rate, the one worth paying most attention to may be continuing weekly jobless claims.
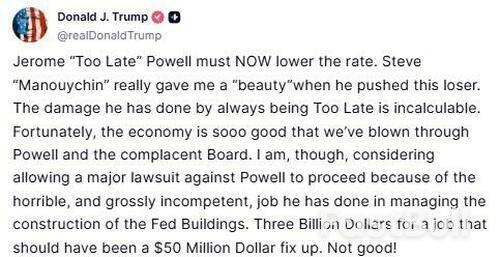
Federal Reserve Chair Jerome Powell has said that while he and his colleagues look at the "totality" of the data, the best gauge of the health of the labor market is the unemployment rate. That's currently 4.2%, low by historical standards, and consistent with an economy operating at full employment.
But it is a lagging indicator, meaning that once it starts to rise sharply, the economy will probably already be in a very precarious position. And it is also being depressed by labor demand and supply factors unique to the U.S.'s current high tariff, low immigration era.
Economic growth is slowing. Broadly speaking, it is running at an annual rate of just over 1%, half the pace seen in the last few years. Unsurprisingly, firms' hiring is slowing too.The latest Job Openings and Labor Turnover Survey, or JOLTS, showed hiring in June was the weakest in a year, while July's nonfarm payrolls report and previous months' revisions were so disappointing that President Donald Trump fired the head of the agency responsible for collecting the data.
But the unemployment rate isn't rising, largely because firms aren't firing workers. Why? Perhaps because they are banking on tariff and inflation uncertainty lifting in the second half of the year. It's also possible that firms are still scared form the post-pandemic labor shortages.Whatever the reason, the pace of layoffs simply has not picked up, the monthly JOLTS surveys show. Layoffs in June totaled 1.6 million, below the averages of the last one, two and three years.Meanwhile, lower immigration, increased deportations, and fewer people re-entering the labor force are offsetting weak hiring, thus keeping a lid on the unemployment rate. The labor force participation rate in July was 62.2%, the lowest since November 2022.
And what about weekly jobless claims, another key variable in the labor market picture? In previous slowdowns, rising layoffs would be reflected in a spike in the number of people claiming unemployment benefits for the first time.That's not happening either. Last week's 226,000 initial claims were right at the average for the past year, and only a few thousand higher than the averages over the past two and three years."It's a low fire, low hire economy," notes Oscar Munoz, U.S. rates strategist at TD Securities.

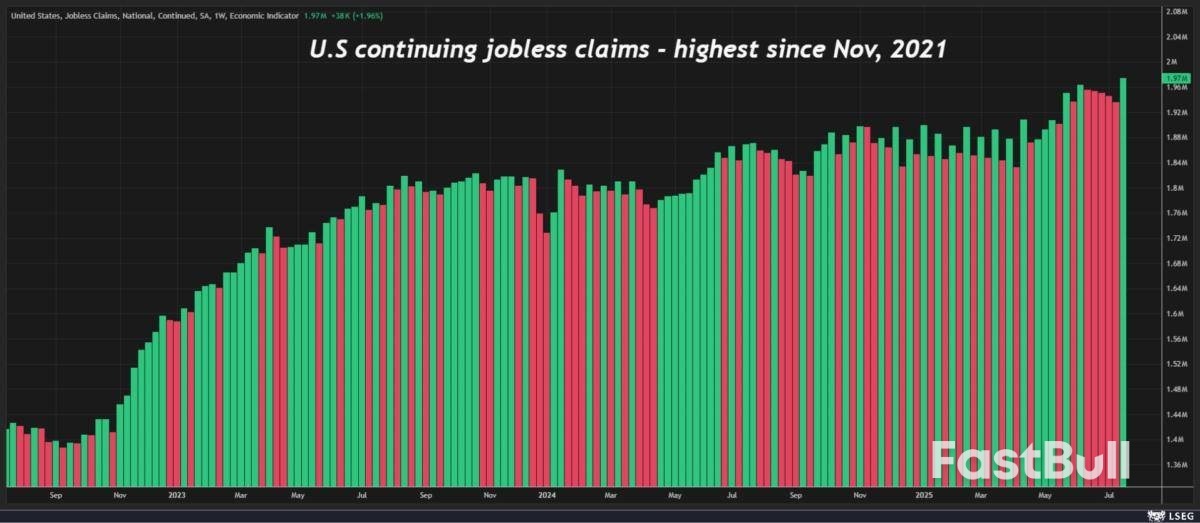
One high-frequency number that has gone under the radar, but which merits more attention is continuing jobless claims, which measures the number of workers continuing to file for unemployment benefits after losing their jobs. Rising continued claims suggest people actively looking for a job are struggling to get one, a sign that the labor market could be softening.
That figure spiked last week to 1.97 million, the highest since November 2021, which in theory should put upward pressure on the unemployment rate.Using the 'stock' versus 'flow' analogy, continuing claims are the 'stock,' and weekly claims are the 'flow'. Everyone will have their own view on what's more important, but right now initial claims are offering no guidance while continuing claims are pointing to softening in the job market.
Munoz and his colleagues at TD Securities estimate that continuing claims of around 2.2 million would be consistent with an unemployment rate of 4.5%, a level of joblessness most economists agree would prompt the Fed to trim rates.That's also the year-end unemployment rate in the Fed's last economic projections from June, a set of forecasts which also penciled in 50 bps of easing by December.An unemployment rate of 4.4% would probably tip the balance on the Federal Open Market Committee, while 4.3% would make it a much closer call, perhaps a coin toss.
Further muddying the picture, other indicators suggest the labor market is ticking along nicely. July's payrolls report showed that average hourly earnings last month rose at a 3.9% annual rate, consistent with the level seen in the past year. And the average number of hours worked was 34.3 hours, right at the mean for the past two years.These numbers and the JOLTS data are released monthly, and there will be one more of each before the Fed's September 16-17 policy meeting.But if the increased focus on the unemployment rate means investors want a more regular labor market temperature check, they should keep a close eye on weekly continuing claims.

The yield curve is steepening, with 10-year yields spiking from the CPI aftermath (where focus has turned to the red hot Supercore inflation print) and hitting session highs after Trump took to Truth Social to slam Jerome Powell again, just two weeks after the two of them appeared to have patched things up.
After several days without any direct attack on Powell, Trump resumed the onslaught and said he’s considering allowing a lawsuit against the Fed chair related to the building work at the central bank’s buildings.

As Bloomberg notes, the jump in yields might serve as a reminder of what we have learnt over and over again in Latin America - when the executive tries to press for lower rates, borrowing costs tend to go up rather than down.

Trump aside, the rates market took a relief straight after the US CPI release as tariffs pass-through to goods prices looked light. However, the 32bp m/m core CPI in July was still the hottest since January while the Supercore CPI print was especially jarring.
Also, UBS notes that the July PCE number is likely to be a hot one as medical care services printed 79bp m/m. PCE places 20% weights on medical care while CPI only puts 6% weights. Ultimately, the Fed targets PCE not CPI.


The move came as U.S. inflation data boosted expectations for a September Federal Reserve rate cut and institutional demand for ETH ETFs hit record highs.
The July Consumer Price Index (CPI) rose 2.7% year-over-year, slightly below the 2.8% forecast, lifting the probability of a September rate cut to 82.5%. ETH jumped 3.2% immediately after the release, outpacing Bitcoin’s 3.1% advance in the same period. Lower inflation typically eases monetary policy pressure, making yield-bearing assets like staked ETH more attractive to investors.
U.S. spot Ethereum ETFs saw over $1 billion in net inflows on August 12, led by BlackRock’s ETHA product with a record $639 million single-day haul.
Total ETH ETF assets under management have surged to $19.2 billion, representing a 58% increase in the past month. With just 3.3 million ETH held across all ETFs and post-EIP-1559 net issuance at roughly 8,000 ETH per day, institutional buying is absorbing supply at a rapid pace.
Corporate adoption is also intensifying. Nasdaq-listed BitMine Immersion (BMNR) unveiled plans to raise $20 billion for ETH acquisitions, following 180 Life Sciences’ $349 million purchase earlier this month.
Public companies now control about 5% of Ethereum’s circulating supply, positioning ETH as both a yield-generating growth asset and a balance sheet hedge. If executed, BMNR’s plan alone could remove 45 days’ worth of ETH issuance from the open market.
On the technical front, ETH’s price has broken above the $4,300 resistance level, with the Relative Strength Index (RSI) hovering near 66, signaling strong but not yet overbought momentum. The MACD remains in positive territory, supporting the bullish trend. Sustaining above $4,350 could open the door for a push toward the all-time high region near $4,800.

With macroeconomic tailwinds, surging ETF demand, and corporate balance sheet allocations tightening supply, Ethereum’s rally could extend into the coming weeks—especially if the Federal Reserve delivers the expected rate cut in September.
The information provided in this article is for informational purposes only and does not constitute financial, investment, or trading advice. Coindoo.com does not endorse or recommend any specific investment strategy or cryptocurrency. Always conduct your own research and consult with a licensed financial advisor before making any investment decisions.
White Label
Data API
Web Plug-ins
Poster Maker
Affiliate Program
The risk of loss in trading financial instruments such as stocks, FX, commodities, futures, bonds, ETFs and crypto can be substantial. You may sustain a total loss of the funds that you deposit with your broker. Therefore, you should carefully consider whether such trading is suitable for you in light of your circumstances and financial resources.
No decision to invest should be made without thoroughly conducting due diligence by yourself or consulting with your financial advisors. Our web content might not suit you since we don't know your financial conditions and investment needs. Our financial information might have latency or contain inaccuracy, so you should be fully responsible for any of your trading and investment decisions. The company will not be responsible for your capital loss.
Without getting permission from the website, you are not allowed to copy the website's graphics, texts, or trademarks. Intellectual property rights in the content or data incorporated into this website belong to its providers and exchange merchants.
Not Logged In
Log in to access more features

FastBull Membership
Not yet
Purchase
Log In
Sign Up