

Markets
News
Analysis
User
24/7
Economic Calendar
Education
Data
- Names
- Latest
- Prev


Signal Accounts for Members
All Signal Accounts
All Contests
 U.K. Trade Balance Non-EU (SA) (Oct)
A:--
F: --
P: --
U.K. Trade Balance (Oct)A:--
F: --
P: --
U.K. Services Index MoMA:--
F: --
P: --
U.K. Construction Output MoM (SA) (Oct)A:--
F: --
P: --
U.K. Industrial Output YoY (Oct)A:--
F: --
P: --
U.K. Trade Balance (SA) (Oct)A:--
F: --
P: --
U.K. Trade Balance EU (SA) (Oct)A:--
F: --
P: --
U.K. Manufacturing Output YoY (Oct)A:--
F: --
P: --
U.K. GDP MoM (Oct)A:--
F: --
P: --
U.K. GDP YoY (SA) (Oct)A:--
F: --
P: --
U.K. Industrial Output MoM (Oct)A:--
F: --
P: --
U.K. Construction Output YoY (Oct)A:--
F: --
P: --
 France HICP Final MoM (Nov)
A:--
F: --
P: --
 China, Mainland Outstanding Loans Growth YoY (Nov)
A:--
F: --
P: --
China, Mainland M2 Money Supply YoY (Nov)A:--
F: --
P: --
China, Mainland M0 Money Supply YoY (Nov)A:--
F: --
P: --
China, Mainland M1 Money Supply YoY (Nov)A:--
F: --
P: --
 India CPI YoY (Nov)
A:--
F: --
P: --
India Deposit Gowth YoYA:--
F: --
P: --
 Brazil Services Growth YoY (Oct)
A:--
F: --
P: --
 Mexico Industrial Output YoY (Oct)
A:--
F: --
P: --
 Russia Trade Balance (Oct)
A:--
F: --
P: --
 Philadelphia Fed President Henry Paulson delivers a speech
 Canada Building Permits MoM (SA) (Oct)
A:--
F: --
P: --
Canada Wholesale Sales YoY (Oct)A:--
F: --
P: --
Canada Wholesale Inventory MoM (Oct)A:--
F: --
P: --
Canada Wholesale Inventory YoY (Oct)A:--
F: --
P: --
Canada Wholesale Sales MoM (SA) (Oct)A:--
F: --
P: --
 Germany Current Account (Not SA) (Oct)
A:--
F: --
P: --
U.S. Weekly Total Rig CountA:--
F: --
P: --
U.S. Weekly Total Oil Rig CountA:--
F: --
P: --
 Japan Tankan Large Non-Manufacturing Diffusion Index (Q4)
--
F: --
P: --
Japan Tankan Small Manufacturing Outlook Index (Q4)--
F: --
P: --
Japan Tankan Large Non-Manufacturing Outlook Index (Q4)--
F: --
P: --
Japan Tankan Large Manufacturing Outlook Index (Q4)--
F: --
P: --
Japan Tankan Small Manufacturing Diffusion Index (Q4)--
F: --
P: --
Japan Tankan Large Manufacturing Diffusion Index (Q4)--
F: --
P: --
Japan Tankan Large-Enterprise Capital Expenditure YoY (Q4)--
F: --
P: --
U.K. Rightmove House Price Index YoY (Dec)--
F: --
P: --
China, Mainland Industrial Output YoY (YTD) (Nov)--
F: --
P: --
China, Mainland Urban Area Unemployment Rate (Nov)--
F: --
P: --
 Saudi Arabia CPI YoY (Nov)
--
F: --
P: --
 Euro Zone Industrial Output YoY (Oct)
--
F: --
P: --
Euro Zone Industrial Output MoM (Oct)--
F: --
P: --
Canada Existing Home Sales MoM (Nov)--
F: --
P: --
Euro Zone Total Reserve Assets (Nov)--
F: --
P: --
U.K. Inflation Rate Expectations--
F: --
P: --
Canada National Economic Confidence Index--
F: --
P: --
Canada New Housing Starts (Nov)--
F: --
P: --
U.S. NY Fed Manufacturing Employment Index (Dec)--
F: --
P: --
U.S. NY Fed Manufacturing Index (Dec)--
F: --
P: --
Canada Core CPI YoY (Nov)--
F: --
P: --
Canada Manufacturing Unfilled Orders MoM (Oct)--
F: --
P: --
Canada Manufacturing New Orders MoM (Oct)--
F: --
P: --
Canada Core CPI MoM (Nov)--
F: --
P: --
Canada Manufacturing Inventory MoM (Oct)--
F: --
P: --
Canada CPI YoY (Nov)--
F: --
P: --
Canada CPI MoM (Nov)--
F: --
P: --
Canada CPI YoY (SA) (Nov)--
F: --
P: --
Canada Core CPI MoM (SA) (Nov)--
F: --
P: --

No matching data
Latest Views
Latest Views
Trending Topics
Top Columnists
Latest Update
White Label
Data API
Web Plug-ins
Affiliate Program
View All
No data
Historically, September is the weakest month for global equities—S\&P 500, Nasdaq, and MSCI World often struggle. Gold and oil also tend to underperform, though Fed policy, labor data, and inflation could reshape 2025’s path.


Canada is often portrayed as a land of freedom, opportunity, and prosperity. Reality, however, tells a different story...
Statist policies, crushing taxes, bloated bureaucracy, and a society overtaken by woke ideology have shattered Canada. This is a cautionary tale for those looking at Canada as an ideal living space. If you are asking yourself what living in Canada is like, let me explain: Canada is not a land of fulfilled dreams but of enduring harsh conditions and barely getting by.
As if economic hardships aren’t enough, Canadians are also oppressed by the Orwellian newspeak that woke culture is creating. If you speak your mind, you’re labeled a fascist. If you question social policies, you’re accused of microaggressions.There are no best places to live in Canada anymore. As a Canadian, I see little chance of Canada becoming livable again. Since I founded Expat Money in 2017, I have been helping expats build their Plan-Bs to protect their wealth and freedom and leave countries like this one.
Let’s look at the unfortunate condition that Canada has fallen into.
The strict quarantine measures and harsh government interventions implemented in Canada during the COVID-19 hysteria were shameful. The government expanded police and administrative powers to smash public backlash against its COVID policies.A significant protest movement called The Freedom Convoy began in early 2022. Truckers and citizens held large demonstrations in Ottawa against vaccination mandates, harsh pandemic restrictions, and the government’s authoritarian tendencies.
Former Prime Minister Trudeau used extraordinary powers to freeze the bank accounts of protesters and crack down on activists. Individual and property rights were arbitrarily violated.The Canadian government imposed mandatory vaccinations on federal employees, healthcare workers, and those in the transportation sector, turning personal health decisions into state mandates. Those who were not vaccinated were suspended from their jobs, their travel rights were restricted, and they were ostracized from society. Even the private sector was coerced to impose vaccinations under government pressure.
Moreover, harsh lockdowns and restricted entry into the country forced businesses into bankruptcy. Massive numbers of people lost their jobs, and the government’s financial structure was severely damaged.
The problems aren’t limited to elections. In recent years, woke ideology has overtaken Canada’s politics, education system, and workplace. This “progressive” ideology has replaced individual freedoms and meritocracy with the so-called principle of inclusivity and equity. As a result, freedom of speech has been destroyed, social engineering has increased, and social polarization has deepened.In Canada, laws enacted under the guise of “combatting hate speech” have imposed mandatory language use by the government, determining how individuals should speak.
Now, we have another Bill C-11 to update the Broadcasting Act. The government’s media watchdog, the CRTC, will now be able to monitor online platforms such as YouTube, TikTok, and Spotify. Bill C-11 is a censorship tool to kill free speech in Canada. The government may have sugar-coated the law by saying, “We support Canadian content,” but at its core, it’s an attempt to take control of the internet. The government deciding what content is “sufficiently Canadian” will soon become a matter of deciding what content is appropriate, approved, and safe.
What about Bill C-18? This is another example of an intervention that legislates internet censorship under the pretext of “protecting the independent press.” Bill C-18 requires internet platforms (especially companies like Google and Meta) to pay media outlets for news content. The government is turning content sharing into an economic penalty to extract money from big tech companies.Because of this law, platforms like Google and Meta have decided to remove news content completely. In other words, the government’s move to “access information” has actually restricted access to information.
Similarly, due to cancel culture, academics, business people, and members of the media are censored, fired, and subject to social lynching when they voice different views. Diversity, equity, and inclusion (DEI) policies, especially in business and academic institutions, cause decisions to be made based on identity rather than merit. Canadian universities have been degraded from institutions that encourage intellectual freedom into ideological centres where a singular type of thinking is imposed. Companies must prioritize political correctness over efficiency and productivity in business life. Canada has shifted from a society based on individual freedom and voluntary cooperation to a system governed by the ideological impositions of the government.
Indicators of Canada’s political and economic collapse can also be traced to the individual level. The rapid increase in Medical Assistance in Dying (MAiD) applications in Canada has led to deep debate on personal freedoms, ethical values, and the role of the state in the country.
Canada has the fastest-growing assisted suicide program in the world. When MAiD was legalized in 2016, it only included individuals with terminal illnesses. However, over time, the criteria were relaxed and expanded to include psychological disorders or illnesses that do not have a natural death period. In 2021, approximately 10,000 people ended their lives under MAiD. This number constitutes 3.3% of all deaths. Even people who were experiencing financial difficulties or housing problems resorted to euthanasia, causing heated arguments in the public domain.
In the face of all the challenges, assuming Canada has a functioning social welfare state would be unwise. Canada’s health system is seriously unreliable because of long waiting times, overburdened hospitals, and staff shortages.Before moving to Canada, be mindful that you can wait months to years for doctor’s appointments and surgeries. The shortage of doctors and nurses severely disrupts health services. Excessive bureaucracy and limited private health services make the health system even more inefficient.
The federal government’s drama is not Canada’s only political issue. The political conflict between the federal and provincial governments is becoming a serious problem.
There are several main disagreements between the federal and provincial governments:
● First, the federal government’s carbon tax has drawn fierce criticism from energy-independent provinces such as Alberta, Saskatchewan, and Ontario.
● Second, the federal government demands that the provinces spend more on healthcare financing, while the provinces say they are underfunded and subject to excessive federal intervention.
● Third, immigration has exacerbated the housing crisis and the burden on public services in large provinces such as Ontario, Quebec, and British Columbia. The provinces demand more funding, saying they shoulder much of the cost burden, but funding is unavailable.
● Fourth, the federal government’s policies restricting fossil fuel use continue to economically harm provinces such as Alberta and Saskatchewan, which depend on oil and gas.
It’s no surprise that many people in Alberta and the Prairie provinces responded positively to Trump’s annexation proposal. It reflects a deep and long-standing frustration with federal control over energy policy. At the same time, a grassroots “Make Alberta Great Again” movement is gaining real traction. Pro-separation initiatives are picking up momentum, with growing calls for a referendum on Alberta’s independence.
Even Bill 54, passed in May 2025, lowered the threshold required to trigger a referendum on the province’s sovereignty. Now it’s easier for separatist groups to push for a vote.I was in Alberta last year and met with several people involved in the movement in person. We spoke at length about the political landscape, their frustrations, and their hopes for Alberta’s future. Many of them told me that, while they believe strongly in the cause, they also know how easily their involvement could make them political targets. That’s why they’re working on their Plan-B strategies to protect themselves and their families if things take a turn for the worse.
Strict government regulations and high tax rates in Canada negatively impact economic growth and entrepreneurship by increasing the financial burden on individuals and businesses.Let me give you an example. Ontario’s total income tax payment can be as high as 53.5%. These high tax rates reduce the disposable income of individuals and businesses and restrict economic mobility. Under the guise of “Tax the rich” and “Pay your fair share,” the Canadian government began taxing capital gains over $250,000 CAD at up to 66.6% starting in 2024. Being an entrepreneur or creating economic productivity in Canada is one of the government’s favourite activities to punish.
Rising real estate prices, the cost of essential consumer goods, and transportation have greatly increased the economic burden on individuals. Real estate prices have reached astronomical levels in cities like Vancouver and Toronto. This fact makes home ownership nearly impossible for the middle class. The lack of affordable housing options is threatening life in Canada.
With average home prices pushing $730,000 CAD ($536,000 USD), double-digit inflation on food and energy, and yet another round of carbon taxes, everyday life in Canada has become flat-out unaffordable. More and more people are waking up to the reality that they can live better, in places like Latin America, for a fraction of the cost and without being punished for simply trying to get ahead.
Most people seeking to migrate to Canada think about living in Toronto. The average rent for a one-bedroom apartment in Toronto is around $ 2,500 CAD ($1,700 USD). If your job is in Vancouver, the average rent for a one-bedroom apartment is around $2,700 CAD ($1,900 USD).Living expenses in Toronto and Vancouver are sky-high, and if you’re hoping Montreal offers a more affordable alternative, you’ll be disappointed—it’s just as costly. Factor in additional expenses for your family, and Canada quickly becomes an impractical place to invest in or build your future. It is difficult to see the benefits of living there.
The rapid growth of Canada’s immigrant population has also become another socio-economic issue. Canada does not have a dynamic market economy that can absorb all immigrants without lowering the standard of living of other citizens. Therefore, economic difficulties have not only caused immigrants to become targets but also a threat to social peace.
Do you recall the political debate that flared up after Trudeau’s resignation, revealing Canada’s polarized politics? Canadian politics was left in confusion about which way to turn after U.S. President Donald Trump hinted at annexing Canada as the 51st state.What an absolutely painful circus to watch unfold. After being thoroughly humiliated by Trump and losing whatever political capital he had left, Trudeau stepped down, hoping to give the Liberals one last shot at survival in the next election.
The Liberals wasted no time in installing Mark Carney, a globalist even more elitist than Trudeau, as Prime Minister. As a career technocrat, Carney’s credentials read like a who’s who of globalist power centres—Goldman Sachs, the Bank of Canada, the Bank of England, and the World Economic Forum.When I saw that the so-called conservative Pierre Poilievre was positioned to run against Carney in the snap elections on April 28, 2025, it became obvious that the entire contest was pure theatre. Poilievre played his part well, talking tough, staying on script, and never crossing the lines he wasn’t supposed to. In an election where the outcome was never in doubt, Carney picked up where Trudeau left off.
What’s truly hilarious is that Canadians rallied behind Carney, thinking he was the tough guy who could stand up to Trump, as if a globalist banker could salvage national pride. They saw him as the unifier for the challenges ahead, not realizing he was just the next polished face of the same worn-out agenda. They did not hesitate to choose a copy of the same man as their hope, as if they had forgotten why they had withdrawn their support for Trudeau.
Watching these painful realities from a distance, I feel compelled to speak the truth. Liberals and conservatives are inflicting irreparable wounds on social cohesion without knowing that the system itself is rigged. Political scandals, unfulfilled campaign promises, and a lack of transparency continue to fuel growing skepticism toward Canadian leaders. My only hope is that more people begin to realize there are far better places to live and truly thrive outside of Canada.
Canada is no longer worth the debate. Broken systems, high taxes, lost freedoms, there’s nothing left to fix. The smart ones aren’t waiting. They’re departing.
It’s time to stop calculating the pros and cons of living in Canada. There are no advantages at all. Canada is a country stuck under high taxes, failing public services, ideological impositions, and an increasingly authoritarian government. Buying a house has become a dream, healthcare a lottery, and freedom of expression a luxury.Even worse, despite all these problems, there is no will to fix Canada’s future. Canada has become divided by ideological wars between ever-growing state control and failed economic policies. Simply put, the best place to live in Canada doesn’t exist.
The answer for those looking to secure their future is to look beyond Canada. If you don’t want to be penalized for your success, crushed by high taxes, and deprived of your fundamental rights, now is the time to explore alternative countries that genuinely value freedom and opportunity.
The truth is, Canada’s decline is just one piece of a much bigger global pattern. The warning signs are everywhere: collapsing economies, overreaching governments, and shrinking personal freedoms. You don’t have to wait until it’s too late—or stay trapped in a system that’s stacked against you. There’s a better way forward, and the time to act is now. That’s why we’re urging you to join Doug Casey’s urgent online video event, where he’ll reveal his proven strategy to survive and thrive during the coming collapse. You’ll learn exactly how to secure a real Plan B with second passports, offshore banking, and the kind of freedom insurance that governments can’t take away from you. Reserve your spot here before it’s too late.
 Daily Light Crude Oil Futures


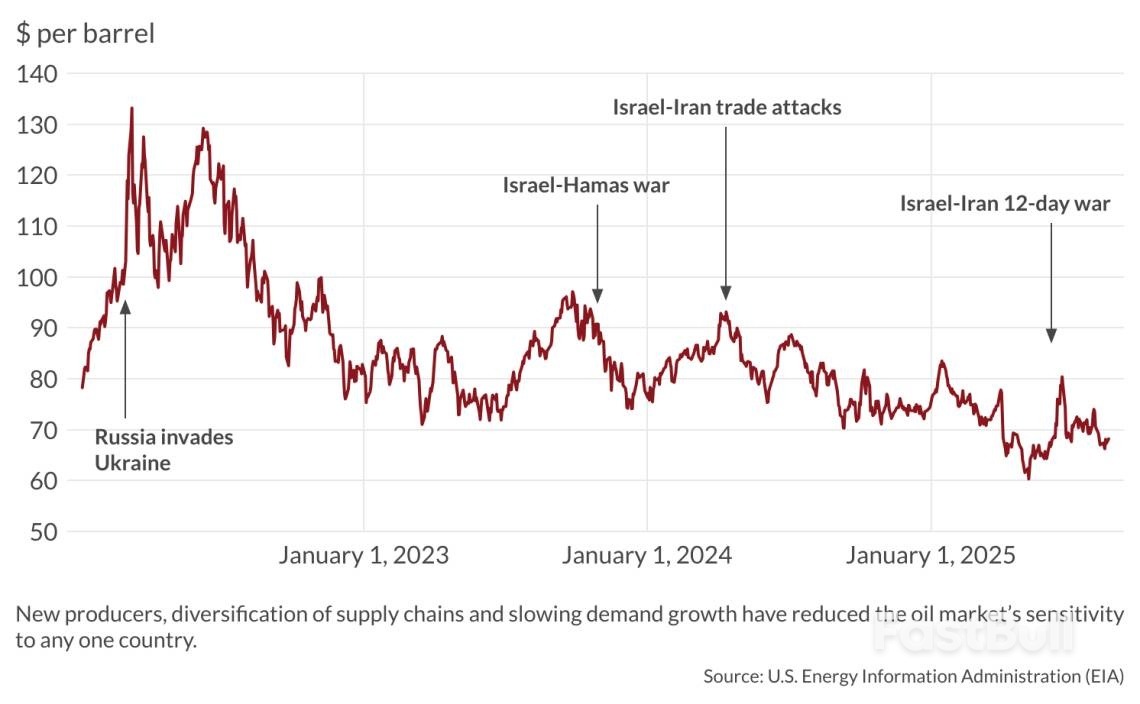
Iran remains a major oil producer, but its actual influence on global oil markets has declined considerably. This stems not only from sanctions, which have often fallen short of their goals, but also from fundamental structural changes in the global oil landscape. The rise of new producers, the diversification of supply chains and slower demand growth have all reduced the market’s sensitivity to any single country, including Iran.
This shift was evident during recent tensions involving the United States, Israel and Iran. While the rhetoric and military posturing raised concerns, oil markets remained largely calm. Critically, there were no direct disruptions to oil production or trade routes – particularly the Strait of Hormuz, which Iran itself relies on to export crude. As a result, there were no significant supply losses. Oil prices spiked briefly, but the reaction was modest and short-lived. The oil market’s restraint reflected not Iranian deterrence or strength, but an increasing global capacity to absorb shocks.
Nevertheless, Tehran was eager to project an image of resilience and victory. Yet behind the political narrative, its sway in oil markets and its ability to influence prices or global supply dynamics has steadily eroded. The strong cards it once held as a producer have been weakened by internal issues, including chronic underinvestment, and more importantly, by external factors beyond its control.
Sanctions have undoubtedly constrained Iran, but they are porous. China’s continued purchases of Iranian oil, often at a discount, and its role in helping Iran circumvent restrictions have kept export volumes afloat. Nonetheless, this has not translated into real market power. With enforcement spread thin and global supply tightening at times, Iran has remained relevant but not dominant.
If sanctions on Iran are lifted, neither a rapid surge in production nor exports is likely. The country is already producing and exporting at relatively high levels, and any further increase would require substantial investment and time. Conversely, if sanctions are tightened, Iran’s economy would face further strain, but the global oil market would be unlikely to experience a major disruption, particularly if other Organization of Petroleum Exporting Countries (OPEC) members continued to raise output.
If stricter sanctions on Tehran coincide with a substantial curtailment of Russian oil, the world’s third-largest producer, Iranian barrels could temporarily gain strategic value. Still, this effect would probably be short-lived, as other producers, including the U.S. and Gulf states, can compensate. In short, the global oil market is well-supplied.
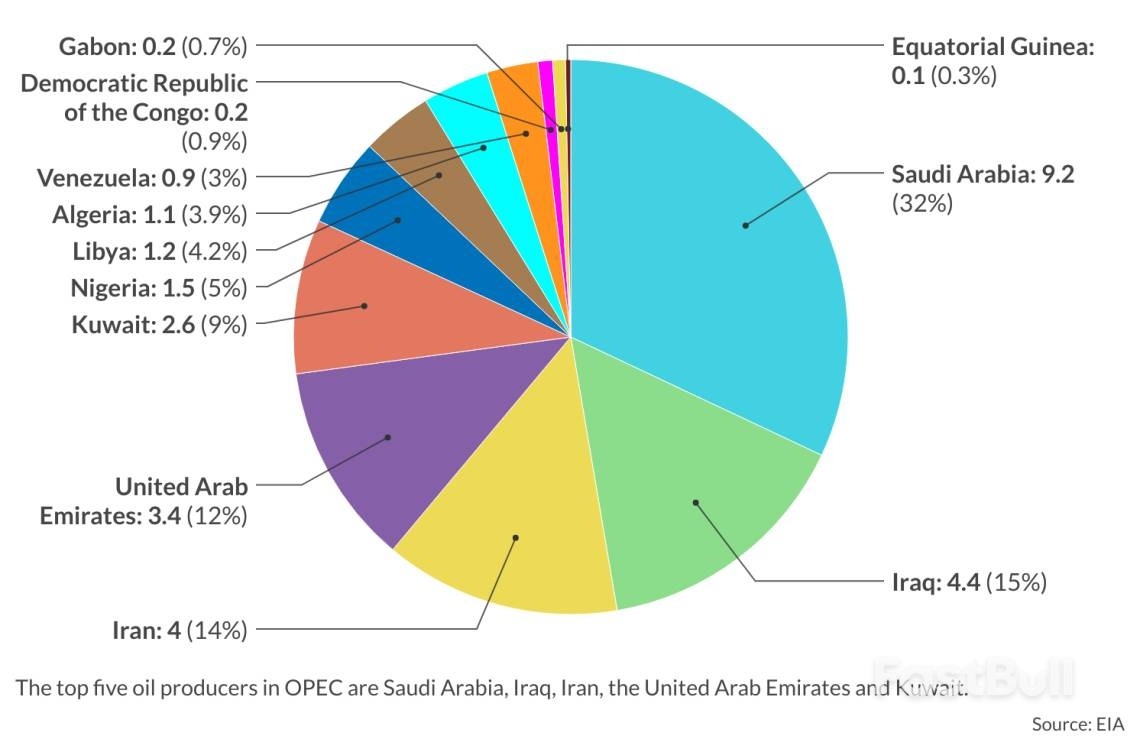
Iran possesses the world’s fourth-largest proven oil reserves, accounting for 9 percent of the global total, behind Venezuela, Saudi Arabia and Canada. It also has the second-largest proven natural gas reserves, with a 17 percent share, second only to Russia. It is the third-largest crude oil producer within OPEC and is the fourth-largest exporter.
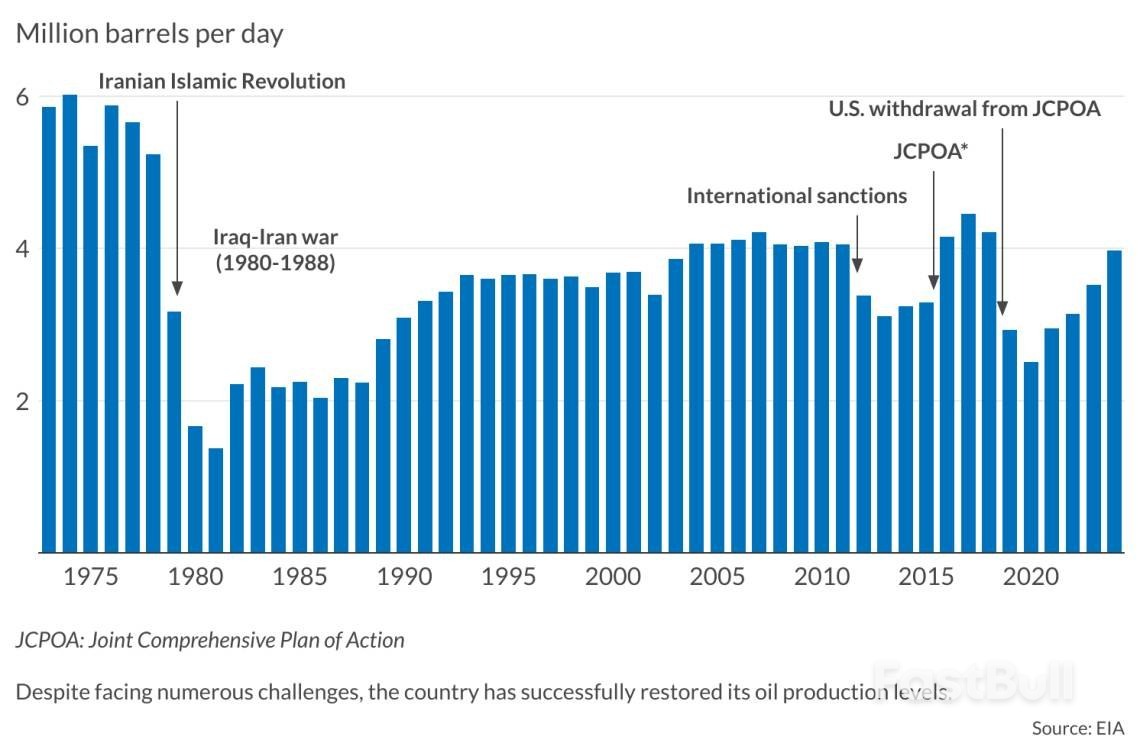
As a founding member of OPEC, Iran once held considerable influence within the organization, at times nearly rivalling Saudi Arabia’s dominance. At its peak in 1974, Iran was producing over 6 million barrels per day (mb/d), second only to Saudi Arabia’s 8.4 mb/d, while Iraq trailed at just 1.9 mb/d. However, the Iran-Iraq War (1980-1988), prolonged sanctions and limited foreign investment have since constrained the country’s production potential.
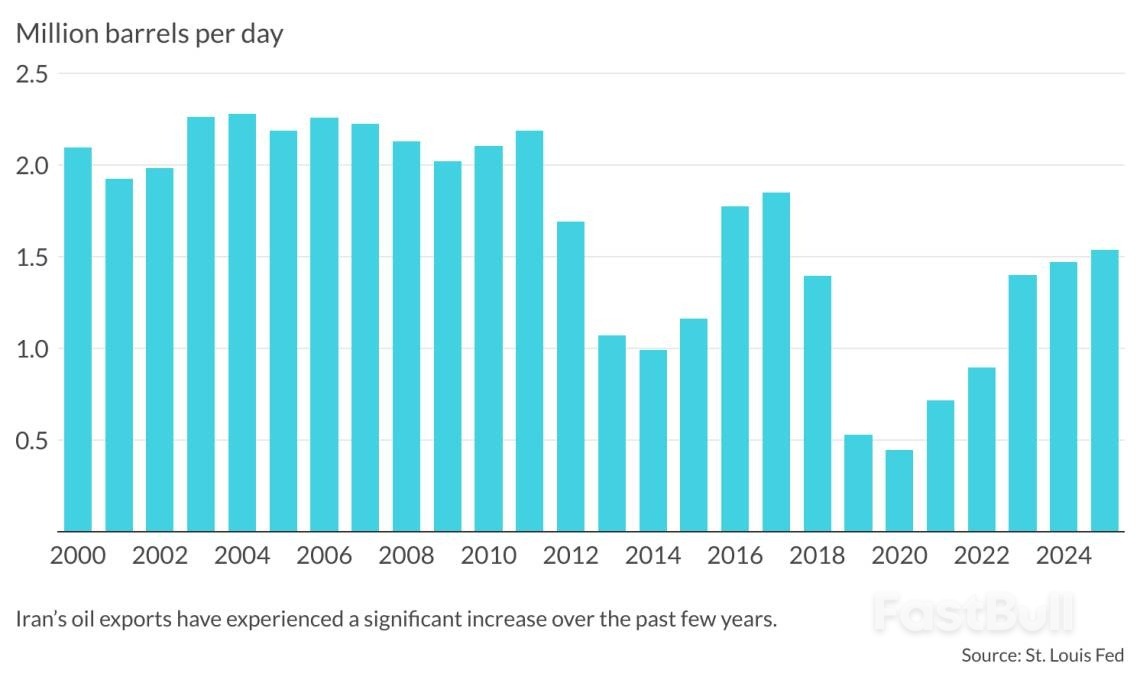
Despite these setbacks, Iran has repeatedly demonstrated resilience. Following the imposition of sanctions on its energy sector by the U.S. and the European Union in 2011 and 2012, the country’s oil exports were cut in half by 2015. But after the Joint Comprehensive Plan of Action (JCPOA) was signed in 2015, where Iran agreed to limit its nuclear program in exchange for the lifting of economic penalties, oil production rebounded swiftly. Within two years, output rose by 1.3 mb/d, and crude oil exports increased by over 1 mb/d within a year, returning to pre-sanctions levels.
The U.S. withdrawal from the JCPOA in 2018 during the first administration of President Donald Trump and its reinstatement of unilateral sanctions targeting Iran’s oil sector caused another sharp decline. Production fell by 1.9 mb/d within a year, and in October 2020 reached its lowest level since 1989.
Even so, Iran has gradually rebuilt output, recording one of the largest increases in oil production among OPEC members between 2021 and 2024. Notably, Iran is exempt from OPEC production quotas due to the ongoing sanctions, allowing it to maximize production and exports. In 2024, its oil output reached a post-sanctions annual high of 4 mb/d.
Iran’s oil exports have surged in recent years, tripling from approximately 400,000 barrels per day during the height of the Trump administration’s “maximum pressure” campaign to around 1.5 mb/d in 2024. This resurgence has been enabled by a combination of lax sanctions enforcement and Iran’s persistent efforts to circumvent restrictions, often with the support of key trading partners such as China, the world’s largest crude oil importer.
Today, China is the primary destination for Iranian oil, while smaller volumes are also directed to countries like Syria, the United Arab Emirates and Venezuela. To avoid detection and obscure the origin of shipments, Iran relies heavily on a so-called “shadow fleet” of tankers that operate without transponders and often engage in ship-to-ship transfers, tactics that Russia has since emulated.
Financial transactions related to these exports are typically conducted in yuan through smaller Chinese banks, a system that limits the ability of Western authorities to track payments and enforce sanctions. Once Iranian oil reaches China, it is reportedly rebranded – often as Malaysian or Middle Eastern crude – and sold to independent Chinese refineries, known as “teapots,” which operate with fewer regulatory constraints.
It is widely believed that this trade arrangement has allowed Chinese companies to save billions of dollars. At the same time, Tehran has greatly benefited from the continued revenue. According to the U.S. Energy Information Administration (EIA), Iran’s oil export revenues reached an estimated $43 billion in 2024, marking a $1 billion annual increase. This accounted for more than 57 percent of the country’s total export revenue in 2024, the highest share since the reimposition of U.S. sanctions in 2018, according to the World Bank.
Despite its apparent resilience, Iran remains far more vulnerable than it appears. Although it continues to bypass sanctions, the crude oil it exports is sold at steep discounts, raising questions about the accuracy of reported revenue figures. As confirmed by the EIA, official estimates of Iran’s oil income do not reflect the price reductions offered to buyers of sanctioned crude. Iran has further increased its discounts to remain competitive with Russia in the Chinese market.
This reliance is compounded by the concentration of Iran’s export destinations. While Beijing has a diversified portfolio of energy suppliers, Iran is heavily reliant on China for its oil exports. The same vulnerability applies to non-oil trade. According to the World Bank, Iran’s top three trading partners, China, Iraq and the UAE, account for 60 percent of its exports and 70 percent of its imports.Iran’s oil revenues in the financial year 2023-2024 reportedly fell well short of expectations, covering only about half of the amount projected in the national budget.
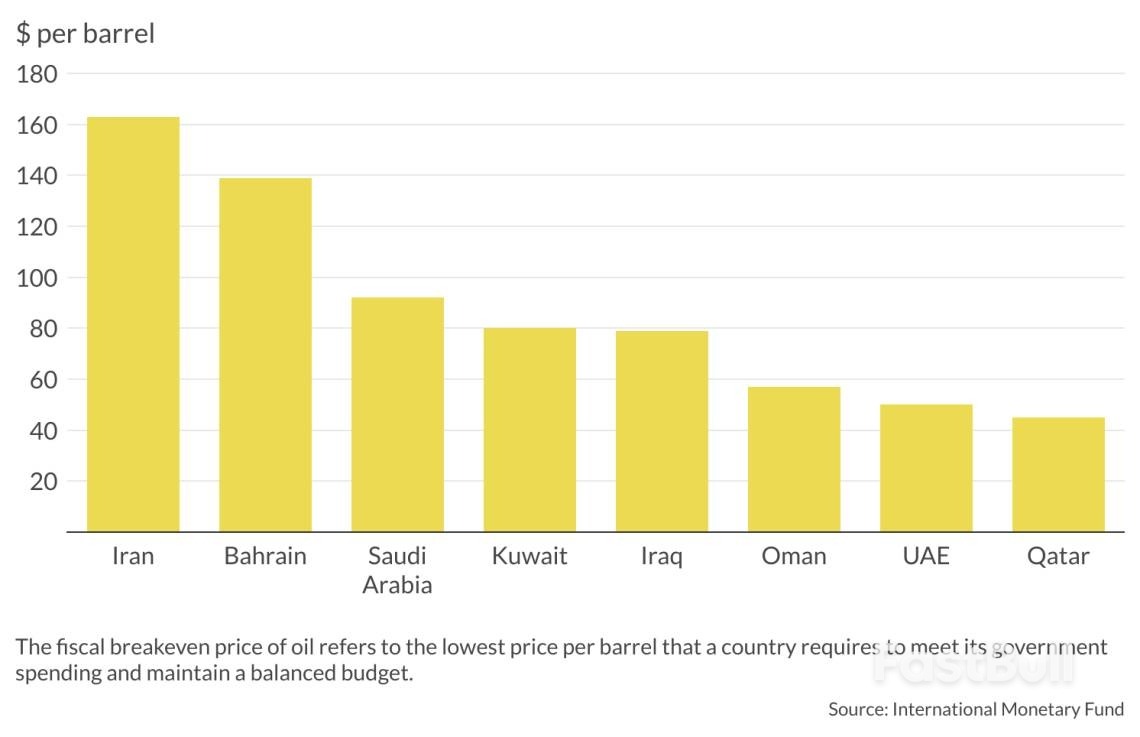
As a result, the government was forced to reduce spending to help contain the deficit. According to the International Monetary Fund, Iran would need oil prices to exceed $163 per barrel to balance its budget in 2025, the highest fiscal breakeven oil price among Middle Eastern oil exporters.
Although Iran’s oil production has increased in recent years, it remains well below its peak levels of the 1970s, even with the country’s large reserves and the advancements in drilling and extraction technologies since then.Iran nationalized its oil industry in 1951, and the sector remained open to foreign investment for several decades. This changed after the 1979 Islamic Revolution, when international investment in oil and gas was largely prohibited under the Iranian Constitution. The Iran-Iraq War further devastated the oil sector, leaving it in urgent need of rebuilding.
In response, the government adopted a more flexible stance toward foreign investment and introduced a new contractual framework known as the buyback contract. Under this model, international oil companies were permitted to invest only up to the point of first production, at which time the project would be transferred to the National Iranian Oil Company in exchange for a pre-agreed fixed fee.
However, these terms have historically been unattractive to international investors. Even after the JCPOA agreement in 2015, Tehran struggled to secure major international deals. This was due in part to internal divisions over the role of foreign capital in the energy sector, as well as lingering U.S. secondary sanctions that continued to limit access to global financial and banking systems.
In the absence of foreign investment, especially in recent years, Iran has increasingly relied on domestic firms to develop its oil projects. But these companies often lack the capital, advanced technology and technical expertise required to sustain output, particularly from mature fields. Sanctions have further exacerbated these challenges by limiting access to financing, curtailing technology transfers, raising trade costs and reducing overall competitiveness.
Meanwhile, as its production capacity has stagnated, other OPEC members, such as Iraq and the UAE, have expanded their market share, often at Iran’s expense.One strategic asset Iran still controls is the Strait of Hormuz. Disruption to this key maritime passage could significantly affect worldwide energy supplies and prices, especially for major importers like China. Regardless of occasional threats from Iranian officials to block the strait, such actions have never materialized.
728 RM B 7/F GEE LOK IND BLDG NO 34 HUNG TO RD KWUN TONG KLN HONG KONG


White Label
Data API
Web Plug-ins
Poster Maker
Affiliate Program
The risk of loss in trading financial instruments such as stocks, FX, commodities, futures, bonds, ETFs and crypto can be substantial. You may sustain a total loss of the funds that you deposit with your broker. Therefore, you should carefully consider whether such trading is suitable for you in light of your circumstances and financial resources.
No decision to invest should be made without thoroughly conducting due diligence by yourself or consulting with your financial advisors. Our web content might not suit you since we don't know your financial conditions and investment needs. Our financial information might have latency or contain inaccuracy, so you should be fully responsible for any of your trading and investment decisions. The company will not be responsible for your capital loss.
Without getting permission from the website, you are not allowed to copy the website's graphics, texts, or trademarks. Intellectual property rights in the content or data incorporated into this website belong to its providers and exchange merchants.
Not Logged In
Log in to access more features

FastBull Membership
Not yet
Purchase


Log In
Sign Up


