• Trade
  • Markets
  • Copy
  • Contests
  • News
  • 24/7
  • Calendar
  • Q&A
  • Chats
Trending
Screeners
SYMBOL
LAST
BID
ASK
HIGH
LOW
NET CHG.
%CHG.
SPREAD
SPX
S&P 500 Index
6861.94
6861.94
6861.94
6901.43
6857.40
-34.30
-0.50%
--
DJI
Dow Jones Industrial Average
48147.67
48147.67
48147.67
48394.51
48110.85
-219.38
-0.45%
--
IXIC
NASDAQ Composite Index
23292.85
23292.85
23292.85
23445.26
23272.98
-126.22
-0.54%
--
USDX
US Dollar Index
97.970
98.050
97.970
98.180
97.850
+0.090
+ 0.09%
--
EURUSD
Euro / US Dollar
1.17444
1.17451
1.17444
1.17591
1.17198
-0.00030
-0.03%
--
GBPUSD
Pound Sterling / US Dollar
1.34695
1.34704
1.34695
1.34763
1.34014
+0.00020
+ 0.01%
--
XAUUSD
Gold / US Dollar
4319.61
4320.02
4319.61
4373.05
4274.29
-19.50
-0.45%
--
WTI
Light Sweet Crude Oil
57.439
57.469
57.439
58.414
57.330
-0.414
-0.72%
--

Community Accounts

Signal Accounts
--
Profit Accounts
--
Loss Accounts
--
View More

Become a signal provider

Sell trading signals to earn additional income

View More

Guide to Copy Trading

Get started with ease and confidence

View More

Signal Accounts for Members

All Signal Accounts

Best Return
  • Best Return
  • Best P/L
  • Best MDD
Past 1W
  • Past 1W
  • Past 1M
  • Past 1Y

All Contests

  • All
  • Trump Updates
  • Recommend
  • Stocks
  • Cryptocurrencies
  • Central Banks
  • Featured News
Top News Only
Share

Explosion Heard In Syria's Aleppo, Ekhbariya TV Reports

Share

EIA - USA Oct Distillates Demand Up 0.2 Percent Or 9000 Barrels/Day Versus Last Year At 4.14 Million Barrels/Day (Versus 2.2 Percent Rise In Sept)

Share

USA Total Oil Demand In Oct Down 1.7 Percent Or 371000 Barrels/Day Versus Last Year At 20.878 Million Barrels/Day (Versus 2.6 Percent Rise In Sept)- EIA's Petroleum Supply Monthly

Share

EIA - USA Oct Gasoline Demand Down 0.7 Percent Or 60000 Barrels/Day Versus Last Year At 9.01 Million Barrels/Day (Versus 0.3 Percent Fall In Sept)

Share

EIA - USA Product Supplied Of Distillate Fuel Oil Rose To 4.1 Million Barrels/Day In October, The Highest In Three Years

Share

EIA - USA Product Supplied Of Finished Motor Gasoline Rose To 9 Million Barrels/Day In October

Share

EIA - USA Product Supplied Of Crude And Petroleum Products Rose To 20.9 Million Barrels/Day In October

Share

The S&P 500 Fell 0.5%, And The NASDAQ 100 Fell 0.6%

Share

Brent Crude Oil Fell 1.0% On The Day, To $60.71 A Barrel

Share

ICE Cotton Futures Fall 6% In 2025, Their Fourth Consecutive Yearly Decline

Share

Brent Crude Futures Settle At $60.85/Bbl, Down 48 Cents, 0.78 Percent

Share

EIA - USA Natural Gas Liquids Production Falls By 97000 Barrels/Day In Oct To 7.798 Million Barrels/Day (Versus 7.895 Million Barrels/Day In Sept)

Share

EIA - USA Crude-By-Rail Shipments Rose By 30000 Barrels/Day In October

Share

French President Macron Called For Europe To Achieve Independence In The Fields Of AI And Quantum Computing

Share

USA Natural Gas Futures Rise About 2% In 2025, Its Second Straight Yearly Gain

Share

USA Crude Oil Futures Settle At $57.42/Bbl, Down 53 Cents, 0.91 Percent

Share

EIA Data - Total USA/Canada Crude-By-Rail Shipments To W.Coast (Padd 5) Rose To 140000 Barrels/Day In October (Versus 100000 Barrels/Day In September)

Share

EIA Data - Total USA/Canada Crude-By-Rail Shipments At Gulf Coast (Padd 3) Unchanged At 123000 Barrels/Day In October (Versus 123000 Barrels/Day In September)

Share

EIA Data - Total USA/Canada Crude-By-Rail Shipments To E.Coast (Padd 1) Fell To 36000 Barrels/Day In October (Versus 43000 Barrels/Day In September)

Share

EIA Data - Canadian Shipments Of Crude Oil By Rail To United States 80000 Barrels/Day In October

TIME
ACT
FCST
PREV
U.S. S&P/CS 10-City Home Price Index YoY (Oct)

A:--

F: --

P: --

U.S. S&P/CS 10-City Home Price Index MoM (Not SA) (Oct)

A:--

F: --

P: --

U.S. S&P/CS 20-City Home Price Index (Not SA) (Oct)

A:--

F: --

P: --

U.S. S&P/CS 20-City Home Price Index MoM (Not SA) (Oct)

A:--

F: --

P: --

U.S. FHFA House Price Index YoY (Oct)

A:--

F: --

P: --
U.S. Chicago PMI (Dec)

A:--

F: --

P: --

Brazil CAGED Net Payroll Jobs (Nov)

A:--

F: --

P: --

U.S. Weekly Total Oil Rig Count

A:--

F: --

P: --

U.S. Weekly Total Rig Count

A:--

F: --

P: --

FOMC Meeting Minutes
U.S. API Weekly Refined Oil Stocks

A:--

F: --

P: --

U.S. API Weekly Crude Oil Stocks

A:--

F: --

P: --

U.S. API Weekly Cushing Crude Oil Stocks

A:--

F: --

P: --

U.S. API Weekly Gasoline Stocks

A:--

F: --

P: --

South Korea CPI YoY (Dec)

A:--

F: --

P: --

China, Mainland NBS Manufacturing PMI (Dec)

A:--

F: --

P: --

China, Mainland Composite PMI (Dec)

A:--

F: --

P: --

China, Mainland NBS Non-manufacturing PMI (Dec)

A:--

F: --

P: --

China, Mainland Caixin Manufacturing PMI (SA) (Dec)

A:--

F: --

P: --

Turkey Trade Balance (Nov)

A:--

F: --

P: --

South Africa Trade Balance (Nov)

A:--

F: --

P: --

U.S. Initial Jobless Claims 4-Week Avg. (SA)

A:--

F: --

P: --
U.S. Weekly Continued Jobless Claims (SA)

A:--

F: --

P: --
U.S. Weekly Initial Jobless Claims (SA)

A:--

F: --

P: --
U.S. EIA Weekly Cushing, Oklahoma Crude Oil Stocks Change

A:--

F: --

P: --

U.S. EIA Weekly Crude Demand Projected by Production

A:--

F: --

P: --

U.S. EIA Weekly Gasoline Stocks Change

A:--

F: --

P: --

U.S. EIA Weekly Crude Stocks Change

A:--

F: --

P: --

U.S. EIA Weekly Heating Oil Stock Changes

A:--

F: --

P: --

U.S. EIA Weekly Crude Oil Imports Changes

A:--

F: --

P: --

U.S. EIA Weekly Natural Gas Stocks Change

A:--

F: --

P: --

South Korea Trade Balance Prelim (Dec)

--

F: --

P: --

South Korea IHS Markit Manufacturing PMI (SA) (Dec)

--

F: --

P: --

Indonesia IHS Markit Manufacturing PMI (Dec)

--

F: --

P: --

India HSBC Manufacturing PMI Final (Dec)

--

F: --

P: --

Russia IHS Markit Manufacturing PMI (Dec)

--

F: --

P: --

U.K. Nationwide House Price Index MoM (Dec)

--

F: --

P: --

U.K. Nationwide House Price Index YoY (Dec)

--

F: --

P: --

Turkey Manufacturing PMI (Dec)

--

F: --

P: --

Italy Manufacturing PMI (SA) (Dec)

--

F: --

P: --

Euro Zone Manufacturing PMI Final (Dec)

--

F: --

P: --

Euro Zone M3 Money Supply (SA) (Nov)

--

F: --

P: --

Euro Zone 3-Month M3 Money Supply YoY (Nov)

--

F: --

P: --

Euro Zone Private Sector Credit YoY (Nov)

--

F: --

P: --

Euro Zone M3 Money Supply YoY (Nov)

--

F: --

P: --

U.K. Manufacturing PMI Final (Dec)

--

F: --

P: --

India Deposit Gowth YoY

--

F: --

P: --

Brazil IHS Markit Manufacturing PMI (Dec)

--

F: --

P: --

U.S. MBA Mortgage Application Activity Index WoW

--

F: --

P: --

Canada Manufacturing PMI (SA) (Dec)

--

F: --

P: --

U.S. IHS Markit Manufacturing PMI Final (Dec)

--

F: --

P: --

Mexico Manufacturing PMI (Dec)

--

F: --

P: --

U.S. Weekly Treasuries Held by Foreign Central Banks

--

F: --

P: --

Philadelphia Fed President Henry Paulson delivers a speech
Japan Manufacturing PMI Final (Dec)

--

F: --

P: --

China, Mainland Caixin Composite PMI (Dec)

--

F: --

P: --

China, Mainland Caixin Services PMI (Dec)

--

F: --

P: --

Indonesia Trade Balance (Nov)

--

F: --

P: --

Indonesia Core Inflation YoY (Dec)

--

F: --

P: --

Indonesia Inflation Rate YoY (Dec)

--

F: --

P: --

Saudi Arabia IHS Markit Composite PMI (Dec)

--

F: --

P: --

Q&A with Experts
    • All
    • Chatrooms
    • Groups
    • Friends
    ANor Epys flag
    HFM
    rawa ronte flag
    ANor Epys
    HFM
    @ANor EpysWow, that's the same thing... but why is the chart still moving in the trading view?
    ANor Epys flag
    What do you use? This is Fastbull, so I'm curious about BeeMarket.
    ANor Epys flag
    rawa ronte
    @rawa ronteYes, it may be different for each broker, but it's not a problem.
    3207570 flag
    Buy Gold limit 4404 to next resistance .. thank me later
    ANor Epys flag
    Yes, okay, I have 2 strong buyer zones in that area.
    rawa ronte flag
    3207570
    Buy Gold limit 4404 to next resistance .. thank me later
    @Pengunjung3207570how can I buy... my broker is closed😅
    rawa ronte flag
    ANor Epys
    Yes, okay, I have 2 strong buyer zones in that area.
    @ANor EpysHow much can I buy it for?
    V0EDWL8NGW flag
    btc running profit
    Anh Minh flag
    Can someone explain this to me?
    Freddy94_ flag
    ANor Epys
    Yes, okay, I have 2 strong buyer zones in that area.
    @ANor Epys show me screenshot my friend
    Freddy94_ flag

    Freddy94_

    ID: 1815108

    Share Chart:XAUUSD, H1
    Chart
    EVMKQR7N0G flag
    hello
    luigi flag
    EVMKQR7N0G
    hello
    @EVMKQR7N0Ghi
    luigi flag
    happy new year
    Johnson Le flag
    Happy new year
    Gerald flag
    happy new year 🕛
    王涵 flag
    Why is the chart not moving?
    2953273 flag
    hello
    Raktim flag
    hi
    Type here...
    Add Symbol or Code

      No matching data

      All
      Trump Updates
      Recommend
      Stocks
      Cryptocurrencies
      Central Banks
      Featured News
      • All
      • Russia-Ukraine Conflict
      • Middle East Flashpoint
      • All
      • Russia-Ukraine Conflict
      • Middle East Flashpoint
      Search
      Products

      Charts Free Forever

      Chats Q&A with Experts
      Screeners Economic Calendar Data Tools
      Membership Features
      Data Warehouse Market Trends Institutional Data Policy Rates Macro

      Market Trends

      Market Sentiment Order Book Forex Correlations

      Top Indicators

      Charts Free Forever
      Markets

      News

      News Analysis 24/7 Columns Education
      From Institutions From Analysts
      Topics Columnists

      Latest Views

      Latest Views

      Trending Topics

      Top Columnists

      Latest Update

      Signals

      Copy Rankings Latest Signals Become a signal provider AI Rating
      Contests
      Brokers

      Overview Brokers Assessment Rankings Regulators News Claims
      Broker listing Forex Brokers Comparison Tool Live Spread Comparison Scam
      Q&A Complaint Scam Alert Videos Tips to Detect Scam
      More

      Business
      Events
      Careers About Us Advertising Help Center

      White Label

      Data API

      Web Plug-ins

      Affiliate Program

      Awards Institution Evaluation IB Seminar Salon Event Exhibition
      Vietnam Thailand Singapore Dubai
      Fans Party Investment Sharing Session
      FastBull Summit BrokersView Expo
      Recent Searches
        Top Searches
          Markets
          News
          Analysis
          User
          24/7
          Economic Calendar
          Education
          Data
          • Names
          • Latest
          • Prev

          View All

          No data

          Scan to Download

          Faster Charts, Chat Faster!

          Download App
          English
          • English
          • Español
          • العربية
          • Bahasa Indonesia
          • Bahasa Melayu
          • Tiếng Việt
          • ภาษาไทย
          • Français
          • Italiano
          • Türkçe
          • Русский язык
          • 简中
          • 繁中
          Open Account
          Search
          Products
          Charts Free Forever
          Markets
          News
          Signals

          Copy Rankings Latest Signals Become a signal provider AI Rating
          Contests
          Brokers

          Overview Brokers Assessment Rankings Regulators News Claims
          Broker listing Forex Brokers Comparison Tool Live Spread Comparison Scam
          Q&A Complaint Scam Alert Videos Tips to Detect Scam
          More

          Business
          Events
          Careers About Us Advertising Help Center

          White Label

          Data API

          Web Plug-ins

          Affiliate Program

          Awards Institution Evaluation IB Seminar Salon Event Exhibition
          Vietnam Thailand Singapore Dubai
          Fans Party Investment Sharing Session
          FastBull Summit BrokersView Expo

          VinFast-linked GSM Plans Hong Kong IPO At Up To $3 Billion Valuation

          Winkelmann

          Stocks

          Summary:

          Vietnamese electric-vehicle taxi operator GSM, part of the Vingroup (VIC.HM) stable of companies, plans to list in Hong Kong in what could be the first IPO in the city by a firm from the Southeast Asian nation, two sources said.

          A VinFast electric taxi, operated by GSM, a private company owned by VinFast's owner, sails through traffic on a street, in Hanoi, Vietnam April 6, 2024. REUTERS/Francesco Guarascio/File Photo

          · GSM aims to raise at least $200 million, source says
          · Would be first Vietnamese firm to list in Hong Kong
          · IPO to fund regional EV taxi expansion
          · GSM uses VinFast vehicles exclusively

          Vietnamese electric-vehicle taxi operator GSM, part of the Vingroup (VIC.HM) stable of companies, plans to list in Hong Kong in what could be the first IPO in the city by a firm from the Southeast Asian nation, two sources said.

          GSM, officially known as Green and Smart Mobility JSC, is targeting a valuation of $2 billion to $3 billion in the initial public offering that could take place in late 2026 to early 2027, the sources said.

          One of the sources added that GSM aimed to raise at least $200 million and the other said the valuation would include debt. Both declined to be identified as the information is confidential.

          The IPO plan, which is still tentative and could be shelved, would mark Vingroup's second overseas listing after electric-vehicle maker VinFast's (VFS.O) Nasdaq IPO in 2023.

          GSM has held preliminary talks with potential advisers about the IPO and could appoint them as early as the first quarter of 2026, the sources said.

          Vingroup, which handles communications for GSM and VinFast, declined to comment on the IPO plan.

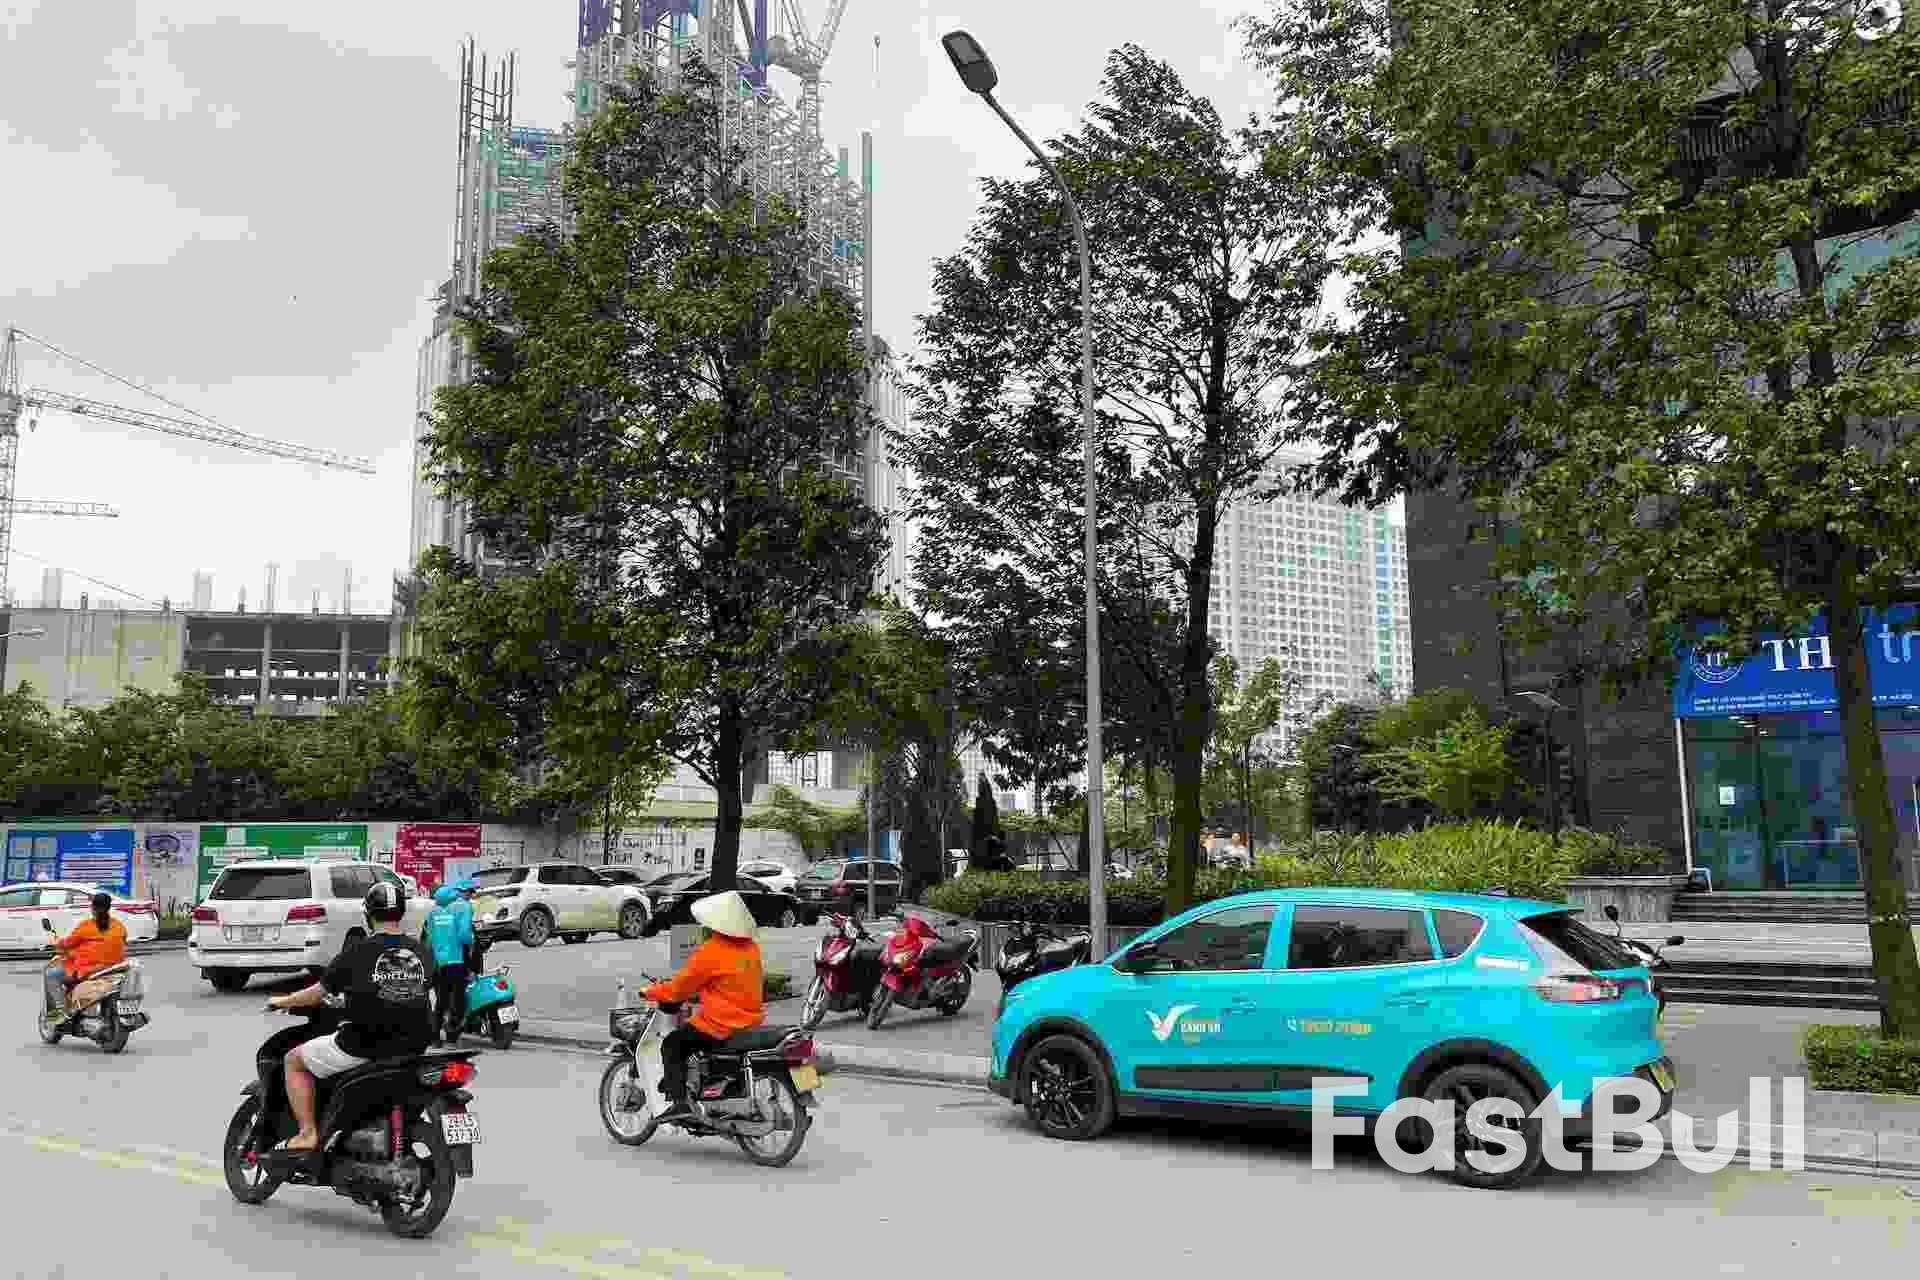
          Founded in 2023 by Vingroup and VinFast head Pham Nhat Vuong, GSM operates Vietnam's largest all-electric taxi fleet under the Xanh SM brand and uses VinFast vehicles exclusively.

          The strategy has bolstered VinFast's domestic sales while enabling GSM to scale up without relying on third-party suppliers. VinFast's sales to GSM accounted for 26% of its total by the third quarter of 2025, down from 72% in 2023.

          While Vuong has previously expressed his intention to pursue an overseas listing for GSM, this is the first time indications about a potential destination, size, valuation and timeline are being detailed.

          The sources said the IPO's timeline could be adjusted based on market conditions and corporate strategy.

          The second source said a listing in Hong Kong would offer deeper liquidity and stronger investor appetite for EV and mobility plays, versus Singapore or Nasdaq where VinFast faced liquidity challenges.

          VinFast, listed on Nasdaq since 2023, has struggled with thin liquidity tied to a small free float.

          If successful, a Hong Kong listing would fund GSM's regional growth, strengthen its position in Southeast Asia's competitive market, and ease financial pressures on Vingroup and Vuong as VinFast continues its costly expansion and development efforts.

          INTERNATIONAL EXPANSION

          The potential Hong Kong IPO could tap into a resurgent market. Hong Kong dominated Asian equity capital markets with about $75 billion raised so far this year, more than triple last year's tally and the highest since 2021, according to LSEG data.

          Hong Kong has also been stepping up efforts to attract overseas issuers, with HKEX CEO Bonnie Chan saying in June the exchange is seeking to woo Southeast Asia and Middle East firms in particular for second listings.

          A listing would follow ride-hailing majors such as Uber (UBER.N) Lyft (LYFT.O), Grab (GRAB.O) and Indonesia's GoTo (GOTO.JK) GSM's closest rival in Vietnam is Grab.

          GSM held about 40% of Vietnam's ride-hailing market in the first quarter of this year, versus Grab's 32%, data from Indian research firm Mordor Intelligence showed. A separate survey by Rakuten Insight, however, estimated Grab's share at 55%, and GSM at 35%.

          Vingroup did not share financial details of GSM but said the company continued to demonstrate strong momentum and reinforce its market-leading position.

          GSM has expanded into Laos, Indonesia and the Philippines, and is exploring an entry into India.

          Source: Reuters

          Risk Warnings and Disclaimers
          You understand and acknowledge that there is a high degree of risk involved in trading. Following any strategies or investment methods may lead to potential losses. The content on the site is provided by our contributors and analysts for information purposes only. You are solely responsible for determining whether any trading assets, securities, strategy, or any other product is suitable for investing based on your own investment objectives and financial situation.
          Add to Favorites
          Share

          Asian Stocks Rally While Precious Metals Retreat Amid Fed Rate Cut Bets and Volatile Year-End Trading

          Gerik

          Economic

          Stocks

          Fed expectations fuel risk rally and metal surge

          Global markets continued to digest the implications of a softer Federal Reserve as the year draws to a close. With the Fed having already cut rates earlier in December and traders pricing in at least two more cuts in 2026, investor optimism spread across equities and commodities. The dollar index fell 0.08% to 97.953, nearing a three-month low and heading for a 9.7% annual loss its steepest decline since 2017.
          This environment provided fertile ground for precious metals, which have surged in 2025 on a combination of rate cut expectations, safe-haven appeal, supply constraints, and institutional hedging. Silver breached the psychologically important $80/oz mark peaking at $83.62 before tumbling back to $78.12, highlighting the extreme volatility at year-end.
          Gold also slipped nearly 1% from record levels near $4,550/oz, despite a 72% gain for the year. Platinum and palladium both hit record highs before retreating sharply as profit-taking and thin liquidity exaggerated price swings.

          Market strategist: Structural case for metals remains

          Charu Chanana, chief strategist at Saxo, explained that the metals rally has been fueled by a "powerful mix" of Fed easing expectations, geopolitical risks, and structural demand. However, she cautioned that silver’s parabolic rise raises short-term risks driven more by technical factors and investor positioning than fundamentals alone.
          Chanana maintained that any corrections may represent opportunities for long-term investors, particularly if central banks continue to diversify reserves and inflation proves more persistent than expected. She also pointed to continued industrial demand and constrained supply chains as underlying support for metals in 2026, especially silver.

          Asian equities close out strong year on tech optimism

          Asian stocks had a strong session, with MSCI’s Asia-Pacific ex-Japan index rising 0.27% to a six-week high. The index is up over 25% year-to-date, largely powered by a surge in technology shares and the global AI boom.
          South Korea’s KOSPI led regional gains, climbing 1.5% to near a two-month high and closing out the year with a stunning 74% gain its best performance since 1999. Taiwan’s benchmark also reached a record high, up 0.3%, while Japan’s Nikkei slipped slightly by 0.4%.
          Investor attention now turns to the release of the Fed’s December meeting minutes on Tuesday, which may provide further clues into the U.S. central bank’s policy path. IG analyst Tony Sycamore noted that traders are especially focused on the Fed’s labor market outlook and whether the FOMC might consider a 25bps rate cut as early as January, should upcoming jobs data weaken.

          Yen firms as BOJ shifts tone

          The Japanese yen strengthened 0.2% to 156.13 per dollar following the BOJ’s latest summary of opinions, which showed more board members supporting further rate hikes. Despite the rate hike earlier this month, the BOJ’s dovish guidance had previously disappointed markets and weighed on the yen.
          Though the yen has recovered slightly, it remains near a 10-month low, and the risk of currency intervention by Japanese authorities still lingers as officials continue to issue verbal warnings against excessive weakness. The correlation between Japan’s policy rate and the yen remains tight, and any deviation from expected BOJ tightening could reignite volatility.
          Markets ended 2025 on a volatile but largely optimistic note. Equities extended gains on the back of dovish Fed expectations and robust tech sector performance, while precious metals despite a sharp pullback capped off a historic year. With geopolitical risks, central bank shifts, and global supply concerns still in play, volatility is set to remain a dominant theme as traders reposition for the start of 2026.

          Source: Reuters

          To stay updated on all economic events of today, please check out our Economic calendar
          Risk Warnings and Disclaimers
          You understand and acknowledge that there is a high degree of risk involved in trading. Following any strategies or investment methods may lead to potential losses. The content on the site is provided by our contributors and analysts for information purposes only. You are solely responsible for determining whether any trading assets, securities, strategy, or any other product is suitable for investing based on your own investment objectives and financial situation.
          Add to Favorites
          Share

          BOJ Signals Steady Path to Higher Rates as Inflation and Yen Weakness Dominate Policy Debate

          Gerik

          Economic

          Persistent inflation prompts continued rate hike discussion

          At its December 18–19 meeting, the BOJ raised its key policy rate from 0.5% to 0.75%, marking its second rate hike of 2025 and the highest level in three decades. Yet, a summary of opinions released this week reveals that several board members believe this adjustment may not be enough to rein in inflation or stabilize the yen.
          Some policymakers argued that the BOJ’s rate remains “significantly negative” in real terms when adjusted for inflation. One member even recommended raising rates “every few months,” suggesting a steady tightening path to reach a neutral stance. This illustrates a causal link between real interest rates and the BOJ’s inflation control strategy: maintaining ultra-low rates, even if nominally higher, risks keeping inflation expectations elevated and the yen under pressure.

          Exchange rate concerns and inflation interlink

          Several board members linked the weak yen directly to Japan’s relatively low interest rates. The yen has been underperforming against major currencies, contributing to higher import prices and persistent inflation a phenomenon one member described as "sticky." There is a clear causality here: the combination of a weaker yen and costlier imports fuels sustained price increases, compelling the BOJ to maintain a hawkish bias.
          One board opinion noted that timely rate hikes could curb future inflationary pressure and even anchor long-term interest rates, as earlier policy action might reduce the need for steeper hikes later. This reflects the BOJ’s attempt to manage forward expectations, borrowing from strategies commonly employed by the Federal Reserve and European Central Bank.

          Cautious optimism on wage growth and economic resilience

          Despite concerns about inflation, the BOJ expressed growing confidence in the Japanese economy’s resilience. Members expect corporate earnings and capital expenditure to hold up, especially with support from the government’s expansive fiscal stimulus. A particular focus was placed on wage growth: if spring 2026 wage negotiations at major firms yield raises similar to 2025, the BOJ may conclude that “underlying inflation” excluding temporary shocks has finally met its 2% target.
          This forms part of the BOJ’s conditional framework: inflation must be accompanied by consistent wage growth to justify sustained tightening. Here, the relationship between labor market conditions and monetary policy becomes causal stronger wages enable broader inflation pass-through, justifying rate normalization.

          Government support but watchful on corporate impact

          The summary also confirmed that two government representatives including one from the Cabinet Office did not oppose the December hike. This suggests that Prime Minister Sanae Takaichi’s administration is aligned with the BOJ’s view that policy tightening is necessary.
          However, one government voice urged caution regarding the effects of rising borrowing costs on corporate investment and profitability. This highlights the balancing act policymakers face: while combating inflation remains critical, preserving the momentum of Japan’s fragile recovery is equally important. The Cabinet Office's warning represents a correlated concern, rather than an outright policy divergence.
          The BOJ’s December summary reveals a growing consensus that Japan must shed its long-standing ultra-loose monetary policy to tackle inflation and restore exchange rate stability. However, policymakers are still navigating complex trade-offs between inflation control, currency dynamics, wage growth, and business investment. With no immediate resistance from the government, the BOJ appears empowered to proceed with gradual tightening but future hikes will depend on evolving wage data, the global interest rate environment, and yen performance. As 2026 approaches, Japan’s monetary path will be shaped by how well it balances these overlapping objectives.

          Source: Reuters

          To stay updated on all economic events of today, please check out our Economic calendar
          Risk Warnings and Disclaimers
          You understand and acknowledge that there is a high degree of risk involved in trading. Following any strategies or investment methods may lead to potential losses. The content on the site is provided by our contributors and analysts for information purposes only. You are solely responsible for determining whether any trading assets, securities, strategy, or any other product is suitable for investing based on your own investment objectives and financial situation.
          Add to Favorites
          Share

          Korea's Annual Exports Surpass $700 Bil. For 1st Time

          Justin

          Forex

          Economic

          Korea's Annual Exports Surpass $700 Bil. For 1st Time_1

          Containers are stacked at a port in Pyeongtaek, Gyeonggi Province, Nov. 14. Yonhap

          Korea's annual exports surpassed $700 billion for the first time on Monday, making the country the sixth in the world to reach the milestone, government data showed.

          Outbound shipments tentatively exceeded the mark at 1:03 p.m., according to the data from the Ministry of Trade, Industry and Resources and the Korea Customs Service.

          Korea followed the United States, Germany, China, Japan and the Netherlands in surpassing the milestone, the ministry said.

          While Korea was the seventh country globally to reach $600 billion in annual exports in 2018, it became the sixth to hit the $700 billion mark, a sign of faster export growth compared with other major economies, the ministry said.

          The ministry attributed the strong performance to robust shipments of semiconductors, along with key products such as automobiles, ships and bio-related goods.

          By region, exports to the U.S. and China declined in terms of their share in total shipments, while the proportion of shipments to other Asian countries, the European Union and Central and South America increased, reflecting a trend toward market diversification.

          Exports by small and medium-sized enterprises hit record highs in both value and number of companies through September, the ministry said.

          "Despite a challenging trade environment marked by U.S. tariff measures and trade protectionism, Korea turned a crisis into an opportunity, underscoring the resilience of our people and businesses," a ministry official said.

          Earlier this year, exports had been expected to struggle amid tariff measures by the Donald Trump administration.

          Although outbound shipments declined in the first half of the year, exports rebounded sharply from June as market confidence recovered following the launch of the Lee Jae Myung administration and uncertainties eased after a trade agreement with Washington.

          The government said it will work to sustain momentum next year by strengthening the fundamental competitiveness of industries through manufacturing innovation, diversifying export markets and items, and expanding incentives to attract foreign investment to regional areas.

          The government also aims to achieve exports of $700 billion and foreign direct investment of more than $35 billion for a second consecutive year.

          Source: Koreatimes

          To stay updated on all economic events of today, please check out our Economic calendar
          Risk Warnings and Disclaimers
          You understand and acknowledge that there is a high degree of risk involved in trading. Following any strategies or investment methods may lead to potential losses. The content on the site is provided by our contributors and analysts for information purposes only. You are solely responsible for determining whether any trading assets, securities, strategy, or any other product is suitable for investing based on your own investment objectives and financial situation.
          Add to Favorites
          Share

          South Korea Exports Seen Rising In December On Strong Chip Demand: Reuters Poll

          Winkelmann

          Forex

          Stocks

          South Korean exports likely rose for the seventh consecutive month in December, led by strong chip demand for artificial intelligence technologies, a Reuters poll showed on Monday.

          Exports from Asia's fourth-largest economy, a bellwether for global trade, were projected to have risen 9.0% from a year earlier, according to a median forecast of 11 economists.

          That would be slightly faster than an 8.4% rise in November and the fastest annual increase in three months.

          "Semiconductor exports remain the anchor, benefiting from AI-related demand, as well as stabilising prices of legacy memory products," Standard Chartered economists said in a note.

          Citi economists said semiconductor exports were expected to continue rising in 2026, by 56% year-on-year, after growing 23% this year, led by the global AI capex cycle.

          Economists, however, also noted that most other sectors, such as steel, machinery and automobiles were seen sluggish, due to U.S. tariffs and intensifying competition.

          "There is a lack of momentum in other products. The global manufacturing sector's capex cycle will have to be revived, which is hard to expect in the near future," said Stephen Lee, an economist at Meritz Securities in Seoul.

          In the first 20 days of this month, exports rose 6.8%, led by a 41.8% jump in semiconductors, which offset declines in autos, ships and steel. Shipments to China and the U.S. rose, but those to the European Union fell.

          The trade-reliant economy grew in the third quarter at the strongest pace in nearly four years, driven by robust exports and a rebound in consumer spending.

          Monday's survey also showed imports rising 2.5% in December, after growing 1.1% in November.

          The median forecast for the monthly trade balance stood at a surplus of $10.0 billion. That would be wider than $9.74 billion in the previous month and the biggest since September 2017.

          South Korea is scheduled to report trade figures for December on Thursday, January 1, at 9 a.m. (0000 GMT).

          Source: Investing

          Risk Warnings and Disclaimers
          You understand and acknowledge that there is a high degree of risk involved in trading. Following any strategies or investment methods may lead to potential losses. The content on the site is provided by our contributors and analysts for information purposes only. You are solely responsible for determining whether any trading assets, securities, strategy, or any other product is suitable for investing based on your own investment objectives and financial situation.
          Add to Favorites
          Share

          Precious Metals Dip as Peace Hopes and Profit-Taking Halt Record Rally

          Gerik

          Economic

          Commodity

          Silver corrects after breaching historic milestone

          Silver, which surged to a record-breaking $83.62 per ounce earlier Monday, slid 1.3% to $78.12 by 0242 GMT. The correction followed a staggering 181% rally year-to-date, making silver the best-performing precious metal of 2025. Its gains were fueled by a unique convergence of supply shortages, growing industrial demand, low inventories, and its recent classification as a critical mineral by the U.S. government.
          However, the sharp pullback reflected a typical profit-taking cycle after such a vertical move, particularly in thin end-of-year trading. Market analyst Tim Waterer of KCM Trade noted that the price decline was catalyzed by investors unwinding positions as geopolitical risk subsided slightly, thanks to promising peace signals from U.S. President Donald Trump and Ukraine’s President Zelensky.
          The relationship here is correlative: reduced geopolitical tension weakens safe-haven demand, prompting some cooling in speculative and defensive positions in metals like silver and gold.

          Gold eases from record levels as Fed bets cool enthusiasm

          Gold also slipped 0.4% to $4,512.74 per ounce, down from its all-time high of $4,549.71 set last Friday. U.S. gold futures declined in tandem, falling to $4,536.40. Even with the modest drop, gold remains up 72% in 2025, buoyed by a powerful combination of macroeconomic and geopolitical drivers.
          Contributing factors include expectations of Federal Reserve rate cuts, heavy central bank accumulation as countries diversify away from U.S. Treasuries and the dollar, and rising exchange-traded fund (ETF) inflows. These drivers have a causal impact: lower interest rates reduce the opportunity cost of holding non-yielding assets like gold, directly supporting its valuation.
          Waterer suggested that gold could realistically approach $5,000 in 2026 if a dovish Federal Reserve leadership emerges next year, further aligning monetary policy with bullish gold fundamentals.

          Platinum and palladium diverge

          Spot platinum also pulled back by 0.4% to $2,441.20 after earlier reaching a record $2,478.50. The metal has risen significantly in 2025, driven by growing industrial use, including in hydrogen energy systems and auto catalysts.
          In contrast, palladium dropped sharply by 8% to $1,771.99 per ounce, showing greater sensitivity to short-term investor sentiment and supply chain adjustments in the automotive sector. This decline reflects a divergence in industrial metal sentiment, possibly due to reallocation of investor focus and expectations for evolving demand in electric vehicle production.

          Outlook: volatility persists despite long-term bullish factors

          While the peace negotiations between Trump and Zelensky have eased some of the geopolitical risk premium, there remains no concrete resolution to the conflict. As such, the precious metals market may continue to oscillate in response to geopolitical developments, central bank policy shifts, and inflation expectations.
          Waterer predicted that silver could test $100 per ounce by 2026, citing persistent industrial demand and tight supply conditions. The projection rests on a causal scenario: if interest rates fall and supply remains constrained, both industrial and speculative demand for silver could surge anew.
          Monday’s retreat in precious metals reflects a short-term rebalancing after months of explosive growth. While peace talks and profit-taking have curbed upward momentum for now, long-term drivers such as rate cut expectations, supply tightness, and geopolitical uncertainty remain intact. As 2026 approaches, the stage is set for continued volatility but also further potential highs if macro and industrial trends align.

          Source: Reuters

          To stay updated on all economic events of today, please check out our Economic calendar
          Risk Warnings and Disclaimers
          You understand and acknowledge that there is a high degree of risk involved in trading. Following any strategies or investment methods may lead to potential losses. The content on the site is provided by our contributors and analysts for information purposes only. You are solely responsible for determining whether any trading assets, securities, strategy, or any other product is suitable for investing based on your own investment objectives and financial situation.
          Add to Favorites
          Share

          Oil Prices Rise Amid Middle East Tensions and Uncertainty in Ukraine Peace Talks

          Gerik

          Economic

          Commodity

          Geopolitical instability outweighs peace prospects

          On Monday, Brent crude rose by 56 cents (0.92%) to $61.20 per barrel, and U.S. West Texas Intermediate (WTI) gained 51 cents (0.9%) to $57.25. This rebound followed Friday’s more than 2% price drop, which reflected investor optimism over possible de-escalation in the Russia-Ukraine conflict and anxiety over a looming supply glut. However, fresh developments over the weekend reversed some of that sentiment.
          The primary driver of Monday’s gains lies in the resurgence of geopolitical risk. According to Yang An of Haitong Futures, both Russia and Ukraine have resumed targeting each other’s energy infrastructure, raising fears of disruptions in regional supply flows. While these attacks do not directly reduce oil production, their implications for pipeline stability and refining capacity create pricing pressure through market speculation and risk premiums.

          Middle East risks reinforce supply concerns

          Beyond Eastern Europe, instability in the Middle East added further stress to the market. Saudi Arabia’s renewed airstrikes in Yemen, combined with Iran’s declarations that it is in a “full-scale war” with the U.S., Europe, and Israel, have reignited fears of regional conflict that could impact oil transit routes, particularly through the Strait of Hormuz a chokepoint for a significant portion of global crude shipments.
          Although these statements may be political posturing, their correlation with rising oil prices reflects how sensitive the energy market is to perceived threats. The market is not reacting solely to actual supply reductions but to the potential for future volatility a key element in risk pricing.

          Unresolved issues in Ukraine peace negotiations

          Meanwhile, the weekend meeting between Presidents Trump and Zelensky ended with cautious optimism but no breakthrough. Trump noted that both sides were “getting a lot closer” to a deal, but territorial issues particularly over the Donbas region remain significant roadblocks.
          IG analyst Tony Sycamore emphasized that without resolution on these core territorial disputes, the market should not price in a lasting peace just yet. The absence of a definitive outcome means conflict-related supply risks remain embedded in oil prices.

          Additional pressure from U.S. policy actions

          Sycamore also highlighted other U.S.-related variables that could further tighten supply, including recent seizures of Venezuelan oil and a U.S. military strike on ISIS targets in Nigeria a country responsible for roughly 1.5 million barrels of daily output. Though Nigeria’s production has been relatively stable, heightened tensions or retaliatory strikes could threaten facilities and cause output interruptions, reinforcing the upward pressure on oil prices.
          WTI is expected to remain within a $55–$60 per barrel range in the near term, depending on how quickly geopolitical flashpoints evolve. The December 10 seizure of 1.9 million barrels of oil by the United States, while not yet widely disruptive, also signals a more assertive stance on enforcing sanctions, which could affect black-market flows and further restrict legitimate supply.
          Oil markets remain highly sensitive to geopolitical risk, with recent gains driven less by fundamentals and more by fear of escalation in multiple regions. While diplomatic dialogue in Ukraine provides some hope, unresolved tensions in Eastern Europe, the Middle East, and even parts of Africa continue to anchor prices. With a light economic calendar ahead, traders will likely remain focused on geopolitical developments and their implications for global supply stability.

          Source: Reuters

          To stay updated on all economic events of today, please check out our Economic calendar
          Risk Warnings and Disclaimers
          You understand and acknowledge that there is a high degree of risk involved in trading. Following any strategies or investment methods may lead to potential losses. The content on the site is provided by our contributors and analysts for information purposes only. You are solely responsible for determining whether any trading assets, securities, strategy, or any other product is suitable for investing based on your own investment objectives and financial situation.
          Add to Favorites
          Share
          FastBull
          Copyright © 2026 FastBull Ltd

          728 RM B 7/F GEE LOK IND BLDG NO 34 HUNG TO RD KWUN TONG KLN HONG KONG

          TelegramInstagramTwitterfacebooklinkedin
          App Store Google Play Google Play
          Products
          Charts

          Chats

          Q&A with Experts
          Screeners
          Economic Calendar
          Data
          Tools
          Membership
          Features
          Function
          Markets
          Copy Trading
          Latest Signals
          Contests
          News
          Analysis
          24/7
          Columns
          Education
          Company
          Careers
          About Us
          Contact Us
          Advertising
          Help Center
          Feedback
          User Agreement
          Privacy Policy
          Personal Information Protection Statement
          Business

          White Label

          Data API

          Web Plug-ins

          Poster Maker

          Affiliate Program

          Risk Disclosure

          The risk of loss in trading financial instruments such as stocks, FX, commodities, futures, bonds, ETFs and crypto can be substantial. You may sustain a total loss of the funds that you deposit with your broker. Therefore, you should carefully consider whether such trading is suitable for you in light of your circumstances and financial resources.

          No decision to invest should be made without thoroughly conducting due diligence by yourself or consulting with your financial advisors. Our web content might not suit you since we don't know your financial conditions and investment needs. Our financial information might have latency or contain inaccuracy, so you should be fully responsible for any of your trading and investment decisions. The company will not be responsible for your capital loss.

          Without getting permission from the website, you are not allowed to copy the website's graphics, texts, or trademarks. Intellectual property rights in the content or data incorporated into this website belong to its providers and exchange merchants.

          Not Logged In

          Log in to access more features

          FastBull Membership

          Not yet

          Purchase

          Become a signal provider
          Help Center
          Customer Service
          Dark Mode
          Price Up/Down Colors

          Log In

          Sign Up

          Position
          Layout
          Fullscreen
          Default to Chart
          The chart page opens by default when you visit fastbull.com