• Trade
  • Markets
  • Copy
  • Contests
  • News
  • 24/7
  • Calendar
  • Q&A
  • Chats
Trending
Screeners
SYMBOL
LAST
BID
ASK
HIGH
LOW
NET CHG.
%CHG.
SPREAD
SPX
S&P 500 Index
6827.42
6827.42
6827.42
6899.86
6801.80
-73.58
-1.07%
--
DJI
Dow Jones Industrial Average
48458.04
48458.04
48458.04
48886.86
48334.10
-245.98
-0.51%
--
IXIC
NASDAQ Composite Index
23195.16
23195.16
23195.16
23554.89
23094.51
-398.69
-1.69%
--
USDX
US Dollar Index
97.950
98.030
97.950
98.500
97.950
-0.370
-0.38%
--
EURUSD
Euro / US Dollar
1.17394
1.17409
1.17394
1.17496
1.17192
+0.00011
+ 0.01%
--
GBPUSD
Pound Sterling / US Dollar
1.33707
1.33732
1.33707
1.33997
1.33419
-0.00148
-0.11%
--
XAUUSD
Gold / US Dollar
4299.39
4299.39
4299.39
4353.41
4257.10
+20.10
+ 0.47%
--
WTI
Light Sweet Crude Oil
57.233
57.485
57.233
58.011
56.969
-0.408
-0.71%
--

Community Accounts

Signal Accounts
--
Profit Accounts
--
Loss Accounts
--
View More

Become a signal provider

Sell trading signals to earn additional income

View More

Guide to Copy Trading

Get started with ease and confidence

View More

Signal Accounts for Members

All Signal Accounts

Best Return
  • Best Return
  • Best P/L
  • Best MDD
Past 1W
  • Past 1W
  • Past 1M
  • Past 1Y

All Contests

  • All
  • Trump Updates
  • Recommend
  • Stocks
  • Cryptocurrencies
  • Central Banks
  • Featured News
Top News Only
Share

USA Embassy In Lithuania: Maria Kalesnikava Is Not Going To Vilnius

Share

USA Embassy In Lithuania: Other Prisoners Are Being Sent From Belarus To Ukraine

Share

Ukraine President Zelenskiy: Five Ukrainians Released By Belarus In US-Brokered Deal

Share

USA Vilnius Embassy: USA Stands Ready For "Additional Engagement With Belarus That Advances USA Interests"

Share

USA Vilnius Embassy: Belarus, USA, Other Citizens Among The Prisoners Released Into Lithuania

Share

USA Vilnius Embassy: USA Will Continue Diplomatic Efforts To Free The Remaining Political Prisoners In Belarus

Share

USA Vilnius Embassy: Belarus Releases 123 Prisoners Following Meeting Of President Trump's Envoy Coale And Belarus President Lukashenko

Share

USA Vilnius Embassy: Masatoshi Nakanishi, Aliaksandr Syrytsa Are Among The Prisoners Released By Belarus

Share

USA Vilnius Embassy: Maria Kalesnikava And Viktor Babaryka Are Among The Prisoners Released By Belarus

Share

USA Vilnius Embassy: Nobel Peace Prize Laureate Ales Bialiatski Is Among The Prisoners Released By Belarus

Share

Belarusian Presidential Administration Telegram Channel: Lukashenko Has Pardoned 123 Prisoners As Part Of Deal With US

Share

Two Local Syrian Officials: Joint US-Syrian Military Patrol In Central Syria Came Under Fire From Unknown Assailants

Share

Israeli Military Says It Targeted 'Key Hamas Terrorist' In Gaza City

Share

Rwanda's Actions In Eastern Drc Are A Clear Violation Of Washington Accords Signed By President Trump - Secretary Of State Rubio

Share

Israeli Military Issues Evacuation Warning In Southern Lebanon Village Ahead Of Strike - Spokesperson On X

Share

Belarusian State Media Cites US Envoy Coale As Saying He Discussed Ukraine And Venezuela With Lukashenko

Share

Belarusian State Media Cites US Envoy Coale As Saying That US Removes Sanctions On Belarusian Potassium

Share

Thai Prime Minister: No Ceasefire Agreement With Cambodia

Share

US, Ukraine To Discuss Ceasefire In Berlin Ahead Of European Summit

Share

Incoming Czech Prime Minister Babis: Czech Republic Will Not Take On Guarantees For Ukraine Financing, European Commission Must Find Alternatives

TIME
ACT
FCST
PREV
U.K. Trade Balance Non-EU (SA) (Oct)

A:--

F: --

P: --

U.K. Trade Balance (Oct)

A:--

F: --

P: --

U.K. Services Index MoM

A:--

F: --

P: --

U.K. Construction Output MoM (SA) (Oct)

A:--

F: --

P: --

U.K. Industrial Output YoY (Oct)

A:--

F: --

P: --

U.K. Trade Balance (SA) (Oct)

A:--

F: --

P: --

U.K. Trade Balance EU (SA) (Oct)

A:--

F: --

P: --

U.K. Manufacturing Output YoY (Oct)

A:--

F: --

P: --

U.K. GDP MoM (Oct)

A:--

F: --

P: --

U.K. GDP YoY (SA) (Oct)

A:--

F: --

P: --

U.K. Industrial Output MoM (Oct)

A:--

F: --

P: --

U.K. Construction Output YoY (Oct)

A:--

F: --

P: --

France HICP Final MoM (Nov)

A:--

F: --

P: --

China, Mainland Outstanding Loans Growth YoY (Nov)

A:--

F: --

P: --

China, Mainland M2 Money Supply YoY (Nov)

A:--

F: --

P: --

China, Mainland M0 Money Supply YoY (Nov)

A:--

F: --

P: --

China, Mainland M1 Money Supply YoY (Nov)

A:--

F: --

P: --

India CPI YoY (Nov)

A:--

F: --

P: --

India Deposit Gowth YoY

A:--

F: --

P: --

Brazil Services Growth YoY (Oct)

A:--

F: --

P: --

Mexico Industrial Output YoY (Oct)

A:--

F: --

P: --

Russia Trade Balance (Oct)

A:--

F: --

P: --

Philadelphia Fed President Henry Paulson delivers a speech
Canada Building Permits MoM (SA) (Oct)

A:--

F: --

P: --

Canada Wholesale Sales YoY (Oct)

A:--

F: --

P: --

Canada Wholesale Inventory MoM (Oct)

A:--

F: --

P: --

Canada Wholesale Inventory YoY (Oct)

A:--

F: --

P: --

Canada Wholesale Sales MoM (SA) (Oct)

A:--

F: --

P: --

Germany Current Account (Not SA) (Oct)

A:--

F: --

P: --

U.S. Weekly Total Rig Count

A:--

F: --

P: --

U.S. Weekly Total Oil Rig Count

A:--

F: --

P: --

Japan Tankan Large Non-Manufacturing Diffusion Index (Q4)

--

F: --

P: --

Japan Tankan Small Manufacturing Outlook Index (Q4)

--

F: --

P: --

Japan Tankan Large Non-Manufacturing Outlook Index (Q4)

--

F: --

P: --

Japan Tankan Large Manufacturing Outlook Index (Q4)

--

F: --

P: --

Japan Tankan Small Manufacturing Diffusion Index (Q4)

--

F: --

P: --

Japan Tankan Large Manufacturing Diffusion Index (Q4)

--

F: --

P: --

Japan Tankan Large-Enterprise Capital Expenditure YoY (Q4)

--

F: --

P: --

U.K. Rightmove House Price Index YoY (Dec)

--

F: --

P: --

China, Mainland Industrial Output YoY (YTD) (Nov)

--

F: --

P: --

China, Mainland Urban Area Unemployment Rate (Nov)

--

F: --

P: --

Saudi Arabia CPI YoY (Nov)

--

F: --

P: --

Euro Zone Industrial Output YoY (Oct)

--

F: --

P: --

Euro Zone Industrial Output MoM (Oct)

--

F: --

P: --

Canada Existing Home Sales MoM (Nov)

--

F: --

P: --

Euro Zone Total Reserve Assets (Nov)

--

F: --

P: --

U.K. Inflation Rate Expectations

--

F: --

P: --

Canada National Economic Confidence Index

--

F: --

P: --

Canada New Housing Starts (Nov)

--

F: --

P: --

U.S. NY Fed Manufacturing Employment Index (Dec)

--

F: --

P: --

U.S. NY Fed Manufacturing Index (Dec)

--

F: --

P: --

Canada Core CPI YoY (Nov)

--

F: --

P: --

Canada Manufacturing Unfilled Orders MoM (Oct)

--

F: --

P: --

Canada Manufacturing New Orders MoM (Oct)

--

F: --

P: --

Canada Core CPI MoM (Nov)

--

F: --

P: --

Canada Manufacturing Inventory MoM (Oct)

--

F: --

P: --

Canada CPI YoY (Nov)

--

F: --

P: --

Canada CPI MoM (Nov)

--

F: --

P: --

Canada CPI YoY (SA) (Nov)

--

F: --

P: --

Canada Core CPI MoM (SA) (Nov)

--

F: --

P: --

Q&A with Experts
    • All
    • Chatrooms
    • Groups
    • Friends
    Connecting
    .
    .
    .
    Type here...
    Add Symbol or Code

      No matching data

      All
      Trump Updates
      Recommend
      Stocks
      Cryptocurrencies
      Central Banks
      Featured News
      • All
      • Russia-Ukraine Conflict
      • Middle East Flashpoint
      • All
      • Russia-Ukraine Conflict
      • Middle East Flashpoint
      Search
      Products

      Charts Free Forever

      Chats Q&A with Experts
      Screeners Economic Calendar Data Tools
      Membership Features
      Data Warehouse Market Trends Institutional Data Policy Rates Macro

      Market Trends

      Market Sentiment Order Book Forex Correlations

      Top Indicators

      Charts Free Forever
      Markets

      News

      News Analysis 24/7 Columns Education
      From Institutions From Analysts
      Topics Columnists

      Latest Views

      Latest Views

      Trending Topics

      Top Columnists

      Latest Update

      Signals

      Copy Rankings Latest Signals Become a signal provider AI Rating
      Contests
      Brokers

      Overview Brokers Assessment Rankings Regulators News Claims
      Broker listing Forex Brokers Comparison Tool Live Spread Comparison Scam
      Q&A Complaint Scam Alert Videos Tips to Detect Scam
      More

      Business
      Events
      Careers About Us Advertising Help Center

      White Label

      Data API

      Web Plug-ins

      Affiliate Program

      Awards Institution Evaluation IB Seminar Salon Event Exhibition
      Vietnam Thailand Singapore Dubai
      Fans Party Investment Sharing Session
      FastBull Summit BrokersView Expo
      Recent Searches
        Top Searches
          Markets
          News
          Analysis
          User
          24/7
          Economic Calendar
          Education
          Data
          • Names
          • Latest
          • Prev

          View All

          No data

          Scan to Download

          Faster Charts, Chat Faster!

          Download App
          English
          • English
          • Español
          • العربية
          • Bahasa Indonesia
          • Bahasa Melayu
          • Tiếng Việt
          • ภาษาไทย
          • Français
          • Italiano
          • Türkçe
          • Русский язык
          • 简中
          • 繁中
          Open Account
          Search
          Products
          Charts Free Forever
          Markets
          News
          Signals

          Copy Rankings Latest Signals Become a signal provider AI Rating
          Contests
          Brokers

          Overview Brokers Assessment Rankings Regulators News Claims
          Broker listing Forex Brokers Comparison Tool Live Spread Comparison Scam
          Q&A Complaint Scam Alert Videos Tips to Detect Scam
          More

          Business
          Events
          Careers About Us Advertising Help Center

          White Label

          Data API

          Web Plug-ins

          Affiliate Program

          Awards Institution Evaluation IB Seminar Salon Event Exhibition
          Vietnam Thailand Singapore Dubai
          Fans Party Investment Sharing Session
          FastBull Summit BrokersView Expo

          US Weekly Jobless Claims Rise; Corporate Profits Fall In First Quarter

          Thomas

          Economic

          Summary:

          Weekly jobless claims increase 14,000 to 240,000.Continuing claims rise 26,000 to 1.919 million.Corporate profits fall $118.1 billion in first quarter.Economy contracts at 0.2% rate in Q1 by all measures.

          The number of Americans filing new applications for jobless benefits increased more than expected last week and the unemployment rate appeared to have picked up in May, suggesting layoffs were rising as tariffs cloud the economic outlook.

          The report from the Labor Department on Thursday showed a surge in applications in Michigan last week, the nation's motor vehicle assembly hub. The number of people collecting unemployment checks in mid-May was the largest in 3-1/2 years. The outlook for the economy is dimming with other data showing a sharp decline in corporate profits in the first quarter.

          A U.S. trade court on Wednesday blocked most of Trump's tariffs from going into effect in a sweeping ruling that the president overstepped his authority. Economists said the ruling, while it offered some relief, had added another layer of uncertainty over the economy.

          "This is a sign that cracks are starting to form in the economy and that the outlook is deteriorating," said Christopher Rupkey, chief economist at FWDBONDS. "There is nothing great about today's jobless claims data and the jump in layoffs may be a harbinger of worse things to come."

          Initial claims for state unemployment benefits rose 14,000 to a seasonally adjusted 240,000 for the week ended May 24, the Labor Department said. Economists polled by Reuters had forecast 230,000 claims for the latest week.

          Unadjusted claims increased 10,742 to 212,506 last week, lifted by a 3,329 jump in filings in Michigan. There were also notable increases in applications in Nebraska and California.

          Despite the rise in claims, worker hoarding by employers following difficulties finding labor during and after the COVID-19 pandemic continues to underpin the jobs market.

          Nonetheless, there has been an uptick in layoffs because of economic uncertainty asTrump's aggressive trade policy makes it challenging for businesses to plan ahead.

          A report from the Bank of America Institute noted a sharp rise in higher-income households receiving unemployment benefits between February and April compared to the same period last year. Its analysis of Bank of America deposit accounts also showed notable rises among lower-income as well as middle-income households in April from the same period a year ago.

          Economists expect claims in June to break above their 205,000-243,000 range for this year, mostly driven by difficulties adjusting the data for seasonal fluctuations, following a similar pattern in recent years.

          Minutes of the Federal Reserve's May 6-7 policy meeting published on Wednesday showed while policymakers continued to view labor market conditions as broadly in balance, they "assessed that there was a risk that the labor market would weaken in coming months."

          They noted that there was "considerable uncertainty" over the job market's outlook, adding "outcomes would depend importantly on the evolution of trade policy as well as other government policies."

          The U.S. central bank has kept its benchmark overnight interest rate in the 4.25%-4.50% range since December as officials struggle to estimate the impact of Trump's tariffs, which have raised the prospect of higher inflation and slower economic growth this year.

          U.S. stocks opened higher. The dollar eased against a basket of currencies after a brief rally. U.S. Treasury yields fell.

          SWELLING UNEMPLOYMENT ROLLS

          The number of people receiving benefits after an initial week of aid, a proxy for hiring, increased 26,000 to a seasonally adjusted 1.919 million during the week ending May 17, the claims report showed. The elevated so-called continuing claims reflect companies' hesitance to increase headcount because of the economic uncertainty.

          Continuing claims covered the period during which the government surveyed households for May's unemployment rate. They increased between the April and May survey periods, suggesting an uptick in the unemployment rate this month. The jobless rate was at 4.2% in April.

          Many people who have lost their jobs are experiencing long spells of unemployment. The median duration of unemployment jumped to 10.4 weeks in April from 9.8 weeks in March.

          With profits under pressure, there is probably little incentive for businesses to boost hiring. Mass layoffs are, however, unlikely with a Conference Board survey of chief executive officers released on Thursday showing most captains of business anticipated no change in the size of their workforce over the next year even as about 83% said they expected a recession in the next 12-18 months.

          Profits from current production with inventory valuation and capital consumption adjustments dropped $118.1 billion in the first quarter, the Commerce Department's Bureau of Economic Analysis (BEA) said in a separate report. Profits surged $204.7 billion in the October-December quarter.

          Companies ranging from airlines and retailers to motor vehicle manufacturers have either withdrawn or refrained from giving financial guidance for 2025, citing the uncertainty caused by the on-again and off-again nature of some duties.

          Businesses front-loaded imports and households engaged in pre-emptive buying of goods last quarter to avoid higher costs, making it difficult to get a clear picture of the economy.

          The deluge of imports sent gross domestic product declining at a 0.2% annualized rate in the January-March quarter, the BEA said in its second estimate of GDP. The economy was initially estimated to have contracted at a 0.3% pace. It grew at a 2.4% rate in the fourth quarter.

          Thomson ReutersUS gross domestic product

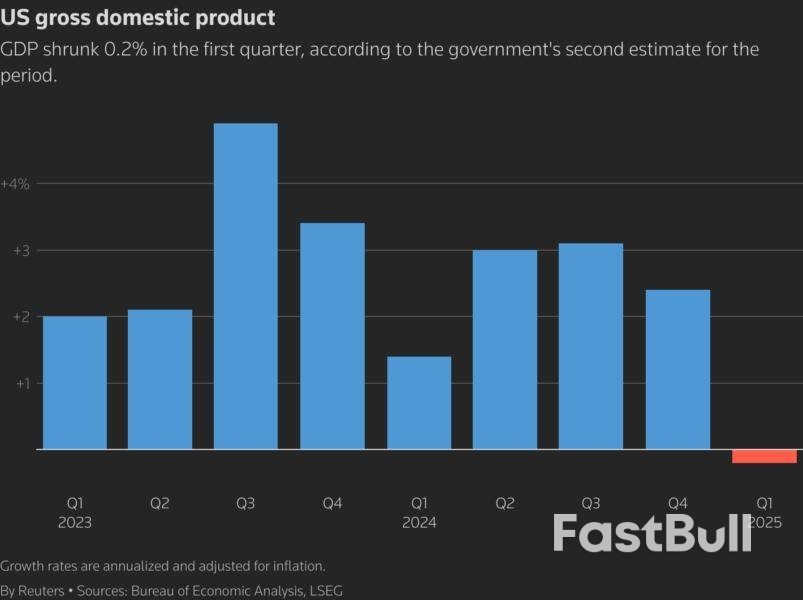
          Other alternative measures of growth, gross domestic income and gross domestic output also showed the economy contracting at a 0.2% pace in the first quarter.

          Source: TradingView

          To stay updated on all economic events of today, please check out our Economic calendar
          Risk Warnings and Disclaimers
          You understand and acknowledge that there is a high degree of risk involved in trading. Following any strategies or investment methods may lead to potential losses. The content on the site is provided by our contributors and analysts for information purposes only. You are solely responsible for determining whether any trading assets, securities, strategy, or any other product is suitable for investing based on your own investment objectives and financial situation.
          Add to Favorites
          Share

          Natural Gas News: Traders Eye 200-Day MA Support and EIA Report for Market Direction

          Adam

          Commodity

          Natural Gas Holds Steady Ahead of EIA Report as Key Technical Levels Come Into Play

          Natural Gas News: Traders Eye 200-Day MA Support and EIA Report for Market Direction_1Daily Natural Gas

          Natural gas prices remained flat Thursday, with traders holding their positions ahead of the U.S. Energy Information Administration (EIA) weekly storage report due at 14:30 GMT.
          The market is sitting just above its 200-day moving average at $3.534, a level that has consistently offered support since late April. Traders are closely watching this level for signs of trend confirmation or potential breakdown, especially with nearby contracts showing signs of weakness.

          Can the 200-Day Moving Average Continue to Provide Support?

          Price action is hovering near a critical technical inflection. The 200-day moving average has held firm in recent weeks, fending off declines near $3.381 and $3.444. A decisive break below this threshold could raise red flags for bulls, but may not necessarily trigger broad selling, given the potential for weather-driven short-covering rallies.
          Upside momentum remains capped by the 50-day moving average at $4.000, forming a well-defined range that traders will look to fade or break depending on today’s EIA outcome.

          Will the EIA Storage Report Confirm Supply Tightening?

          Consensus expectations for the upcoming EIA report point to a 93 Bcf injection, down from the prior week’s 98 Bcf and modestly reducing the surplus over the five-year average to 85 Bcf. While not overly bullish, this gradual reduction may support prices if followed by stronger power burns or cooling demand.
          Analysts, including Ritterbusch, are cautioning against reading too much into short-term weather patterns, stressing that despite a likely continued storage surplus, there’s little risk of a supply glut developing in the near term.

          How Are Weather Patterns Influencing Demand Forecasts?

          Short-term demand remains weak due to a mild national pattern, with showers and cooler temperatures suppressing consumption in the eastern half of the U.S. through early June. Texas and the South are also seeing reduced highs in the 70s and 80s, further dampening near-term power demand.
          However, NatGasWeather notes that a hotter trend is likely to emerge during the June 4–9 window, with highs in the 80s and 90s spreading across the East. This could revive cooling-related demand and lend support to the July contract.

          Market Outlook: Neutral to Slightly Bullish if Heat Builds

          In the near term, the market remains rangebound but leans slightly bullish if the June heat forecast verifies and today’s storage report aligns with or undershoots expectations. The $3.534 support level will be key—holding above it reinforces stability, while a move lower invites volatility.
          With July gas last trading at $3.57 and weather risks shifting warmer, traders should prepare for upside tests, especially if cooling demand firms into early June.

          Source: fxempire

          Risk Warnings and Disclaimers
          You understand and acknowledge that there is a high degree of risk involved in trading. Following any strategies or investment methods may lead to potential losses. The content on the site is provided by our contributors and analysts for information purposes only. You are solely responsible for determining whether any trading assets, securities, strategy, or any other product is suitable for investing based on your own investment objectives and financial situation.
          Add to Favorites
          Share

          US: A Surge In Imports Leaves A Big Mark On Q1 GDP

          Olivia Brooks

          Economic

          The second release of first quarter real GDP growth was left broadly unchanged, showing a very modest contraction of 0.2% quarter-over-quarter annualized (previously -0.3%) – a tenth below the consensus forecast. Recall, this is a notable deceleration from the 2.9% annualized rate of expansion averaged over the prior two quarters and is the first quarterly contraction in three-years.

          The slight upward revision to GDP reflected stronger investment which was partially offset by a downgrade to consumer spending.

          Consumer spending rose 1.2% (previously 1.8%), or roughly a third of the rate of expansion in the prior quarter. The downgrade was largely due to softer services spending (2.2% from 2.7%).

          Non-residential fixed investment rose 10.4% (previously 9.8%), with a surge in equipment spending (24.7%) accounting for the bulk of the gain – reflecting companies ramping up purchases ahead of the tariffs. Investment in intellectual property products (+4.6%) was also healthy, rising at the fastest annualized pace in a year.

          Residential investment was revised to a small contraction of 0.6% (previously +1.3%).

          The bulk of the pullback in GDP came from net exports. Imports surged by 42.6%, largely owing to a strong gain in goods imports (53.3%). Meanwhile, exports rose by a more modest 2.4%, resulting in net trade subtracting 4.9 percentage points (pp) from headline growth. Roughly half of the uptick in imports showed up in inventory investment, which added 2.6pp to Q1 GDP.

          Government spending contracted by 0.7%, as outlays from both federal defense (-7.1%) and non-defense (-1.2%) declined.

          Final sales to private domestic purchasers – the best gauge of underlying domestic activity – expanded by a healthy 2.5%.

          Real Gross Domestic Income (GDI) also contracted by 0.2% in the first quarter. Corporate profits fell 11.3% annualized or $118 billion after accounting for inventory valuation and capital consumption adjustments. However, this was partially offset by another solid gain in employee compensation (5.4%), which accounts for roughly two-thirds of total national income.

          Key Implications

          The second estimate of first quarter real GDP did not change the underlying narrative. Economic growth was heavily weighed down by a surge in import activity, as businesses scrambled to pull forward purchases ahead of the tariffs. Looking through the import shock, underlying domestic demand remained reasonably healthy, but this too likely captures behavior shifts related to tariffs in investment and consumer purchases, such as autos.

          As of May 28th, the U.S. Court of International Trade struck down all of President Trump’s tariffs related to the International Emergency Economic Powers Act, including the Canada/Mexico/China fentanyl tariffs, the universal 10% tariffs currently in effect and the delayed reciprocal tariffs that were slated to come back into effect as of July 9th. The court ruling has no impact on sectoral tariffs, including the steel & aluminum and auto related tariffs. While the administration has already said that they plan to appeal the ruling, timelines remain unclear. At the very least, yesterday’s announcement weakens the U.S. position in trade talks that were underway with more than a dozen nations, most notably the EU and China.

          Of the Q2 data released, there’s only moderate evidence that domestic spending has slowed in response to heightened trade uncertainty. But the pullback in Q1 corporate profits – the largest quarterly decline since Q4’2020 – is a warning sign that firms were coming under pressure, and this was before the bulk of the tariffs had even come into effect. Tomorrow’s release of the April personal income and spending will provide a more fulsome snapshot of how the consumer fared last month, and whether there’s any evidence of a softening in discretionary spending trends.

          Source: ACTIONFOREX

          To stay updated on all economic events of today, please check out our Economic calendar
          Risk Warnings and Disclaimers
          You understand and acknowledge that there is a high degree of risk involved in trading. Following any strategies or investment methods may lead to potential losses. The content on the site is provided by our contributors and analysts for information purposes only. You are solely responsible for determining whether any trading assets, securities, strategy, or any other product is suitable for investing based on your own investment objectives and financial situation.
          Add to Favorites
          Share

          Oil prices advance as US court blocks Trump tariffs

          Adam

          Commodity

          China–U.S. Trade War

          Oil prices rose on Thursday after a U.S. court blocked most of President Donald Trump's tariffs, while the market was watching out for potential new U.S. sanctions curbing Russian crude flows and an OPEC+ decision on hiking output in July.
          Brent crude futures were up 19 cents, or 0.3%, to $65.09 a barrel at 1215 GMT. U.S. West Texas Intermediate crude was up 24 cents, or 0.4%, to $62.08 a barrel.
          A U.S. trade court on Wednesday ruled that Trump overstepped his authority by imposing across-the-board duties on imports from U.S. trading partners. The court was not asked to address some industry-specific tariffs Trump has issued on automobiles, steel and aluminium using a different statute.
          "Markets are positive since Donald Trump got the setbacks on the tariffs," said Bjarne Schieldrop, chief commodities analyst at SEB. "That's less headwind for the global economy, so more demand for oil because the machine of the global economy moves better and faster."
          The ruling buoyed risk appetite across global markets, which have been on edge over the impact of the levies on economic growth, but some analysts said the relief may only be temporary given the Trump administration has said it will appeal.
          "But for now, investors get a breather from the economic uncertainty they love to loathe," said Matt Simpson, an analyst at City Index in Brisbane.
          On the oil supply front, there are concerns about potential new sanctions on Russian crude. At the same time, the Organization of the Petroleum Exporting Countries and allies, together called OPEC+, could agree on Saturday to accelerate oil production hikes in July.
          "We're assuming the group will agree on another large supply increase of 411,000 barrels per day. We expect similar increases through until the end of the third quarter, as the group increases its focus on defending market share," ING analysts said in a note.
          Adding to supply risks, Chevron (CVX.N) , opens new tab has terminated its oil production and a number of other activities in Venezuela, after its key license was revoked by the Trump administration in March.
          Venezuela in April cancelled cargoes scheduled to Chevron, citing payment uncertainties related to U.S. sanctions. Chevron was exporting 290,000 barrels per day of Venezuelan oil, or over a third of the country's total, before that.
          "From May through August, the data points to a constructive, bullish bias with liquids demand set to outpace supply," Mukesh Sahdev, global head of commodity markets at Rystad Energy, said in a note, expecting demand growth to outpace supply growth by 600,000 to 700,000 bpd.
          Later on Thursday, investors will be watching for the weekly reports from the American Petroleum Institute and the Energy Information Administration, the statistical arm of the U.S. Department of Energy.
          According to market sources familiar with the API data, U.S. crude and gasoline stocks fell last week while distillate inventories rose.
          Meanwhile, a wildfire in the Canadian province of Alberta has forced residents of a small town to evacuate and prompted a temporary shutdown of some oil and gas production, which could reduce supply.

          source : reuters

          Risk Warnings and Disclaimers
          You understand and acknowledge that there is a high degree of risk involved in trading. Following any strategies or investment methods may lead to potential losses. The content on the site is provided by our contributors and analysts for information purposes only. You are solely responsible for determining whether any trading assets, securities, strategy, or any other product is suitable for investing based on your own investment objectives and financial situation.
          Add to Favorites
          Share

          Rise In Recurring Jobless Claims Signals Higher US Unemployment

          Damon

          Economic

          Recurring applications for US jobless benefits jumped to the highest level since November 2021, possibly presaging a rise in the unemployment rate this month.

          Continuing claims, a proxy for the number of people receiving benefits, increased by 26,000 to 1.92 million in the week ended May 17. That exceeded the median forecast of 1.89 million in a Bloomberg survey of economists. The period includes the reference week for the government’s employment report for the month of May, which is due June 6.

          The numbers suggest the combined impact of the Trump administration’s trade policy and government spending initiatives are starting to take a larger toll on the labor market as those out of work increasingly struggle to find new positions. So far, it’s yet to show up meaningfully in the monthly jobs report — the unemployment rate stood at 4.2% in April, a level it first reached in July 2024.

          “We see some early signs that the labor market is starting to soften in this report, notwithstanding the risks of reading too much into one week’s numbers,” said Oliver Allen, senior US economist at Pantheon Macroeconomics. “This continuing claims number covers the employment report survey week and points to a slight uptick in the unemployment rate in next Friday’s numbers.”

          That said, the numbers are still consistent with a low-hiring, low-firing state of affairs. Initial claims increased by 14,000 last week to 240,000, a level which remains in the range of the past year.

          Separate data from the Bureau of Economic Analysis Thursday showed US gross domestic product decreased at a 0.2% annualized pace in the first quarter as consumer spending and net exports were revised lower.

          Source: Bloomberg Europe

          To stay updated on all economic events of today, please check out our Economic calendar
          Risk Warnings and Disclaimers
          You understand and acknowledge that there is a high degree of risk involved in trading. Following any strategies or investment methods may lead to potential losses. The content on the site is provided by our contributors and analysts for information purposes only. You are solely responsible for determining whether any trading assets, securities, strategy, or any other product is suitable for investing based on your own investment objectives and financial situation.
          Add to Favorites
          Share

          Deutsche Boerse rally shows a European re-rating is underway

          Adam

          Stocks

          Economic

          A rally in Deutsche Boerse (DB1Gn.DE), opens new tab shares illustrates how Europe is bridging a value gap with its Wall Street peers, as fiscal stimulus and a shift in global capital flows help drive a broad re-rating from depressed levels.
          Following a near 30% rally so far this year, the German exchange operator hit a record valuation of 25 times expected earnings, briefly surpassing all four of its major U.S. competitors by a thin margin for only the second time on record.
          This is a significant milestone in a region that over the past decade has displayed a substantial discount to the United States due to slower earnings growth and shallower capital markets.
          A year ago, the Frankfurt group traded at a 12-19% discount to U.S. exchanges ICE (ICE.N) , opens new tab, Nasdaq (NDAQ.O), opens new tab, CME (CME.O), opens new tab and CBOE (CBOE.Z), opens new tab. Now they all trade in a band of 23-25 times forward earnings. Euronext (ENX.PA), opens new tab is catching up fast too, at 20 times, while LSEG (LSEG.L) , opens new tab trades at 27 times forward earnings.
          After hitting a record 41% discount to Wall Street in November, Europe's valuation gap has shrunk by around 10 percentage points, LSEG data based on a forward price-to-earnings metric shows, a still sizeable difference.
          "It doesn't take a lot to start thinking maybe it's time for a re-rating," said Markus Hansen, a portfolio manager at Swiss investment manager Vontobel. "The valuations elastic band was so stretched that there is still more to give on this."
          U.S. tariff risks have not deterred investors from raising allocations to Europe this year, marking a reversal from years of outflows driven by American "exceptionalism".
          Europe's broad STOXX 600 index has gained 8.5% so far this year, the S&P 500 (.SPX) , opens new tab is up less than 1%.
          Anthilia fund manager Giuseppe Sersale said the re-rating also reflects renewed earnings momentum after a long stagnation and he expects the European discount to narrow further.
          European earnings growth is expected to accelerate to above 11% next year, but the American benchmark is still forecast to show superior growth until 2027, per LSEG data, suggesting profit forecasts alone do not explain this year's rare STOXX outperformance.
          A willingness by investors to pay more for European equities is helped by improving visibility over economic policy versus a less predictable Washington, German fiscal stimulus and a Europe-wide military spending boom that has boosted the perception of closer integration.
          High-flying defence stocks like Rheinmetall (RHMG.DE) , opens new tab have overshot Wall Street counterparts. However, banks (.SX7P), opens new tab - heavy contributors to Madrid (.IBEX), opens new tab and Milan's indexes (.FTMIB) , opens new tab - have only partly re-rated to U.S. peers, with Vontobel's Hansen saying there is further to go.

          LIKE THE 90S

          Some investors are drawing parallels with the period between 1992 and 1999 when a cohesive European policy backdrop supported stock valuations and Europe traded at an average discount of just 2.7% to Wall Street, widening to only around 8.5% in the first half of the 2000s.
          Analysts said further gains in the present day could be driven by the creation of a European savings and investment (SIU) union aimed at mobilising $37 trillion in household savings and deepening European capital markets.
          Under a "Blue Sky" scenario of major reforms around the saving union materialising, Morgan Stanley strategist Marina Zavolock sees European stocks potentially re-rating above 20 times forward earnings in the long-term.
          The MSCI USA index (.dMIUS00000PUS) , opens new tab trades at 21.5 times expected earnings and the MSCI Europe (.dMIEU00000NEU) , opens new tab at 14.7 times, up from a 2022 low of 10.6 times, LSEG data shows.
          Europe's exchange stocks should also benefit as greater volatility (.V2TX) , opens new tab, (.VIX) , opens new tab lifts trading volumes, analysts said.
          Tom Mills at Jefferies said Deutsche Boerse, which operates Germany's DAX index (.GDAXI) , opens new tab, should gain from the SIU.
          His top pick though is Euronext (ENX.PA) , opens new tab, which runs Paris and Milan, where luxury stocks LVMH (LVMH.PA), opens new tab and Ferrari (RACE.MI), opens new tab are listed, along with many other bourses in Europe.

          Source: reuters

          To stay updated on all economic events of today, please check out our Economic calendar
          Risk Warnings and Disclaimers
          You understand and acknowledge that there is a high degree of risk involved in trading. Following any strategies or investment methods may lead to potential losses. The content on the site is provided by our contributors and analysts for information purposes only. You are solely responsible for determining whether any trading assets, securities, strategy, or any other product is suitable for investing based on your own investment objectives and financial situation.
          Add to Favorites
          Share

          More Americans File for Jobless Aid but Layoffs Remain Low Despite Economic Uncertainty Over Tariffs

          Warren Takunda

          Economic

          Filings for U.S. jobless aid jumped last week but American workers broadly remain secure in their jobs despite economic uncertainty over global trade.
          Jobless benefits applications rose by 14,000 to 240,000 for the week ending May 24, the Labor Department said Thursday. Analysts had forecast 226,000 new applications.
          Weekly applications for jobless benefits are seen as representative of U.S. layoffs and have mostly settled in a historically healthy range between 200,000 and 250,000 since COVID-19 throttled the economy in the spring of 2020, wiping out millions of jobs.
          A sense of relief swept over financial markets early Thursday after a federal court blocked President Donald Trump from imposing sweeping tariffs on imports under an emergency-powers law. Wednesday’s decision threw into doubt Trump’s signature economic policy that has rattled global financial markets, frustrated trade partners and raised fears about inflation intensifying and the economy slumping.
          The Trump administration quickly filed notice of appeal and the Supreme Court will almost certainly be called upon to decide the issue. It remains unclear whether the White House will respond to the ruling by pausing all of its emergency power tariffs in the interim.
          Trump had already paused or dialed down many of his tariff threats, but concerns lingered about a global economic slowdown upending a robust U.S. labor market.
          In early May, the Federal Reserve held its benchmark lending rate at 4.3% for the third straight meeting after cutting it three times at the end of last year.
          Fed chair Jerome Powell said the potential for both higher unemployment and inflation are elevated, an unusual combination that complicates the central bank’s dual mandate of controlling prices and keeping unemployment low. Powell said that tariffs have dampened consumer and business sentiment.
          The government reported Thursday that the U.S. economy shrank at a 0.2% annual pace in the first quarter of 2025, a slight upgrade from its first estimate. Growth was slowed by a surge in imports as companies in the U.S. tried to bring in foreign goods before Trump’s massive tariffs went into effect.
          Trump is attempting to reshape the global economy by dramatically increasing import taxes to rejuvenate the U.S. manufacturing sector.
          Trump has also tried to drastically downsize the federal government workforce, but many of those cuts are being challenged in the courts and Congress.
          Despite showing traces of weakness during the past year, the labor market remains robust, with plentiful jobs and relatively few layoffs.
          The government reported that U.S. employers added a surprisingly strong 177,000 jobs in April and the unemployment rate held at a healthy 4.2%.
          Companies that have announced job cuts this year include Workday, Dow, CNN, Starbucks, Southwest Airlines, Microsoft and Facebook parent company Meta.
          Labor reported Thursday that the four-week average of jobless claims, which evens out some of the week-to-week ups and downs during more volatile stretches, ticked down by 250 to 230,750.
          The total number of Americans receiving unemployment benefits for the week of May 17 increased by 26,000 to 1.92 million, the most since November of 2021.

          Source: AP

          To stay updated on all economic events of today, please check out our Economic calendar
          Risk Warnings and Disclaimers
          You understand and acknowledge that there is a high degree of risk involved in trading. Following any strategies or investment methods may lead to potential losses. The content on the site is provided by our contributors and analysts for information purposes only. You are solely responsible for determining whether any trading assets, securities, strategy, or any other product is suitable for investing based on your own investment objectives and financial situation.
          Add to Favorites
          Share
          FastBull
          Copyright © 2025 FastBull Ltd

          728 RM B 7/F GEE LOK IND BLDG NO 34 HUNG TO RD KWUN TONG KLN HONG KONG

          TelegramInstagramTwitterfacebooklinkedin
          App Store Google Play Google Play
          Products
          Charts

          Chats

          Q&A with Experts
          Screeners
          Economic Calendar
          Data
          Tools
          Membership
          Features
          Function
          Markets
          Copy Trading
          Latest Signals
          Contests
          News
          Analysis
          24/7
          Columns
          Education
          Company
          Careers
          About Us
          Contact Us
          Advertising
          Help Center
          Feedback
          User Agreement
          Privacy Policy
          Business

          White Label

          Data API

          Web Plug-ins

          Poster Maker

          Affiliate Program

          Risk Disclosure

          The risk of loss in trading financial instruments such as stocks, FX, commodities, futures, bonds, ETFs and crypto can be substantial. You may sustain a total loss of the funds that you deposit with your broker. Therefore, you should carefully consider whether such trading is suitable for you in light of your circumstances and financial resources.

          No decision to invest should be made without thoroughly conducting due diligence by yourself or consulting with your financial advisors. Our web content might not suit you since we don't know your financial conditions and investment needs. Our financial information might have latency or contain inaccuracy, so you should be fully responsible for any of your trading and investment decisions. The company will not be responsible for your capital loss.

          Without getting permission from the website, you are not allowed to copy the website's graphics, texts, or trademarks. Intellectual property rights in the content or data incorporated into this website belong to its providers and exchange merchants.

          Not Logged In

          Log in to access more features

          FastBull Membership

          Not yet

          Purchase

          Become a signal provider
          Help Center
          Customer Service
          Dark Mode
          Price Up/Down Colors

          Log In

          Sign Up

          Position
          Layout
          Fullscreen
          Default to Chart
          The chart page opens by default when you visit fastbull.com